Asymco

Asymmetric Intelligence

platform

  1. Measuring US Mobile Platform Shares: Kantar vs. comScore

    Research · 34 comments

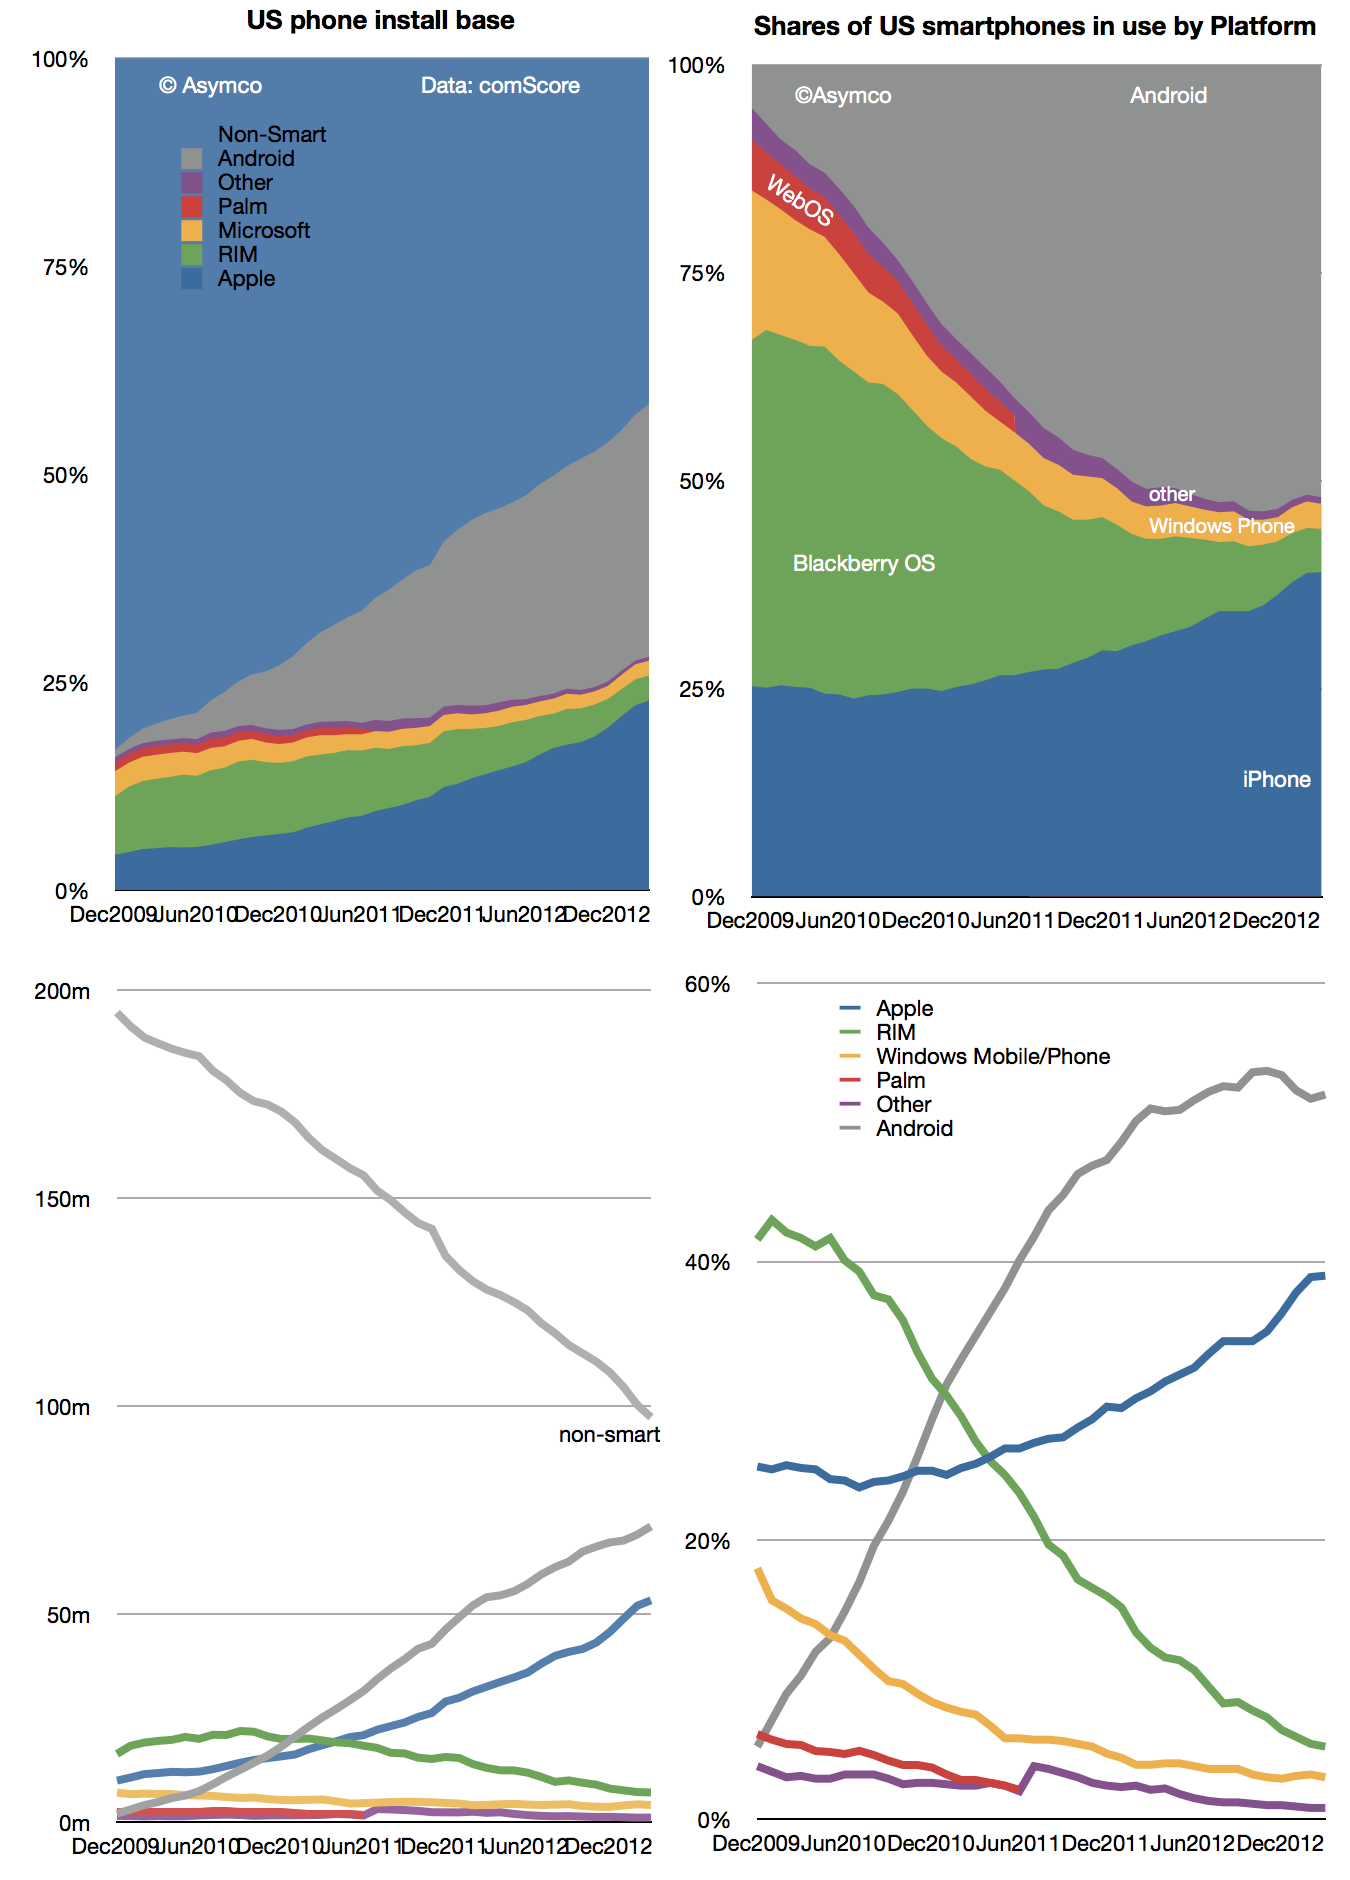
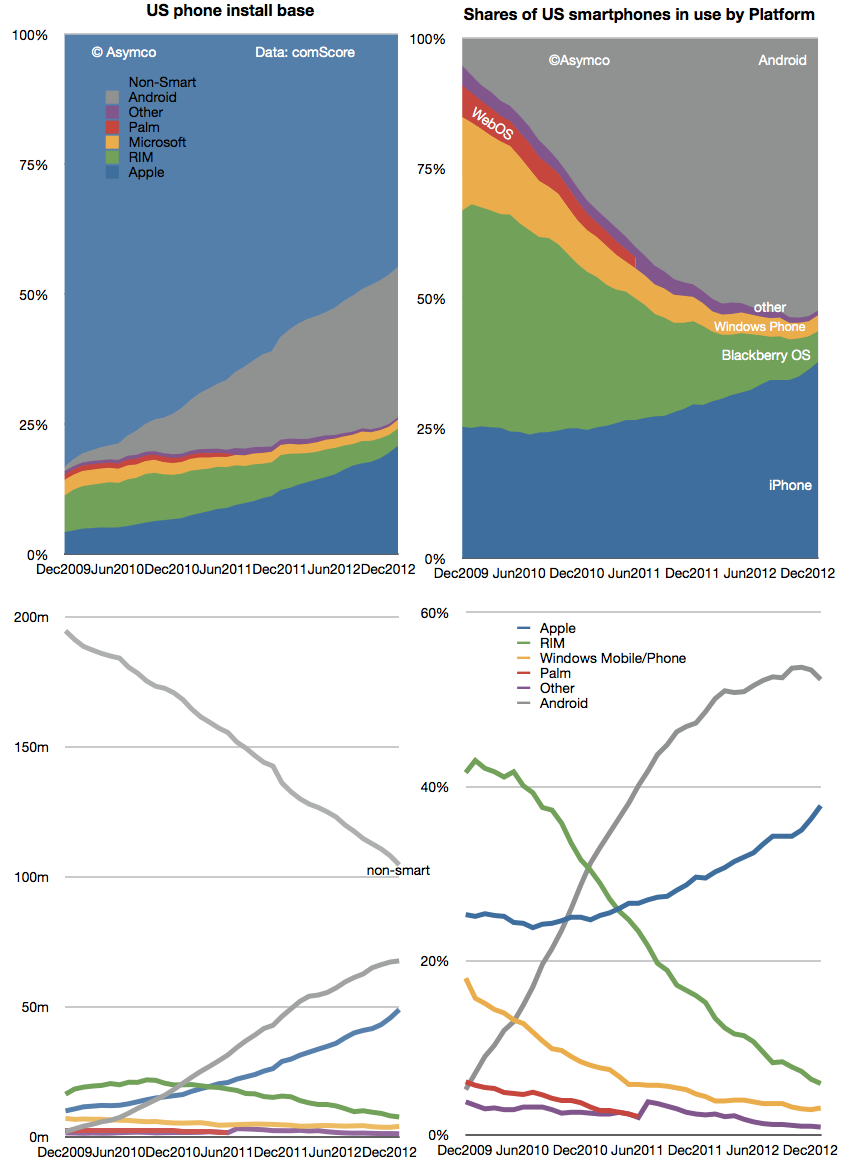
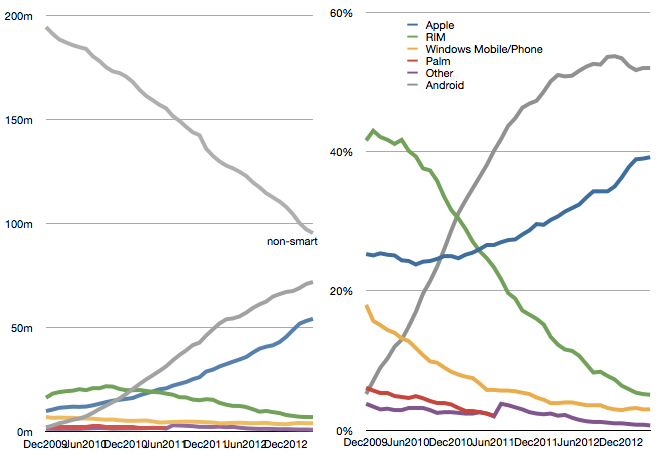
    The latest comScore US smartphone install base data is in and there are few surprises. iPhone has reached a new record high penetration (39.2%) and user base (54.3 million). Android has reached a new high in user base (72 million) but share at 52% is below the peak reached in November 2012.
    Screen Shot 2013-06-05 at 6-5-3.48.35 PM

    This pattern of gradual iPhone share gain in the US has been consistent for over two years even while Android has catapulted into an overall lead. The surprising thing is how Android seems to have peaked in share. There are still 95 million non-smartphone users and there seems to be headroom for growth even though the other platforms have been tapped out. But it does not seem that Android phones have any particular advantage over iPhone. My hypothesis remains that as price is taken out as a differentiation, the adoption of iOS is slightly higher than Android.

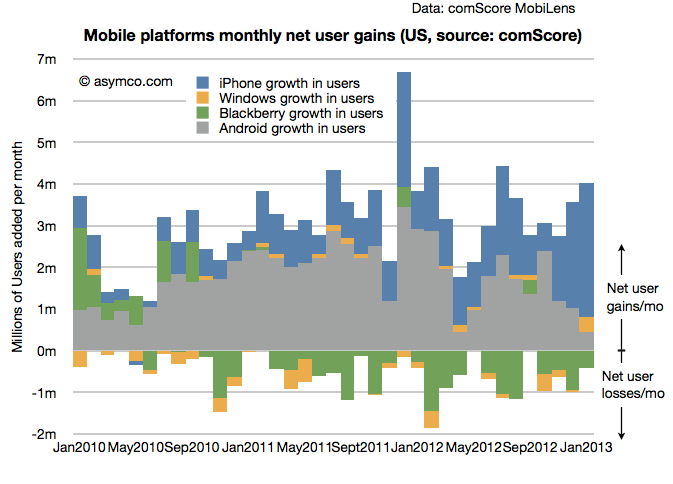
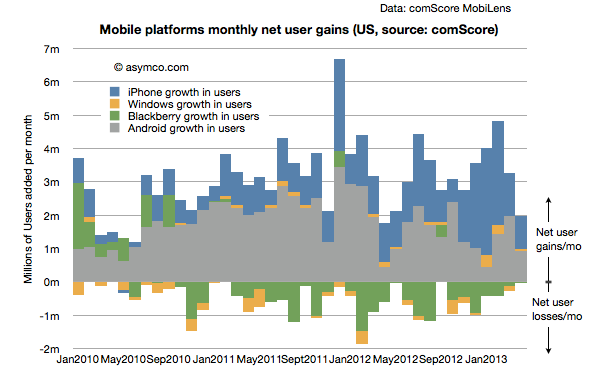
    Another measure of market performance is the implied net platform user gains which is shown below:
    Screen Shot 2013-06-05 at 6-5-3.23.55 PM

    It shows that iOS added more users in the last few months than Android.

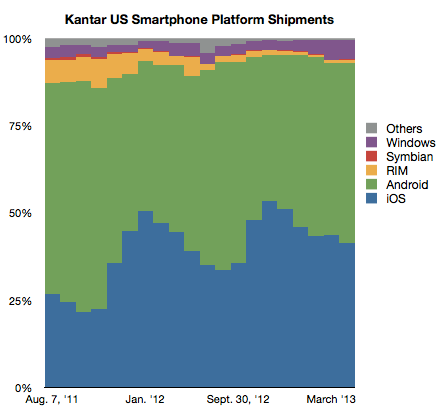
    The problem is that Kantar Worldpanel measures shipments and their share data shows a seemingly different picture.
    Screen Shot 2013-06-05 at 6-5-3.22.23 PM

    In their data Android is shown as selling more units during January through April while Apple sold more during October through December. Of course we don't have the absolute number of units so can't see the effect of higher holiday overall sales volume. Nevertheless, the balance of growth seems to be disproportionately in favor of Android relative to the data from comScore.

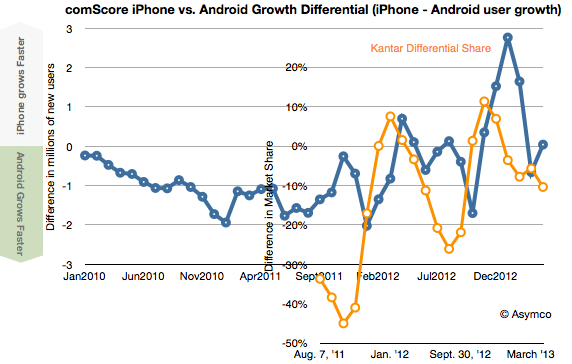
    To look at the situation more closely I measured the differential in user adds for comScore and the differential in market share for Kantar's data. Then I overlaid the two differentials so that months are matching, as shown below:
    Screen Shot 2013-06-05 at 6-5-3.51.57 PM

    There is a similarity to the frequency of oscillation with comScore data showing a delay (as would be expected since their data is sampling over a three month period). However, we are still facing a vertical offset where there is apparently more growth bias for iPhone in the comScore data.

    Possible factors which might be explanatory:

    • Methodologies used. comScore data excludes ages below 13 and non-personal devices (business expensed phones.) 
    • Replacement sales are invisible in comScore data since the user base does not change when phones are replaced (and old ones are discarded.)
    • Missing data from Kantar. Given their survey methods it's possible that their panels miss some market segments.
  2. Forecasting Windows market share

    Research · 80 comments

    Last week Frank X. Shaw, VP of corporate communications at Microsoft stated:

     ... most of the people around me were using their iPads exactly as they would a laptop – physical keyboard attached, typing away, connected to a network of some kind, creating a document or tweet or blog or article. In that context, it’s hard to distinguish between a tablet and a notebook or laptop. The form factors are different, but let’s be clear, each is a PC.

    Actually this "admission" that iPads are PCs is not something new. Steve Ballmer made the same assertion in 2010 pre-iPad (though calling them slates). Arguably, the notion that tablets are PCs has been dogma at Microsoft for over a decade and Windows running on all form factors has been a strategic guiding principle.

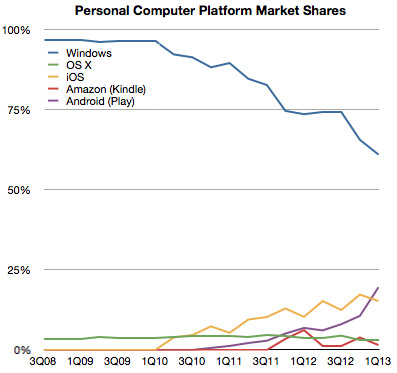
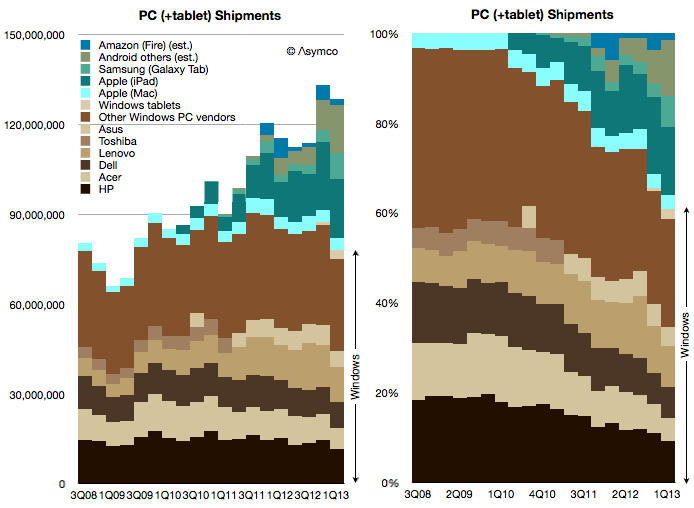
    Which is why I've always added the tablet data to the PC data to create a picture of the "personal computing" market. And this is what that picture looks like today:

    Screen Shot 2013-06-03 at 6-3-5.31.21 PM

    Note how the share of various platforms has evolved over this brief time span:

    Screen Shot 2013-06-03 at 6-3-5.32.43 PM

    Seen this way, Windows has now reached 60% market share and it's likely to dip below 50% during this year. What happens beyond then is harder to imagine. If Windows tablets start growing as fast as the tablet market overall then Windows could stabilize in share. But if Android and iOS tablets follow their phone brethren in growth then it will be far harder for Microsoft to maintain share. But is that cause for concern?

    Not necessarily.

    The total computing market[1] is likely to expand to over 4 billion users with 1.5 devices per user in the next five years. That expansion implies that 20% share equals more than one billion devices, making such an ecosystem "good enough" for the average developer. It certainly has been good enough for Windows developers to date and they have kept hiring it throughout the new mobile app revolution.

    So even if Windows dips to only 20% of the world's computing market it will still be perfectly "viable" for some time to come.

    --

    1. I define the computing market as the total number of devices which have (a) a CPU (b) a broadband connection (c) a native application execution environment which is open to third party apps. This definition implies the presence of an "ecosystem" which is bound specifically to a platform.
  3. Measuring Platform Churn

    Research · 33 comments

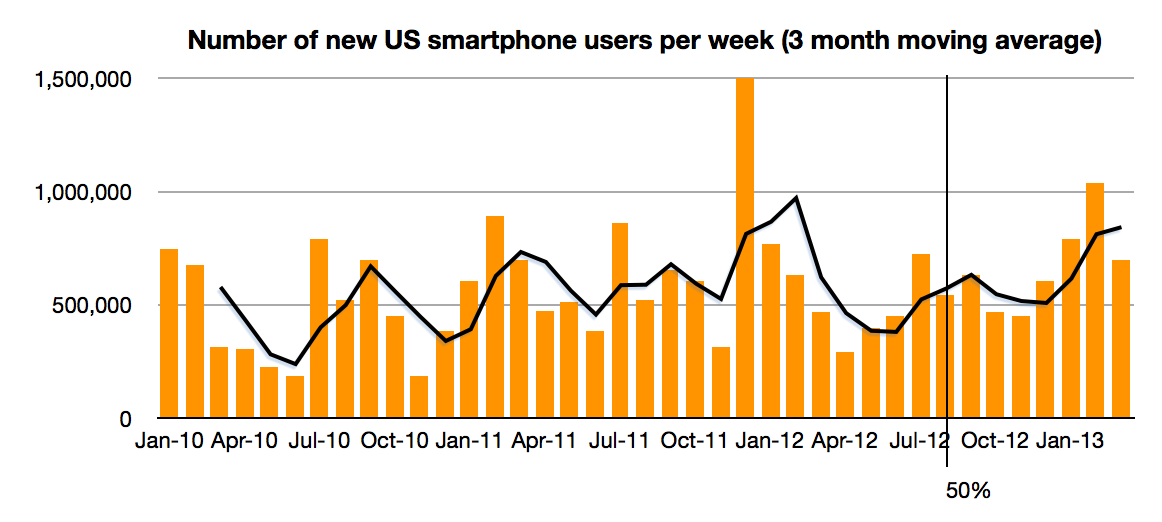
    The latest comScore data shows consistent growth in US smartphone penetration. The rate is now 58.4% of adult consumers who own phones. This is up from 20% only three years ago. The rate of growth remains a remarkable 1.2% per month. That's 700,000 new-to-smartphone users every week. The historic average over 3 years has been 1.07%/month This after having crossed over 50% on schedule in August 2012. There appears to be no slowing.

    Screen Shot 2013-05-06 at 5-6-5.42.50 AM

    The next milestone I have pencilled in is the 80% mark which I extrapolate to be achieved by October 2014. 80% could be considered "saturation" which would signify a rapid slowing of new user addition. However, that might still not happen until 100%, depending on the availability (or lack thereof) of non-smartphones to buy.

    This time frame is important because it would imply that essentially all mobile users in the US (some 234 million) would be a part of one ecosystem in about 2 more years. That's less than the life cycle of the typical mobile contract (and thus the life of one phone). Put another way, by the time a new buyer today is ready to buy the replacement to their phone the market will be saturated.

    This implies the mode of competition will be changing to smartphone replacement rather than smartphone adoption. To some degree this is already happening but as the net user gains data shows only BlackBerry and Windows platforms have had any net user declines in the last two years. "Platform churn" is still a relatively rare phenomenon.

    How that will change post-saturation will be a crucial determinant to platform growth. The data today points to a higher degree of loyalty for iOS users and potential erosion in the Android user base as a result. There are ways of forecasting this on the basis of survey data as Carl Howe did. However, the data from comScore has already begun to show that Android may have peaked around 54% share. Android share is now at the same level it was in July while iPhone share has grown by more than 6 points since then.

    Screen Shot 2013-05-06 at 5-6-5.40.28 AM

    There is a pattern of higher growth into the end of the year and an iPhone plateau into the first quarter, undoubtedly due to holiday buying favoring the iPhone. I don't want to discount the possibility of some change in this pattern but so far there seems to be a plausible reason for it: with iPhone pricing and availability in the US offering no advantages to alternatives, Apple's product is the most popular. Nearly more popular even than all the other competitors combined.

  4. Lumia: Is the light visible?

    Research · 64 comments

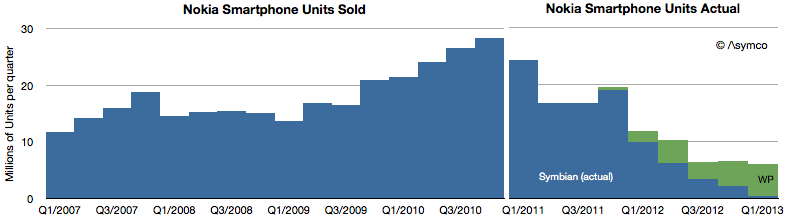
    The following graph shows the history of smartphone volume shipments from Nokia.

    Screen Shot 2013-04-18 at 4-18-1.48.21 PM


    Lumia sales have increased to 5.6 million units last quarter. Up from 4.4 during the previous quarter. Symbian devices have nearly disappeared from the market with only 0.5 million shipped.

    This puts an end to Symbian sales after over a decade since sales start and two years after it was declared that sales would end.

    The bad news remains that smart devices as defined by Nokia are still not profitable. If volumes grow it's possible that the cost structure (without further cuts) can be sustained and perhaps the business will get its footing.

    The level of 6 million units/quarter is about where HTC and RIM are today but only half of what ZTE and Huawei are probably shipping. As a hardware business it might work, barely. It certainly helps to have $250 million as platform support payments from Microsoft.

    As a platform it's still a very long haul for Windows Phone. Even if we assume a nominal $15 revenue/ Windows Phone license and ignore the kickback, at this level of sales the platform generates less income than what Microsoft gets from licensing IP to Android vendors.

  5. Samsung vs. Google: an Interview with Rafael Barbosa Barifouse of Redacao Epoca

    Research · 60 comments

    On Mar 18, 2013, Rafael Barbosa Barifouse - Redacao Epoca - Editora Globo asked (and I answered):

    Q: Why is Samsung creating Tizen?

    A: I believe they are collaborating on Tizen development because they want an alternative to Android and because Bada was not good enough to meet that goal. Tizen's roots include contributions from Intel, Nokia and several Japanese companies so it's not Samsung's OS per se. Historically it was the "open" alternative operating system for embedded and mobile systems. See https://github.com/kumadasu/tizen-history/blob/master/tizen-history.pdf for a historic perspective.

    In some ways Tizen seems to be a blend of several pieces of code including proprietary Samsung user interfaces. Samsung is presumably interested in having a unique, differentiated experience. This is something every device maker seeks. Put another way, if they did not seek this then it's unlikely that they would be profitable which would also imply that they would not invest in marketing and development of products. As Samsung invests both in marketing and development it can be concluded that they seek to offer a unique value proposition and, in today's market, that means a unique experience.

    Does it make sense to create a new mobile OS when it has had so much success with Android?

    Samsung would argue that the success it's had is not due to Android but to its products. Arguably they are right because if Android were the valuable component in a phone then buyers would buy the absolute cheapest device that runs Android regardless of brand. That is not the case. People still seek out a particular brand of phone because of the promise it offers. Consumers have been buying more Galaxies than no-name Android phones.

    Why is Samsung the most successful company between the Android devices makers?

    In my opinion it's due to three reasons:

    1. Distribution. Success in the phone business depends in having a relationship with a large number of operators. Samsung had these relationships prior to becoming a smartphone vendor [because it sold all other kinds of phones]. Few alternative Android vendors have the level of distribution Samsung has. For comparison Apple has less than half the distribution level of Samsung and most other vendors have less than Apple.
    2. Marketing and promotion. Samsung Electronics spent nearly $12 billion in 2012 on marketing expenses of which $4 billion (est.) was on advertising. Few Android vendors (or any other company) has the resources to match this level of marketing. For comparison, Apple's 2012 advertising spending was one quarter of Samsung's.
    3. Supply chain. Samsung can supply the market in large quantities. This is partly due to having their own semiconductor production facilities. Those facilities were in a large part built using Apple contract revenues over the years they supplied iPhone, iPad and iPod components. No Android competitors (except for LG perhaps) had either the capacity to produce components or the signal well in advance to enter the market in volume as Samsung did by being an iPhone supplier.

    Tizen was being treated as an OS for low and mid level devices, but recently Samsung said that it will launch a high-end device with Tizen on Q3, an area where it's very successful with Android. What has changed? What does this announcement mean?

    Planning for these product launches is done a few years prior to launch. I believe alternatives to the Android line (i.e. Galaxy) have been planned for a long time. Note that Samsung also has a line of Windows Phones and historically has supported Bada, Windows Mobile, Symbian, PalmOS and LiMo smartphone platforms. Samsung's involvement with Android is only about three years old, and arguably only enjoyed two years of prominent growth. That's less than one product launch cycle and far less than a platform or OS development cycle.

    I believe the company has a long term perspective and that includes a time span beyond the likely lifetime of Android [Note that platforms do have finite lives]. Keep in mind that phones last less than two years. If users are not loyal to a platform then they will very quickly move on. The "stickyness" of a platform depends on media or software consumption by the user. That level of consumption is not particularly high for most Android users. The same phenomenon happened with Symbian and BlackBerry and Windows Mobile users. Hundreds of millions switched or will switch out of those platforms. This happens far less with iOS, Mac OS X and Windows because of the significant investments users make in the ecosystems above the OS.

    Is Google dependent on Samsung's sucess with Android? Or Samsung is more dependent on Android since its the most popular mobile OS nowadays?

    Google is not dependent on Samsung because it's not dependent on Android. Samsung is not dependent on Google because Samsung is not dependent on Android. Android is valuable in theory but in practice its value is hard to identify. Historically it was planned as a defense against the hegemony of Windows, BlackBerry and iOS. In that respect it has succeeded. But playing defense is not enough to win a game. For Google to truly succeed in mobile it needs to define a better business model.

    So far its profitability from mobile is very weak and has not shown up in the bottom line. Furthermore, it's probable that Google has 'control' over only about 40% of Android devices in use. Control here means a guarantee that users will use those devices for the benefit of Google, and, more importantly, not for the benefit of its competitors.

    You can also think of it this way: If they "divorced" there would be minimal to no impact to their fortunes in the foreseeable future. Buyers of Samsung phones will still buy Samsung phones because they will look and feel very similar and Google services will still be available through browsers or apps (e.g. Google maps on iOS). Conversely, users of Google services will continue to use them because they will be available on Samsung devices, no matter what OS is running. The services Google offers are independent of Android and are cross-platform. They will make sure they are available on all major platforms (as they were before and during Android). Google is far more loyal to Search and Maps and Gmail and YouTube than they are to Android.

    Do you think Google is going to merge Android with Chrome OS?

    Google's chairman said they would so I assume they will.

    If so, how this could make an impact on Samsung?

    It depends on how the new OS would enforce licensing terms. If the result would be a restriction on Samsung services like S Pen, AdHub, Samsung Wallet, SmartTV, ChatON etc. then Samsung might reject the OS and either fork Android or move to Tizen more broadly.

  6. Where are the Android users?

    Research · 172 comments

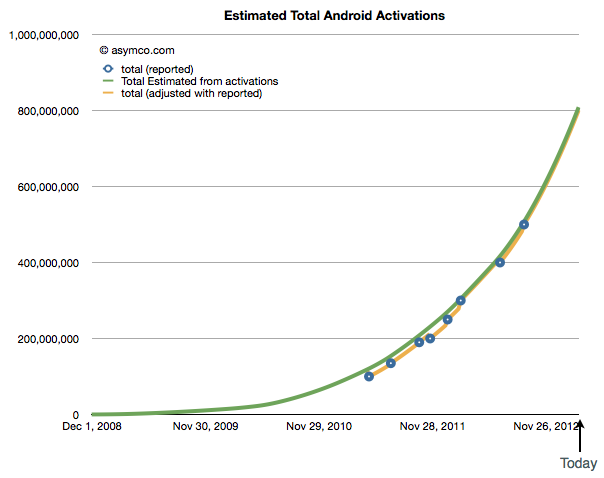
    Google occasionally reports data regarding Android. Very occasionally. The last time we had some data was in September 2012 when we learned that activations were running at 1.3 million per day and that a total of 500 million total activations had taken place.

    As of today, being March 2013, the time between updates has reached five months. It's the longest gap so far. Benedict Evans also notes that it's been five months since the data regarding screen size stats has been updated on the Android developer site.

    But we have to live with what we get and, in the absence of an update, the pattern of growth in Android, if sustained, looks like this:

    Screen Shot 2013-03-10 at 3-10-11.05.14 PM

    It implies that 800 million Android activations have taken place to date and the rate is about 2 million per day. One billion activations could thus happen by June.

    There is however another set of data regarding Android which is updated more frequently. The comScore mobiLens survey covers the US and provides updates on a monthly basis. That data shows that Android users in the US reached about 68 million as of the end of January. See the updated data below:

    Screen Shot 2013-03-11 at 3-11-10.26.01 AM

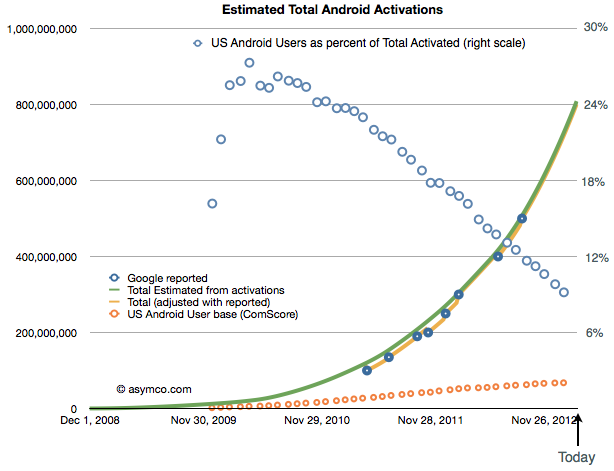
    I included the install base and share of total users as reported. Combining the comScore data with Google's activations gives the following picture of US as a percent of global Android (orange circles represent US base and blue circles the precent of total activations that the US might represent)[1].

    Screen Shot 2013-03-10 at 3-10-11.44.34 PM

    The data implies about 9% of Android usage is in the US. The more startling thing is the difference in growth: it implies that with a US growth rate of only about 13.3k/day, global growth is 150 times faster than US growth. In other words, that 0.6% of new users are in the US and that 99.4% of Android growth is outside the US.

    That's an interesting story. But it's even more interesting that this is not the case with the iPhone. The iPhone is growing considerably faster in the US than Android. One can see this more easily with a graph of the US mobile platform net user gain rate as shown below:

    Screen Shot 2013-03-11 at 3-11-10.32.23 AM


    Looking at the the same contrast between global and US, from Apple's financial reports, in the fourth quarter the global "activation rate" (i.e. sales rate) for iPhone was 525k/day (nearly one quarter of the extrapolated Android rate). The comScore data suggests the US gains are running at 106k/day. Therefore we can calculate that about 20% of iPhone growth is in the US and 80% is outside the US.

    Even accounting for some potential error in the Android estimates, the contrast is quite stunning: 1% vs. 20% share of growth suggests something is very different about the US with respect to the two platforms.

    My suspicion is that it has something to do with the fact that the US is one of the few (but largest) market where the iPhone is available as a "low end" offering. At a minimum price of $0 (with a contract) many consumers are finding the iPhone attractive relative to a $0 (with a contract) Android phone. This price parity (illusory as it may be) allows iPhone to grow even faster than Android in this particular market.

    One wonders what would happen if such price parity were present globally.

    ---

    Notes:

    1. Android activation data as reported by Google includes tablets but excludes many unofficial Android builds e.g. Amazon Kindle and many Chinese phones and tablets that don't register with Google services. comScore data includes only primary devices used by consumers and excludes corporate purchases and devices whose primary users are younger than 13 years.
  7. LG's new Tele-vision

    Research · 17 comments

    LG Electronics has acquired HP's WebOS for an undisclosed amount. When last it changed hands WebOS was part of Palm which was purchased for $1.2 billion in 2010.

    Palm has thus been effectively divided into several smaller pieces distributed as follows:

    HP will own:

    • Support of existing Palm users
    • Palm back-end assets including source code, infrastructure and talent
    • webOS patents

    LG will own:

    • Stewardship of the Open WebOS and Enyo open-source projects where the source code resides
    • Associated talent
    • WebOS websites
    • License for IP related to webOS

    LG announced that it plans to offer an "intuitive user experience an Internet services across a range of consumer electronics devices." In an interview, the CTO of LG said that given the current situation with Android, LG does not plan on making smartphones running webOS but will use it in televisions and other devices such as cars, signage and appliances where there are no embedded OS's. "We'd like to secure a software platform across all devices."

    Most commentary regarding the deal focused on the use of the platform for TVs but management seems to consider all devices, perhaps even phones, at some future date, to be webOS targets.

    The TV however seems to be low hanging fruit today. The TV as an app platform will be the new ecosystem war and no platform today has a lock on the developers or users. The way this rivalry will shape up will not mirror other device classes for the same reason that current device classes are platform silos.

    PCs, music players, tablets and phones all have different super-majority platform leaders. The association of a platform with a device class depends first on the distribution model, which favors a specific business model which favors a specific vendor which favors a specific platform. As each device is distributed differently, a different platform takes precedence.

    Consider that the PC has historically been purchased by IT departments which led to a monoculture of Windows which led to a persistent leadership for Microsoft.

    The music player created dominance around iTunes mostly because the distribution model for music labels was baked-in. With network effects, the iPod quickly gained and perpetually retained market share leadership.

    The smartphone business initially favored Symbian and BlackBerry because they had the market access through operators. After the touch UI became dominant (and incumbents failed to respond in a timely manner), Apple and Google took leadership as soon as they accepted the operator distribution model. Android in particular is especially resonant with operators and has been developed with their requirements in mind.

    The tablet business is more like the PC business but without enterprise requirements or patterns of purchase. This has meant that app/content ecosystems and retail distribution were the key gating factors. The story is still unfolding but so far Microsoft has not found a foothold while iOS and Android and Amazon have.

    That leads to the question of how will smart TVs be sold and which business model (or go-to-market strategy) will succeed. Steve Jobs pointed out the difficulty in trying to deliver innovation into a value chain dominated by cable companies which can effectively block it. A TV which is an application execution device rather than a content terminal will require a re-definition of the category. That will require a re-positioining of this product. Few companies are able to do that. [See also my post Tele Vision from mid-2011].

    Which brings us back to the question of webOS. As long as LG sells TVs as content terminals they might not obtain much value from webOS. If, on the other hand, LG were to use webOS to re-define their televisions to be something else entirely, namely software execution devices, sold differently and hired to do a different job than a TV, then webOS becomes not only necessary but potentially a source of great prosperity.

  8. The race to a billion—2012 Update

    Research · 66 comments

    I last looked at the race to a billion in March 2011. Since then, I've been updating and adding data to the set giving a broader selection of platforms to compare.

    Before we dive in, an explanation: the initial review excluded Windows (PC) and Facebook mainly because (a)  the ramp scale I'm using is about a decade in duration and (b) I was reluctant to compare platforms that require payment to join to those that don't. The (DOS/Windows) PC ramped over several decades (starting in 1981) and Facebook is a service that costs nothing to join. There was much gnashing of teeth and shaking of fists as a result.

    Therefore, in the interest of inclusion, I added both to the data set and let the chips fall where they may.

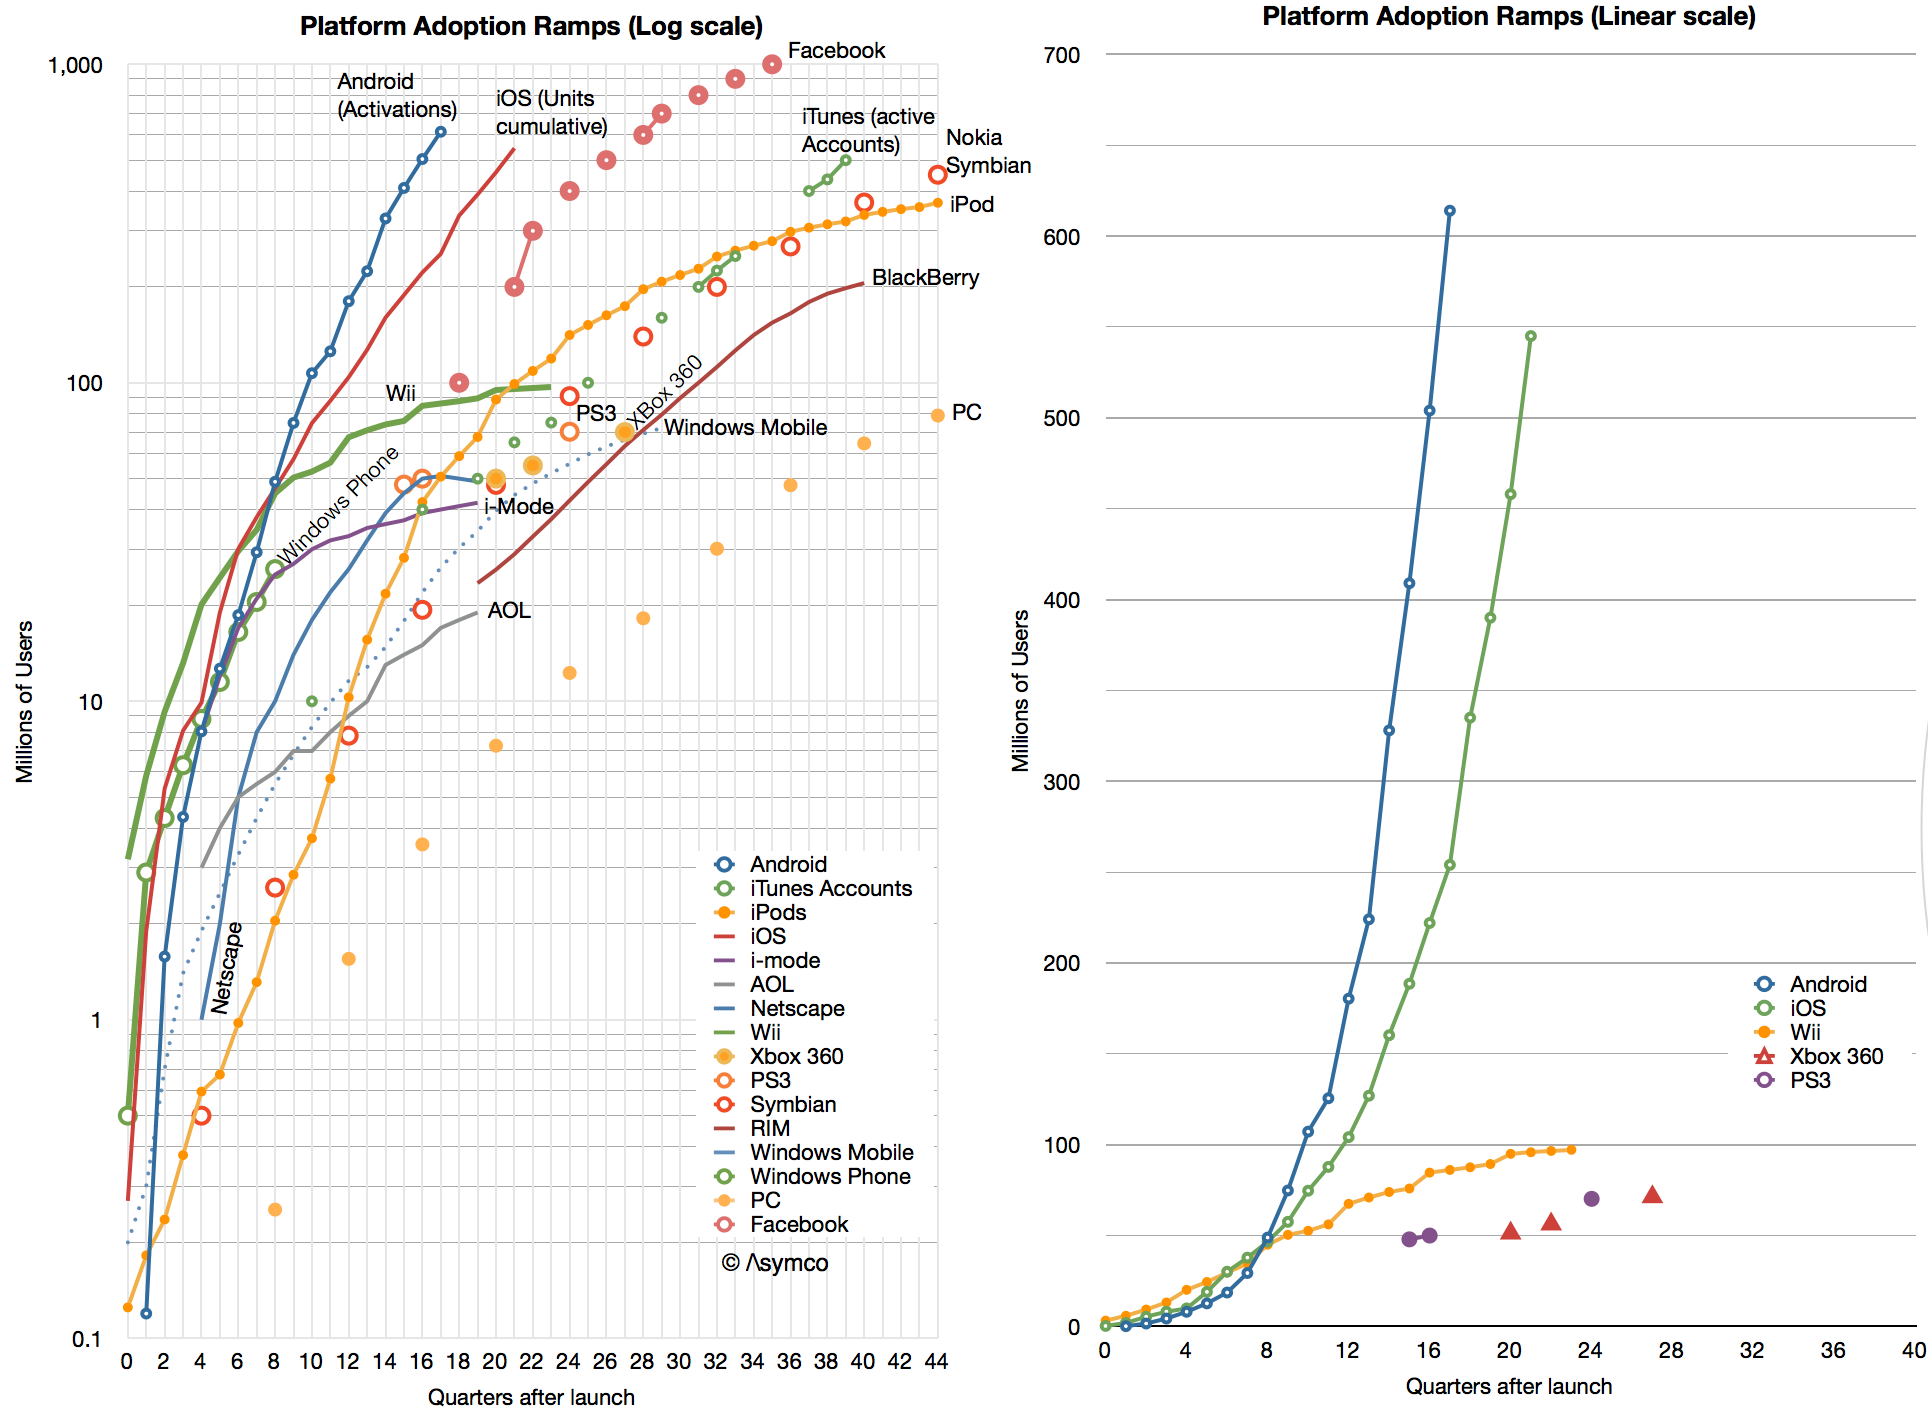
    The data is shown below.

    Screen Shot 2013-01-16 at 1-16-2.11.50 PM

    I kept the scale to about a decade so that individual lines can be resolved. As a result, you'll note that although Windows reached one billion first it did so slowly enough to be off the scale shown. Indeed, the "race to a billion" should be titled  "The race to one billion users in less than a decade".

    In such a competition, the winner would be Facebook which, in October 2012, 35 quarters after launch, reached the finish line. The second looks to be Android (probably this year) and the third iOS (sometime next year.)

    That may sound like the end of it, but what the graph also shows are the more subtle trends:

    • Game consoles seem to saturate at below 100 million total. One can see the difference in ramps between recent mobile platforms and consoles in the second chart. There might be implications for which platforms will end up dominating the entertainment industry. There should also be some explanations of why consoles are so limited.
    • iTunes accelerated with iOS and left the iPod behind. This is unsurprising but it shows that a content platform can be more flexible than one attached to any particular device or architecture. An important lesson perhaps for those in the content businesses.
    • Early mobile platforms like Nokia's Symbian, RIM BlackBerry and Windows Mobile have faded indicating that there was no early-mover advantage in platforms. The same can be said for early PC platforms.
    • Windows Phone began by tracking the Android/iOS ramps but seems not to be accelerating into its second year in a way that implies potential parity.
    • Although Facebook did reach 1 billion rather quickly the slopes of Android and iOS indicate that they may overtake it in overall ecosystem size.

    One billion is significant in several ways: First, because it is the "high-water mark" set by Windows and signifies what a global platform needs to become to be essentially "universal". Second, because it implies sustainability. A threshold perhaps from which network effects are sufficient to sustain (assuming some switching costs and an ability and willingness to adapt e.g. software, content or time investments from users.) Third, because it implies sufficient value to the ecosystem (assuming a monetization mechanism exists e.g. Windows software developers and IT managers.)

    Looking beyond this milestone however, there is no reason why it should be thought of as a barrier. Mobile connections number over 5 billion and computing is likely to reach most of them. Therefore one billion may turn out to be only 20% penetration. In fact, I expect this series of posts will need to be updated in 2013 as "The race to two billion."

  9. Getting to know the meaning of sisu

    Research · 13 comments

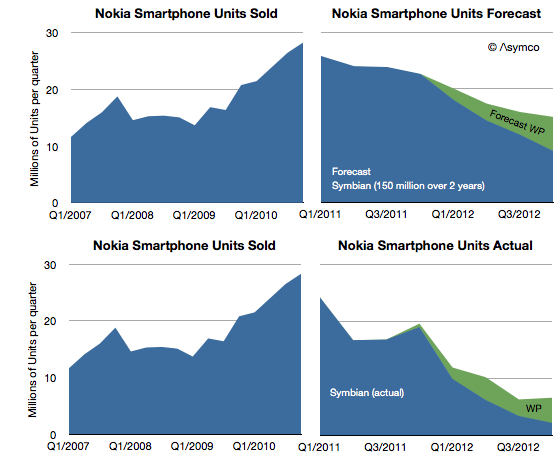
    Nokia announced 4.4 million Lumia smartphones were shipped in Q4. That's about 14 million since the Lumia line was launched a year earlier. It isn't however nearly enough to replace the lost sales from Symbian. One year earlier Nokia shipped 19 million Symbian phones in the fourth quarter and the year before 28.3 million. The history of smartphone sales from Nokia is shown below:

    Screen Shot 2013-01-10 at 1-10-6.23.00 PM

    I repeated the forecast I drew up in February 2011 when the platform switch was announced. That forecast was based on the company stating that 150 million Symbian phones would still be shipped. Symbian fell far more rapidly than I (and Nokia) expected and to date only 98 million have shipped. The last quarter's 2.2 million seems to be so low that it will be hard to imagine the platform lasting more than a few quarters.

    My forecast for Windows Phone was 15 million (through Q4/2012) and the 14 million actually shipped is not far off. However, note that the sequential growth into the fourth quarter was lower than the same period last year. For the holiday quarter Nokia received almost no boost. If there is reason to be optimistic it's that there wasn't a decline in overall smartphones into Q4.

    The overall result is that Nokia remains in an operating loss status and it's going to be very hard to recover. No phone vendor has successfully recovered to date. The company managed to book a €50 million one-time payment for IP rights (presumably from RIM) and is sustained by royalties and platform support payments from Microsoft. But even so it's barely breaking even.

    The prospects for Windows Phone may be improving however. Operators in the US continue to talk about it. We don't have a split for AT&T's push this past quarter and estimates suggest that 80% of smartphone from AT&T were still iPhones but Verizon will also push the platform and there are suggestions it's doing well in Germany. HTC has also launched some WP flagship phones and may have had a good December as a result.

    That translates into steady progress. But the growth of Android and iOS continue as well. Windows Phone needs to continue to persevere in adverse conditions for years to come. The Finns know a thing or two about that.

  10. How much do maps cost and what are they worth?

    Research · 68 comments

    How much does it cost to have the world's best maps?

    The answer may seem simple: $8.1 billion.

    That was the cost to Nokia in cash for buying Navteq in October 2007. It would seem that buying that asset (or another one like it) is a cut-and-dried solution to anyone needing a mapping "solution". But it's not an answer that is either complete or explanatory of how mapping solutions are valued.

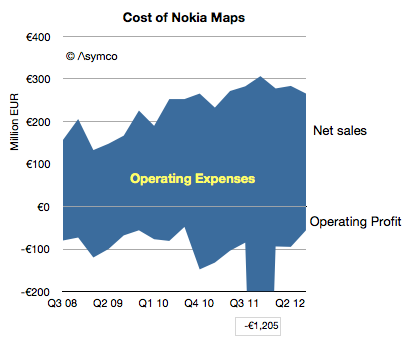
    Navteq was not priced as a database for an app. It was a business which was expected to create licensing revenues and profits[1]. The actual price for this business net of cash was $7.7 billion but the following graph shows the net sales and operating profits since Nokia began reporting its performance:

    Screen Shot 2012-12-18 at 12-18-3.13.12 PM

    The blue area represents the difference between sales and costs and hence the operating expenses--the payments needed to "keep the lights on".

    These total expenses over the 4.25 year time frame totals €6.5 billion. The total operating losses equal €2.6 billion. Therefore, as far as Nokia's shareholders are concerned, they paid $11 billion for Nokia maps, to date.

    What do they have to show for it?

    Nothing. The entire company is now worth only about $15 billion. It's hard to imagine maps being worth 73% of Nokia. What Nokia hoped to get for the product was some value in its devices. As other issues intruded, that value has not been realized. Nor has any external licensing revenue been realized. Net external licensing revenues are actually decreasing.

    The situation looks even even uglier when the maps asset can be seen as costing €1.5 billion every year. Why would anyone want to be in this business?

    I bring this up because, apparently, everyone wants to be in this business.

    Via Twitter I received a suggestion (rumor?) that Google spends about $1 billion every year for maintaining their maps. (Using a conversion from Euros to Dollars yields a Nokia maps burn rate of nearly $2 billion/yr.) Furthermore, there seems to be a burning desire for Apple to also burn this money.

    If so, then Apple might have to start spending $1 to $2 billion/yr to merely maintain a data set. That would be a minimum of an additional 7% in operating expenses.

    Why would they do that?

    If Apple cannot buy or license quality data, there may be no choice. Maps have become a hygiene factor for a platform. Not having them makes a platform repulsive but having them offers no attraction.

    Another way of looking at the maps asset is like a component in a phone. A vendor needs a certain class of processor, memory or screen or battery. Not having a minimum level of functionality makes the product uncompetitive but having it does not guarantee success.

    What's worse, the market may have been cornered—there may be no suppliers. Unlike hardware components, the maps component is not a commodity with a market of suppliers. The work needed to maintain the maps is a commodity but the aggregation and consolidation of the data is valuable and those who have gained control over the data and they are not likely to license it to any competitors for strategic (i.e. political) reasons.

    So we have a perverse situation of a very costly, unprofitable asset requiring duplication of maintenance effort by politically motivated actors imprisoned by their own strategic interests.

    If so then it fits perfectly with the mobile telecom industry. Like mobile networks, maps are very expensive and worth very little.

    ---

    Notes:

    1. The revenues that Navteq was obtaining during the 2008/2009 time frame included that from customers such as Verizon, Garmin, Advertising, Traffic services, Microsoft Windows Live services. For the six months ended on December 31, 2008, Europe accounted for 44% of NAVTEQ’s net sales, North America 43%, Middle East & Africa 8 %, Asia-Pacific 2 %, Latin America 2% and Greater China 1%.

    —

    If you want to learn more about how to analyze technology industries and the evolution of value chains, consider participating in Asymconf.

  11. The Android engagement paradox

    Research · 180 comments

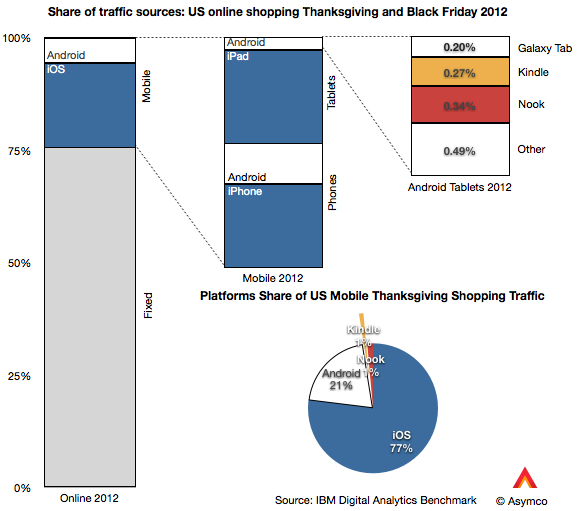
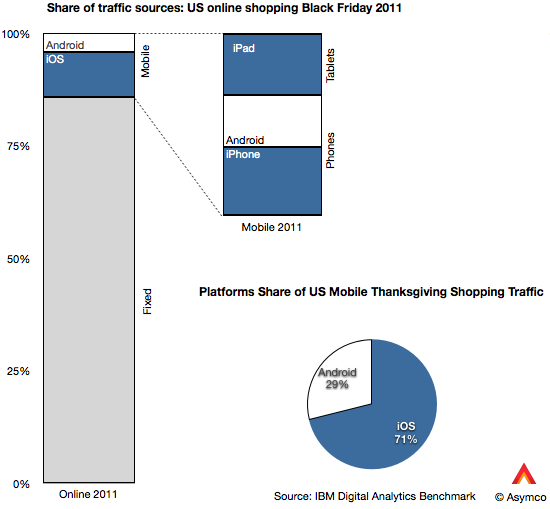
    IBM's Digital Analytics Benchmark reported US Black Friday sales and the news is reasonably good. Overall online sales grew by 17.4% while mobile grew to make up 24% of traffic.

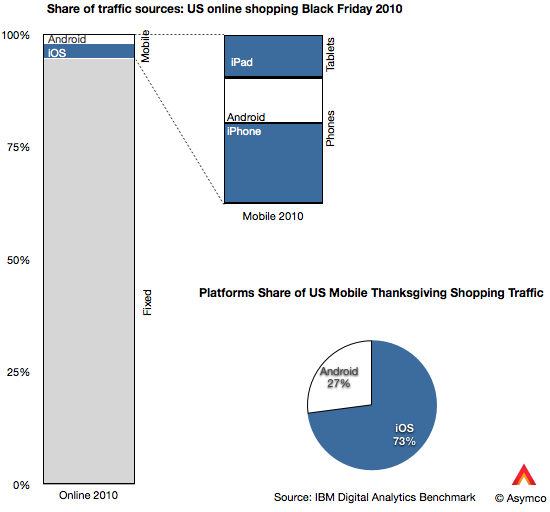
    The data goes further to show the split between device types. I illustrate this split with the following graphs:

    Of the 24% of traffic made up by mobile devices, phones contributed 13% and tablets 11% (or 54% and 46% of mobile respectively). Of the phone traffic, iOS devices were about two thirds of traffic and Android one third. Of tablet traffic, iPad was 88%, Kindle and Nook were 5.5% Galaxy Tab was 1.8% and other tablets were 4.4%.

    Overall, iOS was 77% generated mobile traffic and Android (excl. Kindle, Nook) was 23%.

    That's an interesting snapshot of the consumption of mobile devices, but is there a pattern here? I also took a look at the same data from 2011 and 2010.

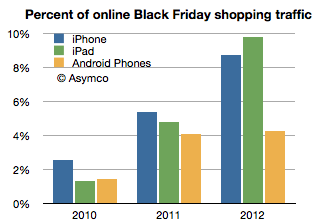
    Besides the pattern of significant mobile growth (from 5.2% to 24% of online in two years) there is the curious effect of iOS growth outpacing Android growth. Android went from 1.43% of Black Friday shopping traffic in 2010 to 4.92% in 2012. In same time iOS went from 3.85% to 18.46%. In other words, while Android is up by a factor of 3.4, iOS is up by a factor of 4.8.

    The reason is evident in the graphs above: the iPad is now the predominant mobile shopping device. You can observe the pattern in the following graph:

    Two years ago the iPad was trailing Android usage but this year it was more than twice Android usage. Curiously, the iPhone seems to also be pulling ahead of Android.

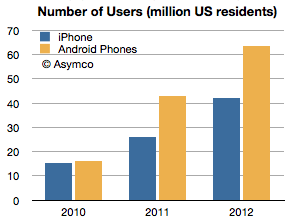
    Curiously because the number of Android users in the US has gone the other way. That data is available from ComScore, though only for phones. (ComScore data for periods ending November each year, Nov 2012 is my estimate):

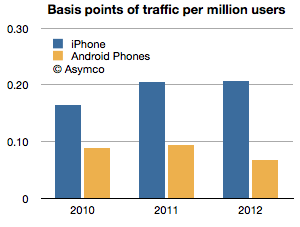
    Having the number of users and the traffic allows us to measure consumption per capita, so to speak. That is, the percent of traffic per device user:

    The ratio shown is basis points of usage (1/100 of 1% of shopping traffic) per million users of smartphones. iPhone users are about three times more engaged in shopping with their devices than Android users. Two years ago the ratio was two to one.

    Overall iPad is changing shopping habits, but it has a near monopoly in its form factor at this point. The bigger question is what is causing phone users to behave differently based on the devices they own. The phone market is more mature and has had several years of competition to be able to discern differences in platforms. The pattern is pretty clear with respect to Android: engagement is down as ownership is up. This pattern has not exhibited itself with iPhone, even though it has had a longer time in market.

    Of course, one would expect that later adopters would engage less, but I find it surprising that US Android users would behave so differently only two years after the platform began to be widely adopted. That pattern is not happening with iOS even after five years and certainly not with the iPad which is about as old as most Android brands.

    This I consider to be a paradox: Why is Android attracting late adopters (or at least late adopter behavior) when the market is still emergent? We've become accustomed to thinking that platforms that look similar are used in a similar fashion. But this is clearly not the case. The shopping data is only one proxy but there are others: developers and publishers have been reporting distinct differences in consumption on iOS vs. Android and, although anecdotal, the examples continue to pile up.

    And engagement is not a frivolous platform attribute. It is highly causal to success because it correlates with all cash flows associated with ecosystem value creation. Especially when a platform like Android depends more on engagement than "monetizing hardware."

    I'm not satisfied with the explanation that Android users are demographically different because the Android user pool is now so vast and because the most popular devices are not exactly cheap. There is something else at play. It might be explained by design considerations or by user experience flaws or integration but something is different.

    ---

    If you'd like to learn more about the Asymco method, come to Asymconf. The next Asymconf will be at the end of January near San Jose. Not only will you learn about how mobile is disrupting computing, you will also get to hobnob with the likes of Om Malik, Jean-Louis Gassée and Michael Lopp.