Asymco

Asymmetric Intelligence

recession

  1. Visualizing the winners and losers of three years of smartphone share growth

    Research · 2 comments

    Many consider June 2007 to have been a pivotal moment in the history of mobile phones. Apple's entry with the iPhone has re-defined the market in many ways. However, there was a smartphone market before then. About 28 million smartphones shipped the quarter when Apple launched out of an overall phone market of 265 million. Apple's entry with 270k phones was a drop in the bucket.

    I thought it would be instructive to chart what happened between that quarter, exactly three years ago and today. I collected the data from IDC, Gartner and Canalys and company reports to paint a few pictures.

    First, the market shares (by units) of the top mobile vendors, Q207 vs. Q210. I highlighted the smartphone vendors by separating their wedges from the pie. Note that I also separated Nokia's smartphones from Nokia's regular phones as two separated wedges--Nokia ex-SP for no smartphones and Nokia SP as their "converged" units. I did the same with "other".
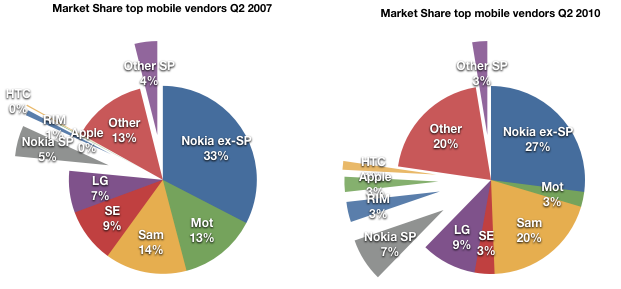
    The first thing to note (beside the large increase in smartphone share) is that "other" non-smartphones are a huge part of the pie. At 20%, the share of "other" is now equal to the share of Samsung. Other consists of a group of mostly low cost Chinese vendors. The growth of the low end "other" went from 35 million units in Q207 to 65 million in the last quarter. It's this competition that is driving profit out of the core businesses of Nokia, Samsung and LG and forcing a flight to smartphones (more about this later).

    The second thing to notice is that Motorola and Sony-Ericsson are highly visible victims of the last three years. Sony Ericsson shipped 25 million devices in Q207 and only 11 million three years later going from 9% share to 3%, on par with RIM and Apple. Motorola did even worse, shipping 35.5 million in Q207 and a mere 8.3 million last quarter, losing 10 out its 13 points of share.

    Viewing the overall units market, one can see the gouge in units that the recession took out. The following graph shows three years of volumes by the top vendors with the smartphones separated at the top (Nokia SP, RIM, Apple, HTC and Other SP--everything above the grey band are smartphones).
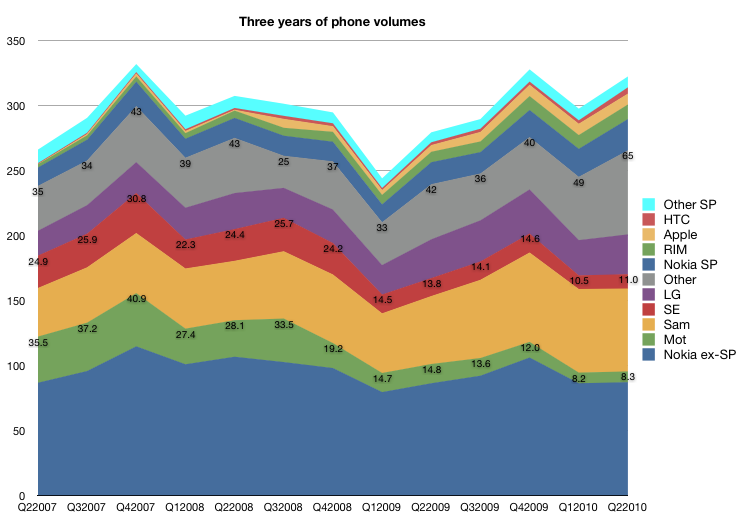
    However, separating out the smartphones, one can see their volume increased with barely a ripple during the recession. Although Nokia retains the top share spot, the entrants have jointly grown much faster.  I have annotated a few of the competitors' volumes with the actual values.
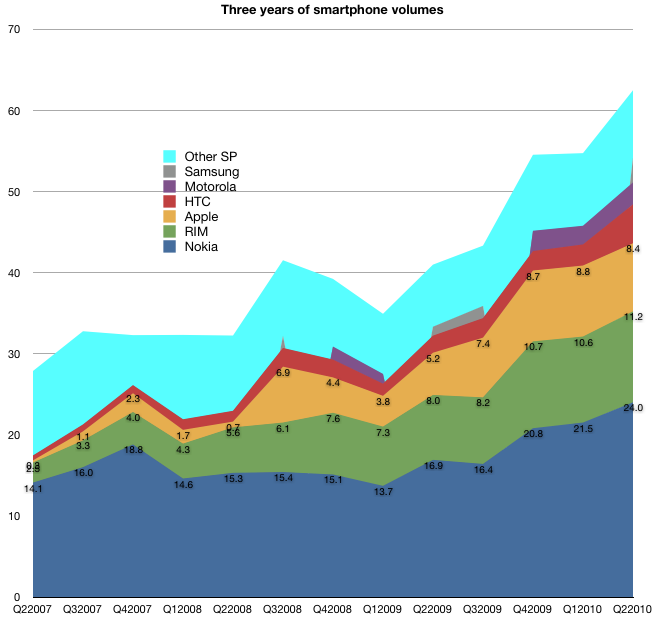
    One thing to note is that "other smartphones" has traditionally consisted of Windows Mobile licensees but that is quickly shifting now to Android. I also had only fragments of data for Samsung and Motorola, so their bands are incomplete.  However, one could note how minimal their participation has been in the market.  LG has been practically absent from this market.  For these latecomers to smartphones, it's clear what Android offers: a chance to stay in the game.
  2. Apple considered less valuable than the average S&P 500 company [Updated]

    Research · 4 comments

    Apple just reached a new all-time closing high.  It's remarkable that so soon after a recession the stock is enjoying new highs.  The Dow would have to gain 40% to make the same claim.

    So some may ask whether Apple's stock is getting ahead of itself.  Perhaps it's showing signs of "irrational exuberance".

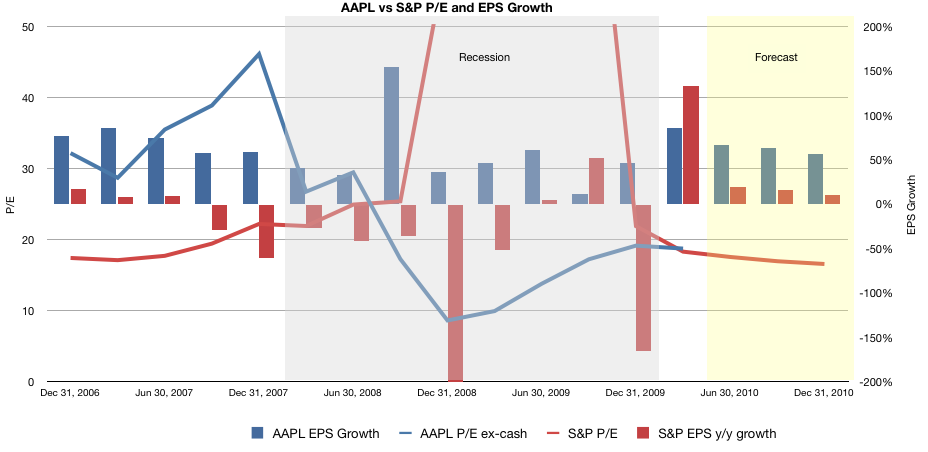
    This is not the case.  In fact, the stock is showing signs of irrational despondency.  This is demonstrated with the following graph.

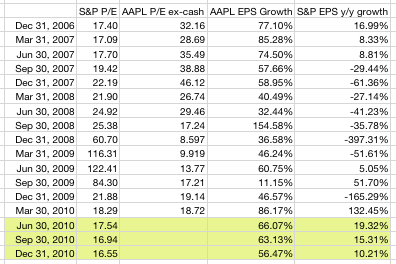
    It shows AAPL Price (ex-cash) over Earnings vs. S&P P/E  (blue and red lines respectively on the left scale) overlaid with AAPL and S&P EPS growth (blue and red bars respectively on the right scale). I added grey shading to represent the recession period and yellow shading for the forecast period.

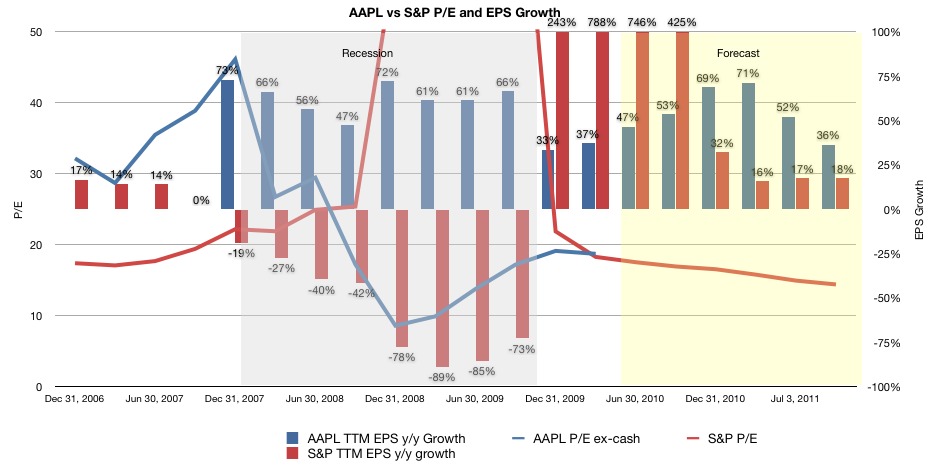
    [Updated] The same data is shown in the following graph where I used a 12 month rolling window (trailing twelve months) for the year-on-year growth to smooth out quarterly anomalies as per suggestion from Deagol in comments.

    Note how S&P earnings were indeed in a state of severe decline during the recession, and how the P/E gyrated wildly as a result. (I've had to clip the actual values in the graph for clarity but I include all the data in the table at the bottom of this article).  Post-recession S&P P/E began to return to normal at the beginning of this year and is forecast (by S&P) to align once again with the pre-recession growth in earnings.

    Now compare with what happened to Apple's stock.  Pre-recession the stock enjoyed a significant premium for growth.  The blue bars are significantly higher than the red bars in the 2006/2007 period and the blue line is naturally higher than the red line in the same period.

    During the recession, Apple continues to grow but the P/E drops to remarkably low levels (10).  Although Apple's earnings growth does diminish, it never goes away.  The anomalous growth in the third quarter of 09 is 11% due to the huge spike the year earlier with the launch of iPhone 3G.  Overall, the company continues growing at a good clip.

    Not so for its P/E however.  Even after the recession ended and AAPL accelerated growth to above 50% again, the P/E remained around 20.  I left out the forecast from the AAPL line so that readers can imagine their own.

    The bottom line is that at the new all-time high, Apple's shares are trading at a discount to their growth.  Not only lower than than Apple has enjoyed historically, but lower than the average of 500 of the largest companies in the US.  Those companies having earnings growth in the teens have recovered their valuation.  Apple with growth returning to above 50% hasn't.

  3. The iPhone at three

    Research · 4 comments

    The end of June will mark the third anniversary of the market release of the iPhone. When it arrived in June 2007, anticipation for the product was significant with high consumer awareness and expectations--though the 10 million/yr. target for 2008 was met with skepticism by many.

    The iPhone launched on June 29th 2007, with only a few days remaining in the quarter. 270k units were sold in that quarter and that was considered a solid start. When the company reported earnings a few weeks later (July 18th 2007) the company's stock price jumped to $140 a share.

    As a sign of optimism in the company's prospects, the P/E ratio showed that the company was expected to reach 35% growth (35 P/E).

    Was this optimism warranted?

    A huge world-wide recession started only six months after the iPhone launched and, by some accounts, it is still lingering today. That meant the company faced decreasing consumer spending and constrained markets world-wide. The recession was expected to challenge Apple's premium positioning across all its product lines. The optimism from 2007 seemed exuberant. Where do we stand today?

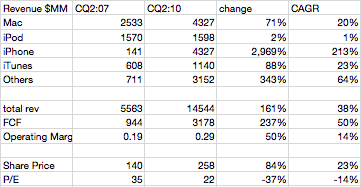
    This table shows the actual values of the iPhone's 2007 launch quarter vs. the estimated values for Apple's income statement exactly three years later.

    Free cash flow grew 237% or at a compounded 50%, significantly above the 35% that the P/E of 2007 would have suggested. The exuberance of 2007 turned out to be pessimism.

    Although we don't know what the share price will be come July, as of today the share price has grown at less than half the rate of FCF growth: 84% or 23% compounded. As a result the P/E dropped from 35 to 22.

    It's remarkable that growth expectations today are lower than they were at iPhone's birth even though the company outperformed those expectations through an unforeseen economic crisis.

  4. Shocker: Netbook sales slow down

    Research · 6 comments

    The results all but confirmed a sudden slowdown in netbook sales in the early part of the year and suggested the business may actually be on the decline. Intel didn't directly explain the shift, but an ongoing recovery from the recession and a more mature market are likely to give more buying power and greater interest in faster notebooks, especially following the addition of mobile Core i3, i5 and i7 chips.

    The trend away from netbooks is likely to continue as Intel raised its profit margin estimates for the whole year from a range of 58 to 64 percent earlier to between 62 and 66 cents.

    Source: Electronista

    A tip of the hat to John Gruber for compiling this list:

    Daring Fireball: Apple Netbook Claim Chowder.

    14 October 2008, Doug Aamoth at CrunchGear: “Five Reasons Why an Apple Netbook Is a No-Brainer”:

    When asked today about the possibility of an Apple netbook, Steve Jobs said something to the effect of, “The market is just getting started — we’ll see how it goes.”

    Huh? Here’s how the netbook market’s going, Steve: pretty much every major computer company has a netbook but you. Apple’s a prime candidate for a netbook, too.

    20 January 2009, Brian Caulfield at Forbes: “Apple’s Real Problem: Netbooks:"

    The real problem is how Apple’s portfolio of expensive gear — particularly notebooks — will fare as the recession starts to bite.

    21 January 2009, Brian X. Chen at Wired Gadget Lab: “Apple Still Oblivious to Netbook Opportunity”.

    18 March 2009, Shane O’Neill at PC World: “Recession Breathes Life Into Windows PCs as Apple Gasps for Air”:

    At this point, I’m going to stop asking when Apple will acknowledge these dark days we live in because I think the answer is never. Maybe Apple should just be a bull market company. When times are lean, it should pack up like a traveling carnival or disappear like a baseball team in winter and not come back until everybody’s rich and happy again.

    24 March 2009, Scott Moritz at TheStreet.com: “Apple’s Netbook Foray Will Flop”

    Nonetheless, design hubris and slumping sales will cause Apple to tap a hot segment of computer market.

    19 August 2009, Charles Moore at The Apple Blog: “Lack of Netbook, Price Hurting Apple in This Year’s Back-to-School Market”.