“Clearly this stuff isn’t selling,” said Monga [an analyst at Veritas Investments Research in Toronto.]...
RIM took a $485 million pretax charge to write down the value of its PlayBook inventory in December, after shipping just 150,000 of the tablet computers in the quarter. Then in March, the company recorded a $267 million expense for BlackBerry inventory. RIM said at the time that it would stop giving sales and profit guidance because of “ongoing weakness” in the U.S.
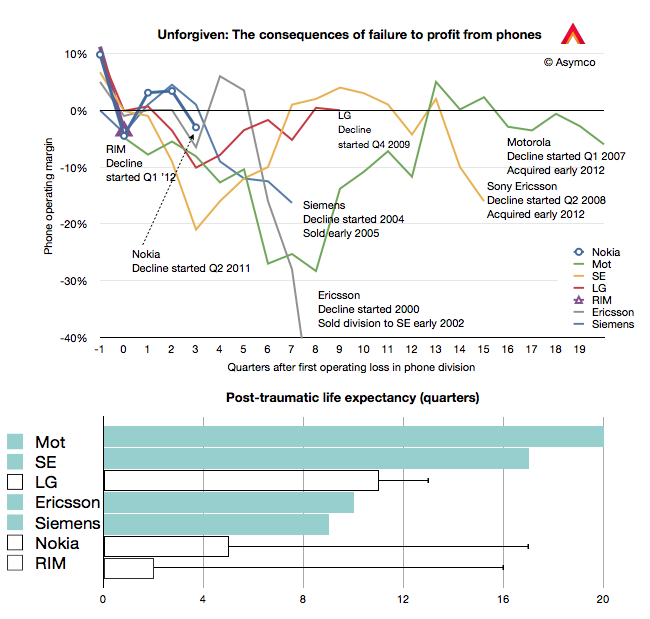
RIM has just entered what I call the Post-traumatic period of a phone maker's life. This period is defined as beginning with a loss-making quarter and ending with the company's exit from the business. These post-traumatic periods were visualized first here and the pattern was first discussed about a year ago here.
I've updated the chart with the current data and added the bar chart below to illustrated the "post-traumatic life expectancy" for the companies shown. Companies still operating are shown with bars without color while companies that have exited are shown with solid color bars.
The pattern may be that companies either have short post-trauma lives of about two to three years or relatively long post-trauma lives lasting 4 to 5 years. What determines this life expectancy and how long do RIM, Nokia and LG have?
There is precious little data, but perhaps one hypothesis I could offer could be that the bigger the commitment to the industry (in terms of having no fall-back options) the longer the post-traumatic period lasts. In other words, as there is no easy way out, the fight lasts longer.
This can also be interpreted using Porter's "barriers to exit" force analysis where companies which can liquidate a division see it as a low cost of exit whereas companies that need to restructure (usually more than once) and then seek either a buyout or rescue may interpret exit as a very costly endeavor.
Long exits compile larger costs of distress and can cause more pain for stakeholders, especially if the end is inevitable.
Given this hypothesis, as both Nokia and RIM depend largely on mobile phone sales, it's likely that they will not exit quickly. (Ironically perhaps, LG has a better shot at a quick exit given its diversified conglomerate status.) It might imply that there are at least two more years before Nokia and RIM call it quits.
During the first quarter this year HTC, RIM and Nokia all surprised investors with bad news. The effect is evident in the share price of these companies which, in the case of RIM and Nokia is around book value, and in the case of HTC, neared 12 month lows and a 70% drop from peak.
These "misses" in earnings and expectations are on top of the already woeful news from Sony Ericsson and Motorola, which have not had profits for years and LG, which has been borderline since late 2009.
In combination, this seems to imply a dearth of profits in an industry that is, by all measures, booming. Units are up 7% with smartphones up 47%. Revenues are up 20% and overall profits are up 52%. This are exceptionally strong numbers. Few industries can measure growth in double digits.
So if the industry is booming but the majority of participants in the industry are loss making (and surprisingly so) then what is going on? There are two answers: new market disruption and low end disruption.
The new market disruption is the migration of a large number of demanding customers away from phones-as-voice-products to phones-as-computing-products. The low-end disruption is the migration of a large number of less demanding customers from branded phones to unbranded, commodity phones.
The New Market Disruption
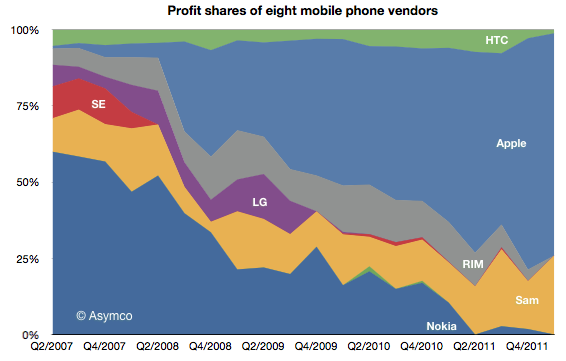
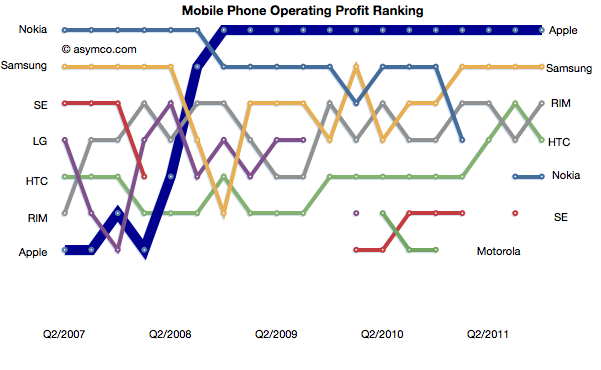
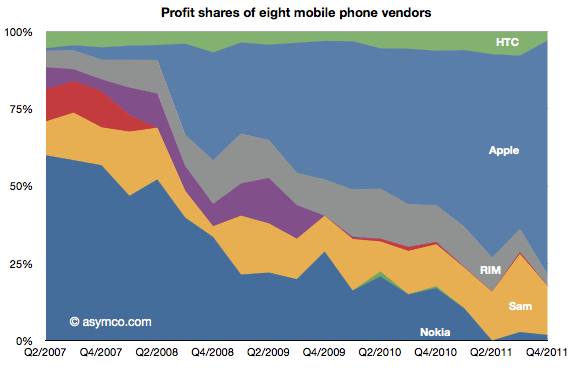
The new market disruption is evidenced by the shift of fortunes to Apple and Samsung and away from every other device maker. Here is the profit picture:
Of the vendors tracked (public companies who report mobile phone divisional performance), Apple obtained 73% of operating profits, Samsung 26% and HTC 1% [1][2].
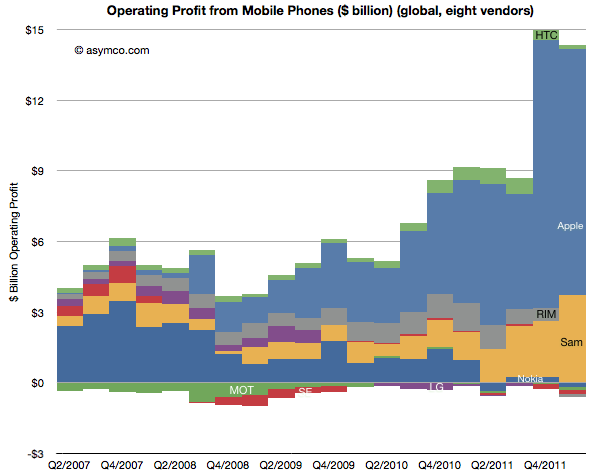
The "share of profit" picture is potentially misleading because it could imply that the profits available are a constant. They're not. The absolute profits picture below shows how the industry actually expanded available profits by quite a lot. Two years ago the vendors generated profits of $5.3 billion in the first quarter and last quarter they generated $14.4 billion.
Seen this way, the story isn't so much that Apple "took the profits from the incumbents". Rather, it's that Apple created a vast new pool of profits. And one need not look far to find out where they came from: operators. These profits were mostly carrier premiums for the iPhone 4S.
Before shedding tears for operators, consider that although this does amount to a current transfer of profits from carriers, the decision is a popular one. Hundreds of operators have made it. It's unlikely that they all colluded to be robbed. Indeed, they willingly hand over these premiums because the iPhone ensures a competitive advantage or preserves their customer base from churning. The calculations that go into a decision to range the iPhone are compelling enough that 250 operators made the decision (though, crucially, there are still 250 who have not).
Following this value proposition to its logical conclusion would suggest that the industry is rewarding those who can supply computers-as-phones which preserve the cash flows of what is essentially a trillion dollar data services business. Vendors which cannot offer this solution saw their businesses implode. At least on the high end.
The low end disruption
Simultaneous with this shift of the high end to smartphones-as-app-and-service-platforms came an explosion of growth in unbranded phones. As Apple led and most brands followed the new market, the old market of voice-oriented phones was abandoned to new entrants offering cheap "good enough" phones. Nokia tried to preserve its volumes and margins there but it's becoming increasingly difficult.
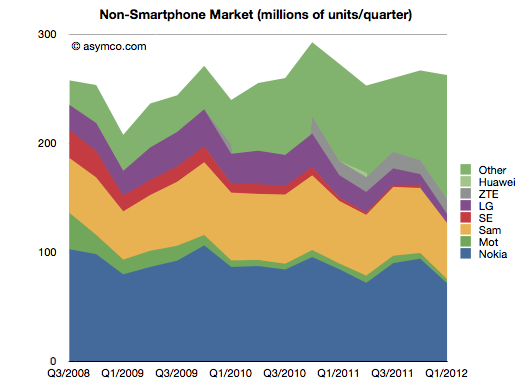
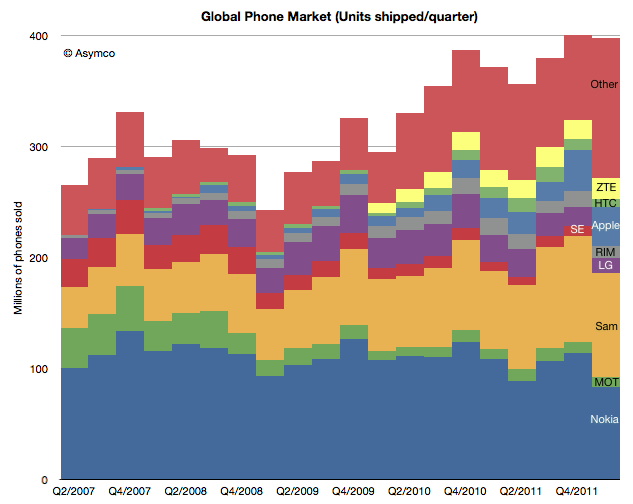
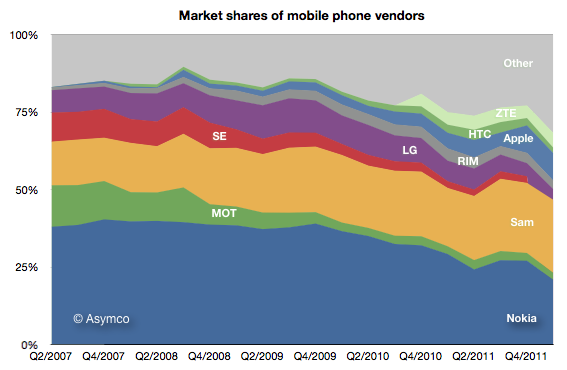
The following chart shows how the "Other" vendors have come to make up about 44% of the market.
Note that although this "feature phone" segment is not growing, it is still a large market (250 million units a quarter). The entrants in this market are numerous (perhaps in the thousands) and they are offering white label and unlicensed knock-off products. They are also offering unregulated (i.e. without IMEI numbers) products which are technically illegal and sold mainly in underdeveloped countries which have no incentives to enforce regulations.
This is a consequence of feature phones reaching the point of being "good enough". The feature set and quality are adequate for voice, text, games and even media playback and are priced at $30 or less.
This commoditization of the low end is pressuring what would normally be the fallback cushion under an underperforming smartphone business. The crisis for the incumbents comes from not only being unable to shift to the new market as fast as needed but also from not having cash flows from a low end that was thought to be sustaining.
This combination of two disruptions is why we see an explosively large and growing market failing to reward all but two of the participants.[3]
---
Notes:
You can download, view and interact with a motion chart for the industry data here. All data is sourced from company filings except for some estimates where data is missing.
Operating profits are sales minus cost of sales minus operational expenses attributed to the business. When not available, opex is estimated as a percent of total in proportion to sales. Note that operational income excludes taxes, depreciation and other capitalized costs.
We cannot say that the thousands of low end entrants are unprofitable. They are probably enough profits to sustain them and even to attract more entrants, but we have to also recognize that there are likely to be very low margins.
Sony Ericsson is no more. The company remains but the brand is gone. Now the phones it makes will be sold under the Sony name. Unfortunately, that means we no longer get reports from the company on its volumes, profitability and sales. The units will be part of "Other" from now on.
That vendor's data disappears as did HTC's and Samsung's earlier reporting. Bit by bit, vendors are withdrawing information. RIM stopped reporting its average selling prices some time ago, Motorola may disappear completely and they already stopped reporting tablet sales.
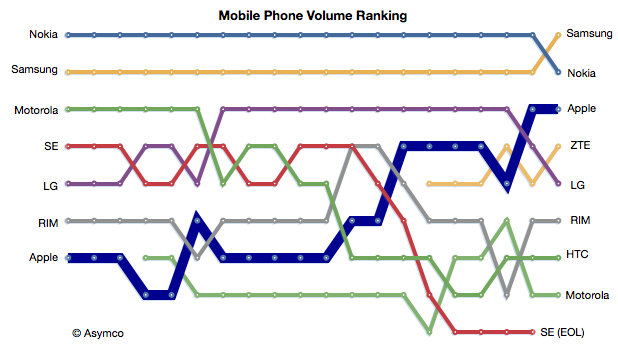
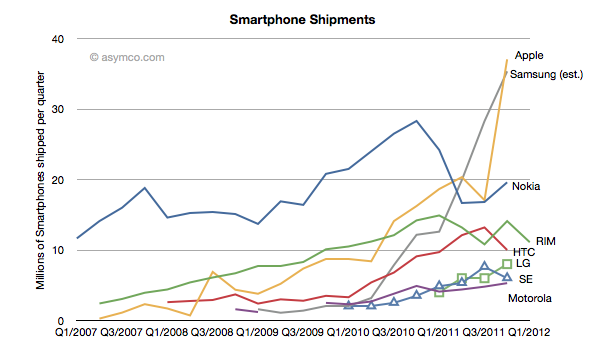
This makes the picture of the market fuzzier each quarter. We have to rely more and more on analysts who publish estimates. I try to pick from the available data the best assumptions but the errors are undoubtedly increasing. Here are the charts showing unit volumes in terms of absolute, share and ranking.
As I wrote previously, Samsung has overtaken Nokia which lost the top spot in unit shipment ranking, a spot it held for 14 years.
Of all the participants, only three brands enjoyed growth this last quarter: Apple, Samsung and ZTE. ZTE, like Apple, is noteworthy for its late entry. The others are in a mess: Motorola -4%, Nokia -24%, RIM -26%, HTC -29%, LG -44% in terms of unit growth y/y. This, while the market managed a modest gain.
It still find it fascinating that such a large market, selling 400 million units every quarter can exhibit such rapid change in participant ranking.
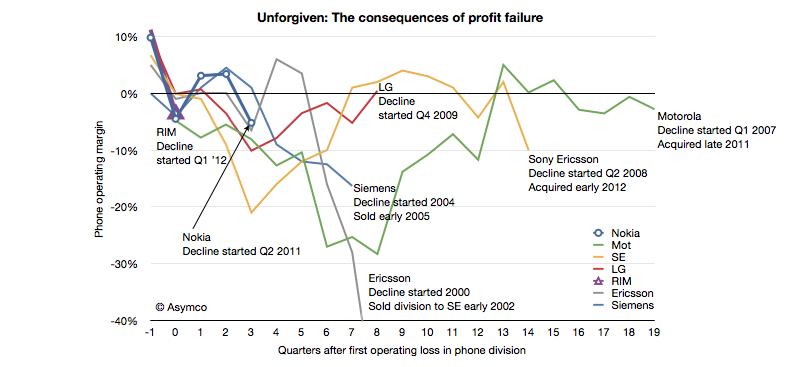
In June of last year I wrote a post titled "Does the phone market forgive failure?" It was written on the eve of Nokia's Q2 2011 report highlighting the historic consequences of a dip into negative operating margins for a phone vendor.
I listed 13 phone vendors who were either merged, liquidated or acquired. There are no examples of vendors who recovered from a position of loss making.
I was prompted to follow-up by a note Charter Equity Research analyst Edward Snyder wrote illustrating the effect of negative operating margins on phone vendors. I took his illustration and expanded it with additional data.
Since my post in June last year Sony Ericsson and Motorola were acquired making the victims list total 14 companies, with Nokia, LG and RIM having joined the "endangered species list". If the pattern repeats, then RIM and Nokia are in early phases of what promises to be an extended period of pain followed by an exit.
What the analysis does not answer is when a vendor loses its independence after beginning loss making. Motorola took 20 quarters; Sony Ericsson 14, Ericsson 8 and Siemens only 7. We cannot tell if or when LG, which is still operating after 8 and Nokia, which is now in its fourth and RIM, now in its second quarter post-loss, will lose independence.
The rumors swirling around RIM and LG are centered around exits and some suggest Nokia will follow. Many also argue that these companies will recover. The conditions they each face are different in details but broadly they are the same. Earlier last decade the exits were prompted by loss of brand value and subsequent loss of distribution. This decade disruption brought upon by mobile computing brings with it new business models centered on ecosystems and value captured through software and services.
Until and unless these endangered companies solve the dilemma of having the wrong business model at the wrong time, the chances are that they will not be forgiven for market failure.
Canaccord Genuity analyst Mike Walkley writes in a note to clients today. “In fact, we believe iPhones are outselling all other smartphones combined at Sprint and AT&T and selling at roughly equal volume to all Android smartphones at Verizon.”
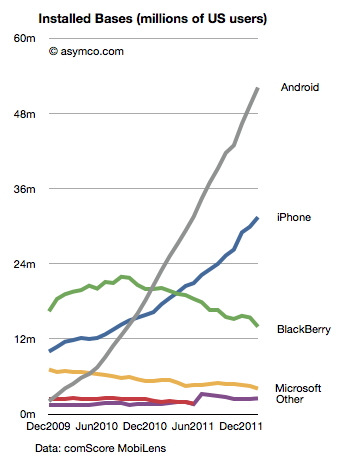
That's useful data. Mainly because we can use it in combination with comScore data that tracks a different market measure. comScore's MobiLens service tracks US mobile installed base. By measuring the difference between their stats one month to the next, one can measure the gain in a particular platform.
Comparing that gain with the sell-through rate in the same period can yield a figure for the number of units sold as upgrades vs. those sold to new users.
The latest comScore data (period ending February) shows that Android added 2.87 million users to its base while iPhone added 1.52 million. If we assume that Android sold a minimal number of replacements (due to the limited time in use of bulk of units) and round up to 3 million for February, and if we assume that Apple sells as many iPhones as Android (which is what Walkley suggests) then we can conclude that in the US roughly half the iPhones are bought as replacements for existing iPhones.
Extrapolating this to global markets may be risky but already we can begin to form a picture of how the iPhone franchise is becoming an annuity-based business.
Apple likes to point out that "half of Mac buyers are first time buyers." In the case of the iPhone perhaps they could also say "half of iPhone buyers are repeat customers." At this stage in the platform, that's a powerful statement. If the repeat customer rate is high then it suggests strong loyalty but it also may suggest poor competitive position vs. non-consumption or alternate platforms. If the repeat customer rate is very low it may suggest competition vs. non-consumption but it may also suggest low loyalty. It all depends on the overall growth in the market and size of installed base.
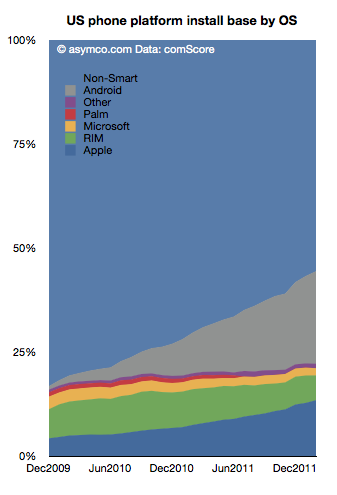
The following chart shows the overall market growth and the position of the various platforms within that growth.
Note the time scale is slightly more than two years. This suggests that the vast bulk of Android units in use (grey area) consists of first use units. New purchases are going to first time buyers. In contrast, the shrinking RIM total implies extremely low sales as the age of the base is far older than the time scale. iPhone base is both growing and being upgraded.
As we reach 50% penetration of smartphones, platform churn will become a significant component of market performance. The loyalty and "stickiness" of Android will begin to be tested. Current surveys show reasonably good satisfaction ratings for Android phones (around 60%) while iPhone's are even higher. But let's keep in mind that RIM's satisfaction and the loyalty of their customers was exceptionally high a few years ago. The rate of evaporation of goodwill toward the brand is breathtaking.
The longer term test of mobile platform performance will be in the recurring purchase rates. Loyalty must be earned and preserved. I.e. "You come for the product, you stay for the ecosystem."
So far, the iPhone seems to be getting a passing grade while Android has yet to face the test.
RIM’s CEO, Thorsten Heins was quoted as saying, “We plan to refocus on the enterprise business and capitalize on our leading position in this segment. We believe that BlackBerry cannot succeed if we tried to be everybody’s darling and all things to all people. Therefore, we plan to build on our strength.”
RIM's latest quarterly results show a continuation of the decline in sales that began in Q1 2011.
Here are the highlights:
Smartphone units declined 26% y/y and 21% sequentially. Over a four year period the company still shows a positive growth of 20% compounded, though that is far below industry average
The smartphone revenues were down 29% y/y and 23% sequentially.
Including service revenues, the revenue per smartphone dropped to $346, a drop of 4%.
I estimate the phone operating margin to be less than 5%. The company swung to a net negative operating margin due to write-downs of tablet inventory but the phone business managed to break even.
Operating income from phone operations dropped to the lowest level in five years.
The company is still generating cash flow and has a cash reserve of over $2 billion.
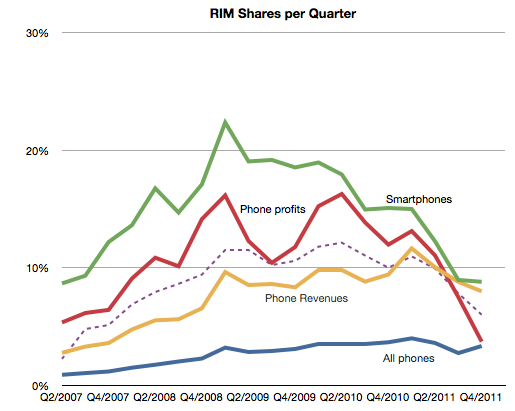
Seen in isolation, the company is clearly struggling but does not seem to be on its last legs. But no company should be seen in isolation. As part of a competitive market, the company is in far worse shape. The following chart shows the AMP index which measures relative performance through a blend of market shares.
This chart does not include the latest quarterly data but if it did it would be sure to show a continuing decline. The AMP index actually shows RIM peaking in Q1 2009, well before the volumes peaked.
It's within this context that we need to evaluate the new CEO's strategic shift. In the quote above we have the first significant strategic departure and split from the past. Should it inspire hope or despair?
The idea of focus has huge benefits. Focus and the art of saying no are keys to greatness. However, you only succeed if you focus on the right thing. "Enterprise" is not the right thing. It's not a valid target. Enterprise support is a feature, not a product. I don't mean that as opinion, but as a point of fact. Focus on a set of customers whose only characteristic is a job description is missing the whole point of focus.
Focus needs to be positioned on a job a brand needs to be hired to do. The idea should be to solve an open problem which is either too complex or too uneconomical for anyone else to solve. Corporate buyers have problems to solve but the BlackBerry no longer offers unique or defensible solutions. Furthermore, corporate buyers are themselves being dis-intermediated from the computing purchase decision. Sometimes this process is called "consumerization" but it is more plainly explained as "commoditization". The selection of tools for workers by a group that claims to understand their needs better than they do is an archaic concept.
This was true even in 2005 when RIM began targeting consumers. It was then that they saw the writing on the wall--that their enterprise business was being commoditized. All of RIM's growth since has been in consumer segments. By abandoning that trajectory RIM is effectively giving up on growth. And giving up on growth is simply giving up.
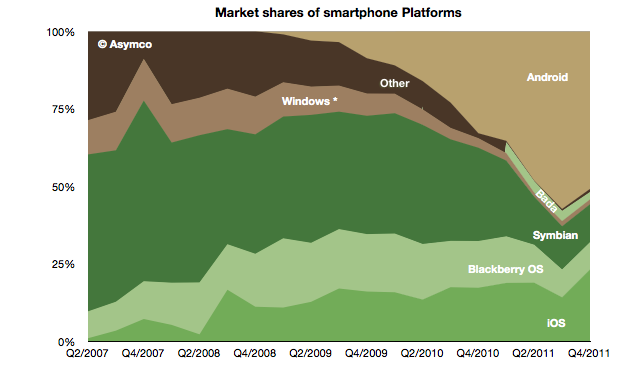
The global mobile OS market shares for Q4 shows a continuing (but diminished) leading share.
At the end of last year Android's unit share reached 51% which is down from about 57% during the third quarter. iOS reached 23%, followed by Symbian at 12%, RIM at 9%, Bada at 2.4%, Windows Phone at 1.6% and Other at 1%.
When seen on a year/year basis Android gained 18 points of share in Q4 while Symbian lost 18 points. iOS gained 6 points of share and RIM lost 6 points. Bada gained 2.5 points and Windows lost 1.5 points.
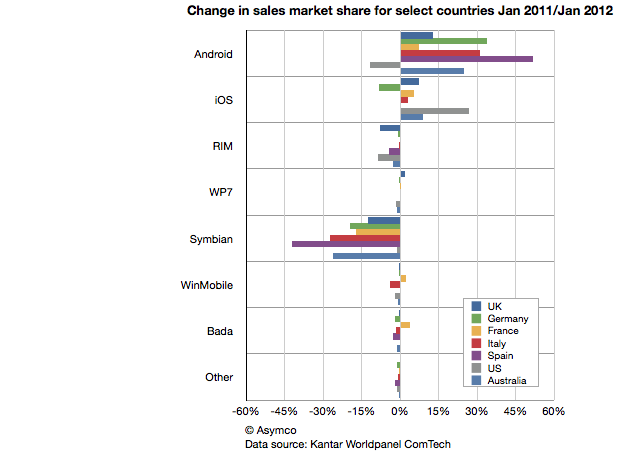
This symmetry can also be observed in another set of data. Published in The Guardian Kantar Worldpanel ComTech data shows the OS share changes for January on a year/year basis for a select set of countries.
Android share gains do seem to be mirrored by Symbian share losses on a country-level.
This should be most interesting to Nokia and Microsoft as both have a lot riding on Windows Phone replacing Symbian sales. If there should be a recovery in the fortunes of these companies, it would seem that their strategies should focus primarily on stemming and then reversing the losses to Android.
Microsoft's strategy of increasing the cost structure for Android through IP licensing is certainly part of this picture but it's a slow process to turn that disincentive for Android into a large incentive for Windows Phone.
Indeed, the speed with which Android handsets can be developed seems to be a key value of that operating system and one for which Microsoft does not have a good answer. Nokia is now one year into its commitment to the Microsoft platform and it has a very limited portfolio to show for it (and limited sales as well.) As a result, Nokia's Symbian business evaporated very rapidly. More rapidly than the company anticipated.
The dilemma for other vendors may well be how long will it take for them to develop a replacement for their Android portfolio in Windows Phone.
The opportunity cost of this switch is subtle and insidious but may be the root of why we don't see a stampede toward Microsoft. Conversely, Android contract-free, implement-at-will availability may be its greatest selling point.
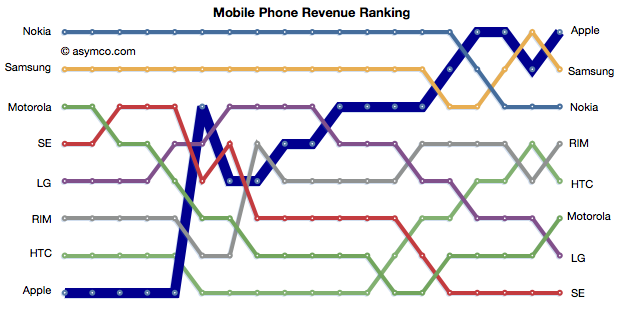
Apple retained its top rank in profitability and regained the top spot in mobile phone revenues.
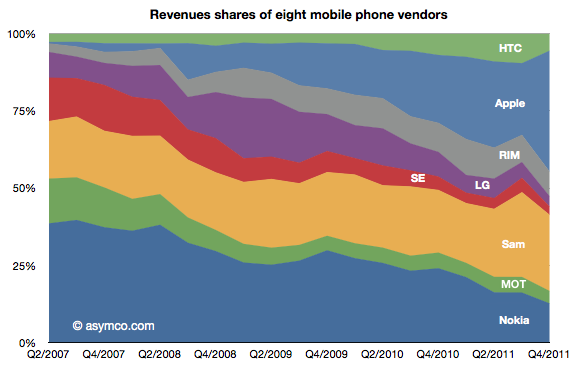
The relative shares of revenues and profits are shown below:
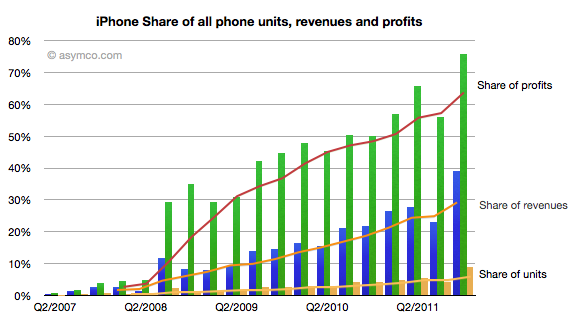
Individually, Apple's share of units, revenues and profits is chronicled below:
Apple reached 75% of profit share, nearly 40% of revenue share and 9% of units share.
Apple and Samsung combined for about 91% of profits with RIM third at 3.7%, HTC fourth at 3.0% and Nokia last at 1.8% of a $15 billion total for the quarter.
In terms of revenues, Apple had 39% to Samsung's 25%. Third was Nokia with 12.6% and fourth RIM at 8%. HTC only managed 5.5%, Motorola 4%, LG 3.3% and Sony Ericsson 2.7%.
Yesterday's post described the history of personal computing platforms over the past 37 years. It showed a distinct shifting of "eras" between traditional personal computing and the emergent mobile computing represented by device-based platforms.
Underlying these lives (and deaths) of platforms were the growth (and decline) of fortunes of companies and people. I hoped that by observing these patterns insight could be gained into the conditions for success or failure.
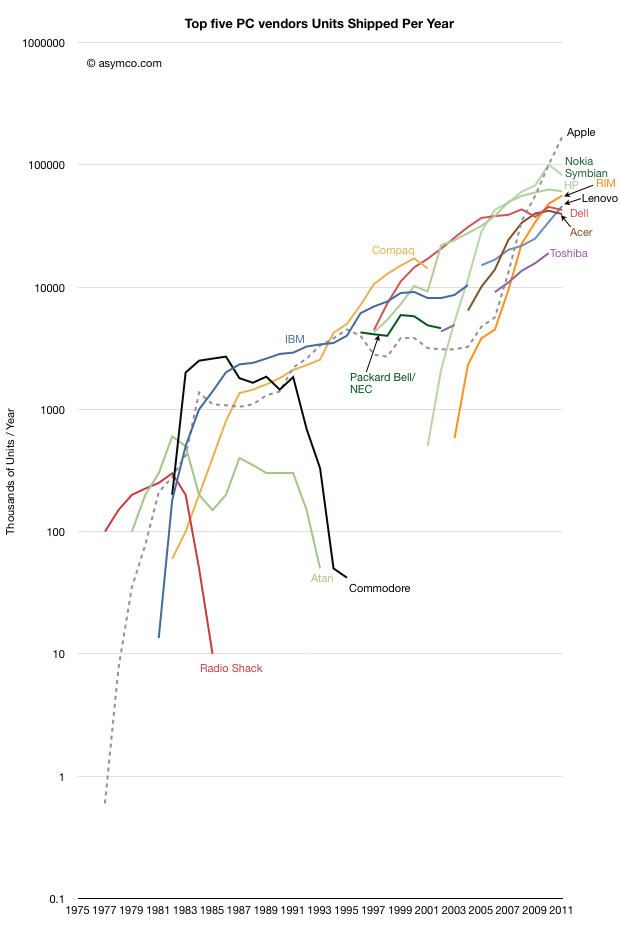
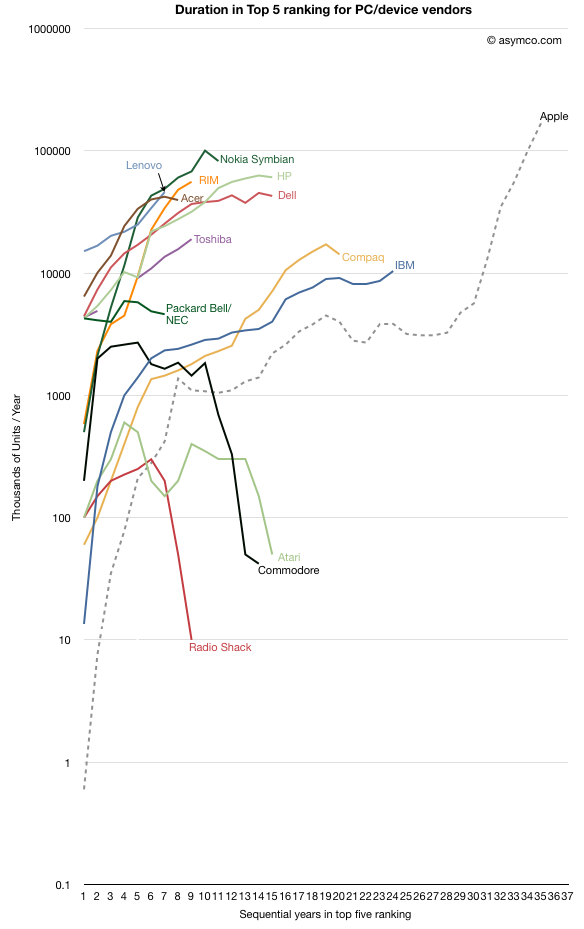
The following graph shows the companies which were predominant (in the top five ranking by shipments[1]) during each year of the industry's history and the volumes they were able to obtain during that period. I also added Nokia and RIM as examples of the challengers coming from mobile devices.
It's a difficult graph to interpret. The pattern I observed was that most companies were not able to sustain presence in the top five ranking for long. Indeed, regardless of having one's own platform or being a licensee, companies seemed to fade reliably. Some were acquired, some sold their operations but there is a distinct impermanence to their prosperity.
To sharpen this perspective of longevity I indexed each company to the point when they entered the "prosperity zone" and measured their staying power within it. The following graph shows these indexed lives.
Apart from Apple, IBM remained in the business the longest (24 years). Compaq was second with 20 years before being bought by HP. HP and Dell are still operating after 15 years, having tied Atari and Commodore. After these ancients, the upstarts Nokia and RIM are struggling to remain relevant after 10 to 12 years.
Then there are the transients like Packard-Bell/NEC, Toshiba, Radio Shack and Fujitsu which lasted less than 10 years. The newest PC companies are all from China or Taiwan: Acer, Asus and Lenovo. Their longevity cannot be called yet though Acer seems to be in decline. Lenovo, which took over IBM's brands continues to grow. However, as yesterday's post showed, without diversification into devices, pure PC makers are likely to fade.
But besides this interesting history lesson, there is a deeper, unsettling observation. The scale of these periods of prosperity is far shorter than the average person's career. Indeed, the entire time span of the study is 35 years, about the time an average person will be employed. All the companies failed to maintain prosperity over this time frame.
These are a small sample, flawed by showing only hardware units, but I consider it a proxy for the overall technology market. Software-only or services companies have had no better records.
The implications for company managers and workers is profound. Chances are that the business you work for will not prosper for more than a decade and will reward you for an even shorter period. Similarly, as witnessed by the P/E ratios, investors have given up on this industry as one with any quality of earnings.
There is no "rule" that this has to be so. The high mortality rate and short longevity of technology companies is a consequence of a failure to manage innovation and disruption. Apple may be an exception--one I think worth studying. Though not always prosperous, it has managed to survive, being the only company from the early era of personal computing to still be operating in the industry. Indeed, it's now the most prosperous. Maybe it's a fluke, but I rather think it's due to an ability to re-define itself as the market shifts. Its essential quality being an ability to disrupt itself.
And if we think about it this way, ultimately, longevity is more important than prosperity. Without patience there is nothing but chance determining prosperity. The fate of more than company finances rests in the balance.
Notes:
Apple did not maintain a position in the top 5 throughout this period but is shown as a benchmark as it remained in the same business throughout this period.
Data on Q4 performance is starting to trickle in. Last week Motorola, as part of a profit warning, revealed their Q4 smartphone shipments were 5.3 million. RIM had reported 14.1 million units (quarter ending November). HTC has also warned that their shipments of smartphones (and tablets) totaled 10 million. Samsung provided guidance on overall sales but since they don't report data on smartphone (or phone) sales, the estimates are ranging between 32 and 35 million.
Many have forecast Apple's performance but there are many other companies which are not easily estimated (Sony Ericsson, LG, Nokia, ZTE, Others.) But rather than dwelling on the specific quarter, we can make some long-range estimates of performance based on the historic data.
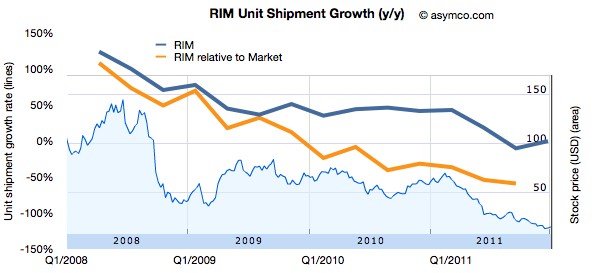
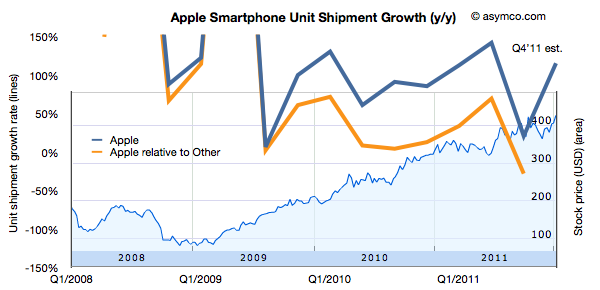
One method I use is to look at patterns of growth. Growth is the first derivative of market performance and it sometimes shows patterns which the performance itself does not. Consider the following chart showing the growth pattern for RIM.
The blue line shows the absolute year-on-year quarterly growth based on reported numbers of smartphones shipped. I've also shown the growth "relative to market" which is unit growth with market growth subtracted. This orange line represents how much faster (or slower) the company is growing relative to the market. If the orange line is above zero, the company gained share. If it's below zero, it lost share.
I also overlaid the performance of the share price (right scale).
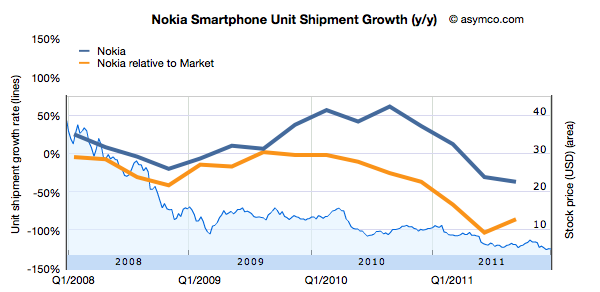
Now compare that with another long-term incumbent in the smartphone market, Nokia.
Bearing in mind that the scales are identical, Nokia's relative performance has been negative since early 2008. Persistent negative smartphone performance relative to market growth causes persistent loss in share price.
What about other, more recent competitors?
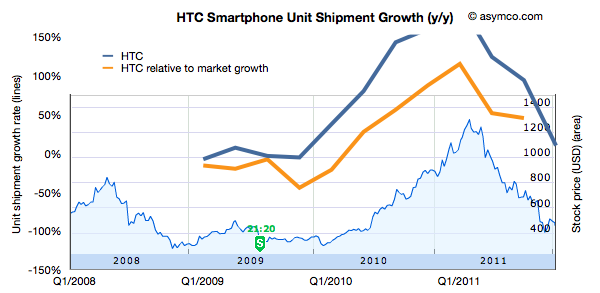
HTC is not a recent entrant in smartphones, and has gone through a phase of growth with Windows Mobile in the 2000's. This is its pattern of growth (and its share price).
Keeping the scale for growth consistent with the other companies leads to a bit of clipping but the pattern of rise and fall also seems correlated to share price performance.
Finally, the following is the same analysis applied Apple.
Again, keeping the growth scale consistent leads to some clipping, but the pattern remains observable.
What seems to be rewarded to various degrees is consistency in growth of smartphones for companies which are primarily engaged in the market. However, failure to grow is punished with severe share price declines.
Being able to forecast smartphone growth seems to be useful, at least in the time frame of one or two years.
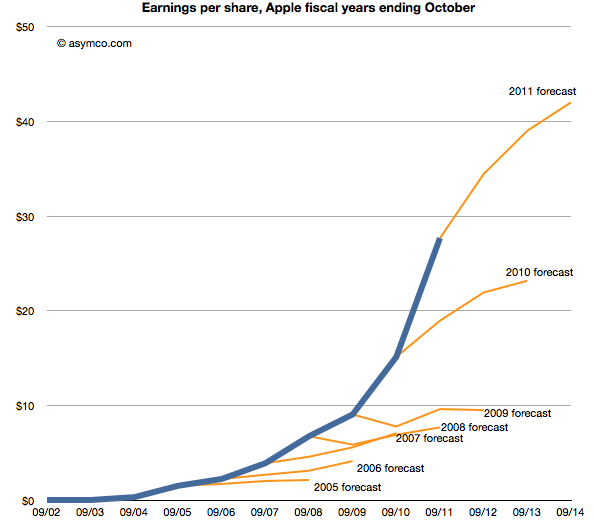
Last week Horace wrote about the apparent "reasonableness" of analyst Apple estimates. He explained how the consensus for Apple's growth was always deeply pessimistic because its performance could be argued to be anomalous. It was just too good to be true. We reproduce the chart here:
The estimates look like characteristic "tell-tales" of a company running strong into the wind.
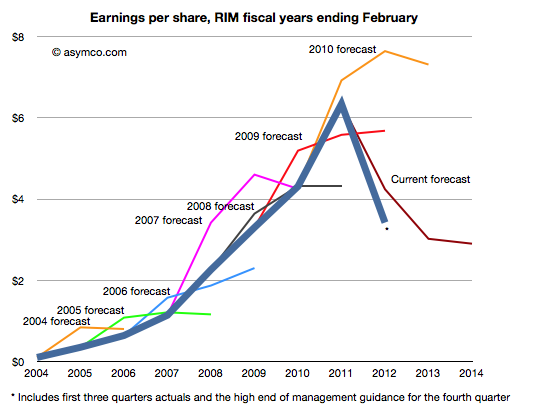
This conservatism in the face of rapid growth sounds "reasonable" but is it always practiced? And what about the ability of this conservative strategy to predict dramatic changes in growth? To test, we started to look at the predictions for RIM. RIM has also enjoyed strong growth over a similar time frame as Apple. How did analysts predict its performance? The following chart was prepared using the same technique as the one for Apple[1].
Surprisingly, the "tell-tales" look very different.[2] For every year we looked at the first year estimates were over-optimistic with a decline expected after one or two years. This pattern is remarkably consistent within the RIM data and remarkably inconsistent when compared to Apple.
It's as if there was nothing in common with the methods used. This is perhaps appropriate, but the "quality" of predictions are not much better. With RIM they were too optimistic in the short term and too pessimistic in the medium term. With Apple they were far too pessimistic consistently.
More worrisome, the 2010 forecast did not offer any hint of the dramatic decline which followed only a few months later. And after three quarters of really bad news, the consensus is still higher than what will likely happen (ensuring an uninterrupted string "misses").
The study of these two companies' forecasts is a study in contrasts. We can say that the forecasting is disturbingly consistently inaccurate but we can also say that there seems to have been a bias of pessimism for Apple and optimism for RIM. We can only guess at the cause, but the consistency of bias points to something institutional.
---
Notes:
The three year forecast consensus (sourced from Bloomberg) was sampled one month following the end of each fiscal year. This should offer the analyst enough time digest the year passed and deeply contemplate the future.
If we may stretch the analogy, these are indicative of an imminent stall.