Asymco

Asymmetric Intelligence

Samsung

  1. The end of the independent phone brand

    Research · 103 comments

    As shown in the yesterday's post, in the third quarter, overall mobile phone profitability declined. The eight vendors I use as a proxy showed a total net profit of $8.51 billion, down slightly from $8.57 billion and a drop of $9.01 billion in the first quarter.

    Overall, the industry dropped by 1% sequentially but is still up 30% over last year and has a 20% compounded growth rate over a three year period.

    • Nokia returned to profitability, though at $180 million it's only about 2% of the top eight.
    • Motorola remained in the red with a small loss of $20 million, an improvement over the $90 million loss of the previous quarter. Motorola is being acquired by Google after an accumulated mobile operating loss of $4.69 billion since the beginning of 2007. It's unlikely we'll receive any updates on performance thereafter.
    • Samsung had a great quarter with a sequential increase of 19% and year-on-year growth of 130%. The total profit amounted to 25% of the peer group.
    • Sony Ericsson broke even with about $50 million in operating profit. Like Motorola its performance was barely break-even during the last four years and its also disappearing from our list of independent vendors as it becomes part of Sony.
    • LG had its sixth consecutive quarterly loss and is now appealing to investors for more capital to continue operating as a smartphone vendor. Raising dilutive capital seems a radical approach and not one that inspires confidence.
    • RIM had a sequential reduction in profit of 35% and y/y reduction of 30%. The company is exhibiting clear signs of decay and the stock market is valuing the company below book value.
    • Apple profit dropped by 19% but grew 43% y/y during a transitional quarter. The growth remains 43% compounded over three years.
    • HTC has a 1% sequential increase but a 78% y/y growth.

    To illustrate the performance in terms of profit, pricing, volumes and margins, I developed the following chart. 
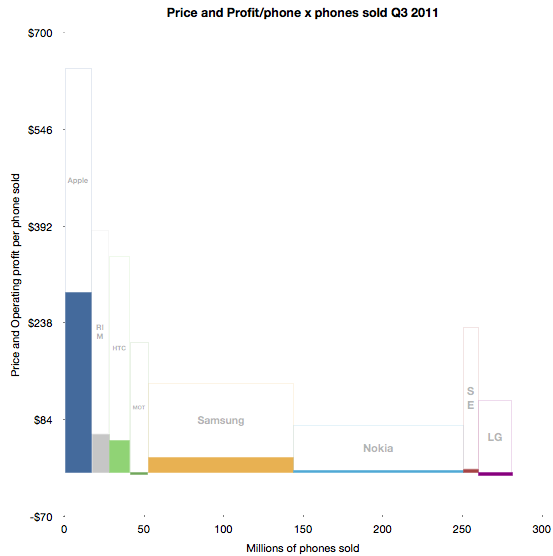
    The solid areas representing profit are operating profit/phone in the vertical axis and volumes shipped in the horizontal. The blank areas above are the cost of goods sold per phone and the combined solid and blank represent the average revenue per phone.

    Some of the areas are over-represented due to the lack of resolution available.

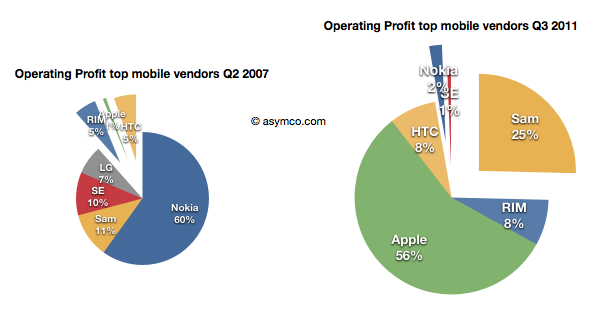
    Using before-and-after pie charts for positive profits, we can see how the entrants (RIM, Apple and HTC) went from 6% of profits to over 73% four and a half years later.
    I feel that this is somehow the end of an era. I've written before about the brutality of this market, listing 13 companies which were either merged or acquired or disappeared in the last decade. Now both Motorola and Sony Ericsson will soon be added to the list. On average, it's as if one phone vendor has disappeared every year for fifteen years.

    And it's still not over. RIM is also becoming a going concern issue, and LG has a big question mark above it.

    Of course, ZTE and Huawei and Lenovo are joining the list of competitors but I note that they are not focused on mobile phones. They are opportunistic phone vendors, depending on other businesses to compensate for the risks inherent in phone sales. It's interesting to note that neither Apple nor Samsung are pure phone plays.

    In fact, of all the phone brands only RIM and HTC are exclusively phone-only companies. It may indicate something profound is happening. The notion that the development and marketing of phones as an activity independent of other business models may be coming to an end.
  2. Revolutionary User Interfaces

    Research · 226 comments

    A few years ago, around the middle of the last decade, the mobile phone market was characterized by the rivalry between a few established vendors. These were Nokia, Samsung, LG, Motorola and Sony Ericsson. These incumbent companies had a broad portfolio of devices including smartphones and feature phones and basic phones. Many also sold networking equipment and were deeply engaged with their customers, network operators.

    There was also a set of entrants who offered only smartphones.  They were quirky. HTC was a a prominent "ODM" or original design manufacturer who built phones for companies who added their brands and sold and supported the product. HTC made phones and PDAs for operator brands and for some large PC companies. It also began to sell phones under its own brand. RIM was also offering products that had evolved from pagers into email appliances with added voice capabilities. But RIM's products were not very good as phones. Voice was so poorly integrated that many people carried both a BlackBerry and a voice phone. Then there was Palm with something called a Treo which promised many things but did not quite deliver.

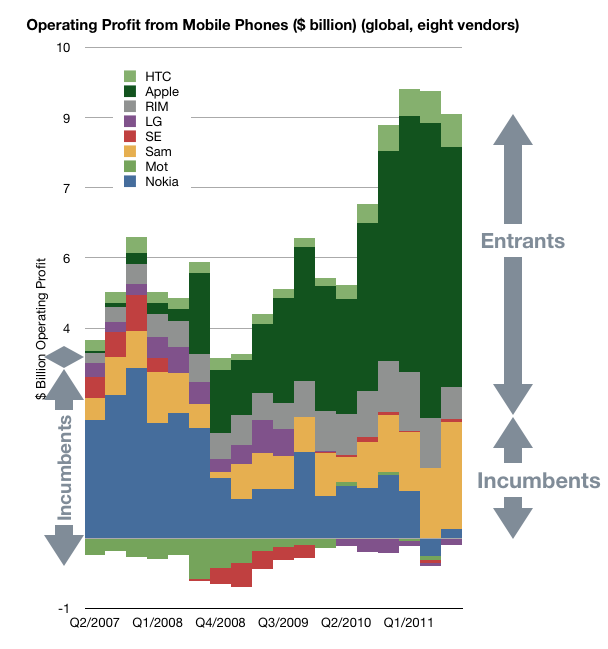
    In 2007 something happened which changed the industry. It took a few years to even realize it was happening but by the time it was obvious, it had changed to such a degree that huge companies found themselves in financial distress. This chart illustrates the effect.

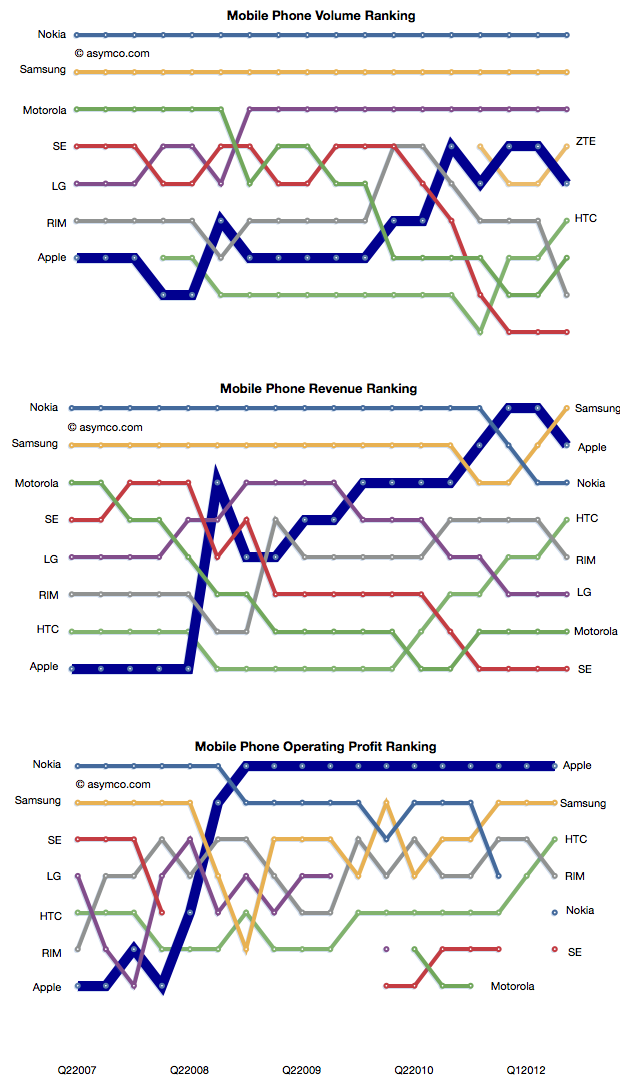
    In a few short years the rivalry between incumbent handset makers has evolved into a rivalry between mobile platforms where the incumbents were caught in an increasingly unprofitable role of hardware integrators. Motorola is now being absorbed by a search company. Sony Ericsson is being absorbed into a consumer electronics company. Nokia is going through a potentially existential crisis and even abandoned its platform. Acquisition talk surrounds LG's phone efforts. Samsung is prosperous but sill at the mercy of its software suppliers. Even the entrants are starting to feel beleaguered. RIM, the oldest pure play smartphone company is trading below book value and has regressed in value to 2004 levels. Palm evaporated. A view into the changes is the rankings of the companies in terms of volumes, sales and profit as shown below.

    How did large, powerful, smart companies let this happen?

    It happened despite having a clear, front row view of the transition of the industry from mobile voice to mobile computing. The shift in the basis of competition from "connecting people" to "connecting people to data" ended up being a classic disruptive trap. Many will argue that it was the failing of individual managers. Perhaps, but how did they conspire to fail simultaneously?

    When you see disruption happening, it's natural to seek out a cause, a pivotal magical "force" or event that enabled the weak to humble the strong--the proverbial sling that enabled David to defeat Goliath.

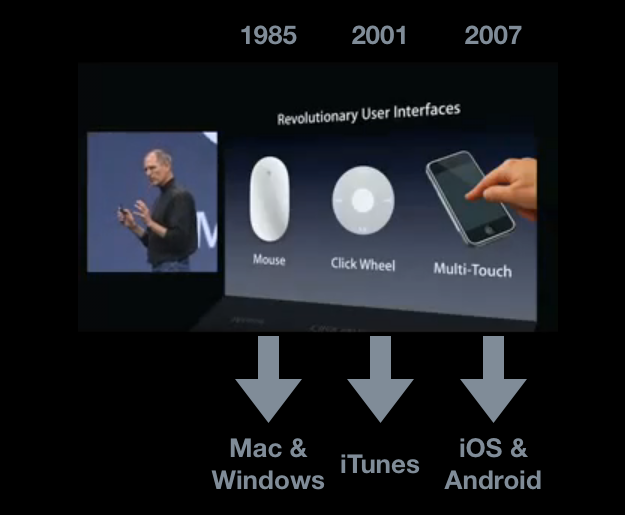
    My hypothesis is that The Primary Cause for the shift of profits from Incumbents to Entrants has been the disruptive impact of a new input method. I illustrated this with the help of the January 2007 slide presented by Steve Jobs at the launch of iPhone.

    Screen-Shot-2011-11-03-at-11-3-10.45.20-AM

    Each new input method led to not just a disruption but new platforms and new business models. Each new "sling" victimized a set of historic companies. Mainframe and minicomputers, consumer electronics giants and now telecoms.

    Just like David's sling, these technologies are not powerful in and of themselves, but rather, the way they are used makes them unpredictably sinister. The context of using capacitive touch on a handheld device rather than on a table-top makes it disruptive. Coupling it with high-speed mobile networks and powerful but efficient microprocessors made it into a force.

    That is now ancient history. The consequences and repercussions are still being felt and weighed, but the smart money should be focusing on the next shift. From the time frame in the diagram above, it's clear that the cycle time between "Revolutionary User Interfaces" is shrinking. It's been five years since multi-touch. Is the next "RUI" already here? Is Siri the next RUI?

    There are many things going for it:

    1. It's not good enough
    2. There are many smart people who are disappointed by it
    3. Competitors are dismissive
    4. It does not need a traditional, expensive smartphone to run but it uses a combination of local and cloud computing to solve the user's problem.
    5. It is, in a word, asymmetric.

    My disruptive hypothesis for Siri is that it shifts the competition from platforms positioned on a device to a "coupled" super-platform dependent on broadband and infrastructural computing.

    Just after collecting enough data and observing patterns in it that give us clarity, It looks like things are about to change all over again.


  3. Estimating Samsung's smartphone mix

    Research · 57 comments

    Samsung no longer reports mobile phone shipments. The company's phone market performance reporting is limited to the following:

    Shipment : High-20%↑YoY (low-20%↑QoQ)

    ASP : Slight increase QoQ

    As the company did not report volumes or ASP last quarter either, the QoQ (Quarter on Quarter) growth estimates are almost useless. The only fragment that might be useful is the "High-20% YoY" given that they did publish units for Q3 2010: 71.4 million. This leaves the question of what "High-20%" means. Here are some ranges and what the result would be:

    • 92.1 million assuming 29% YoY growth
    • 91.4 million assuming 28%
    • 90.1 million assuming 27%

    The "best guess" might be 91.4 million.

    As the company also provides revenue for its mobile division (14.42 trillion Won) we can therefore estimate the average selling price: $142. Is this a slight increase? By a similar approach, last quarter's ASP was $139, and assuming exchange rates did not vary widely, this increase is small enough to be called "slight".

    We also have a figure for the operating margin for the entire Telecom group (16.9%) which gives an operating profit of $2.2 billion.

    The last piece of the puzzle is the number of smartphones Samsung shipped. Samsung said smartphones grew "more than 300%" year over year. That would imply 31.4 million. One estimate is from Strategy Analytics that suggests 27.8 but it's coupled to an overall volume estimate of 88 million (well below the 91.4 million estimated above). The Wall Street Journal published an estimate of 28 million.

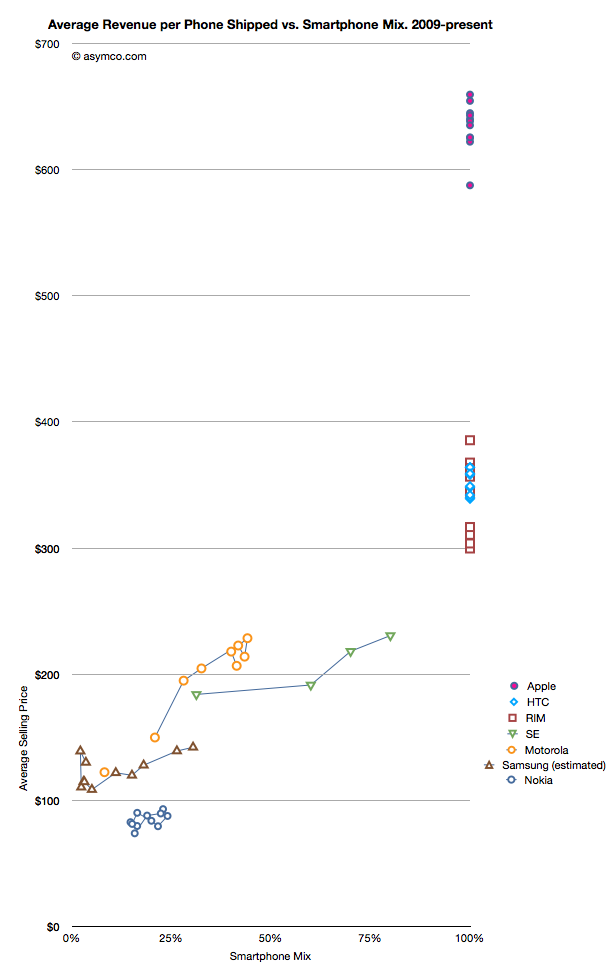
    I have no idea how to narrow down this estimate, but if we go with the one that claims the highest precision (27.8 million) we get an estimate of about 30.4% of Samsung's volumes being smartphones (what I call the "smartphone mix"). That is an interesting basis for comparing Samsung's smartphone business to other companies' smartphones. I prepared a graph showing how pricing is affected by the increasing mix of smartphones in vendor portfolios.

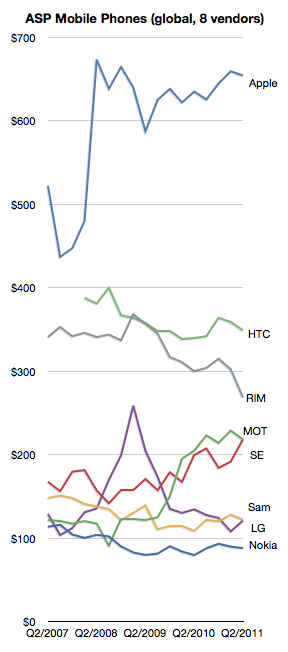
    What the graph shows is the movement of prices as companies have increased their smartphone mix since Q1 2009. For example Sony Ericsson moved from 31% smartphones to 80% smartphones in about a year. Their ASP increased from $184 to $231. Some companies have not changed their mix. Apple, HTC and RIM have maintained 100% smartphones in their portfolios so their pricing has been consistently high ($650, $354 and $357 over last 12 months, respectively). Conversely, Nokia has struggled with its smartphone portfolio and as a result its pricing has remained stubbornly clustered below $100.

    But the most interesting companies to watch are Samsung, Sony Ericsson and Motorola. You can see how their "vectors" or price migration point toward the sweet spot where HTC and RIM reside. Ideally, they would be very much better off with pricing in the $300 range.

    Samsung is moving quite rapidly toward the sweet spot but the slope is not as steep as the others. That's may be because SE and Motorola have much smaller volumes but it's still an open question why, with an estimated 30% mix of smartphones, the pricing remains $60 lower than when Motorola was at the same mix or $40 lower than Se.

    Some of the answer might be due to the number of "low end" smartphones (Bada?) that Samsung is selling or maybe their non-smartphone pricing is trending down a lot more rapidly.

    Keep in mind that if we change the assumption of the number of smartphones to a lower number (i.e. below 27 million) then the trajectory of the Samsung line in the graph would increase and may match more closely the slope of the other two vendors.

    I don't have any reason to believe that it's lower than 27 million but I don't have any reason to believe that it's above 27 million either. It's an estimate.

    If we believe it then we have to say that with a near tripling of smartphone mix (from 11% to 30.4%), the company grew its overall units by 28% and its revenue by 39% and pricing by 17%. Profits also grew by 130%.

    It would follow then that switching to a 100% smartphone mix would make a lot of sense.

  4. Are Apple’s investments in PP&E extraordinary?

    Research · 34 comments

    In his recent posts Horace took a look at Apple’s fixed assets and their development over the recent years. He also tested the hypotheses that Apple is making investments into machinery & equipment on which iOS devices are produced by overlaying iOS volumes with preceding changes in property, plant and equipment (PP&E).

    The question that has arisen is: Are Apple’s investments in PP&E extraordinary?

    To answer, I have compiled the capital expenditures (CapEx) for our previously established peer group [1].

    But first we need to clarify what CapEx include and not include. CapEx includes investment into property, plants, equipment, office furniture, larger IT hardware and in some cases patents; CapEx do not include investment into long-term marketable securities or other long-term financial instruments, acquisitions or capitalized R&D. Furthermore, CapEx are gross values and are not net of any sold equipment [2]. CapEx are largely depending on a company’s business model and strategy. For example if you are a manufacturer you need equipment to operate, if you are a software company or a retailer, your business will not be capital intensive.

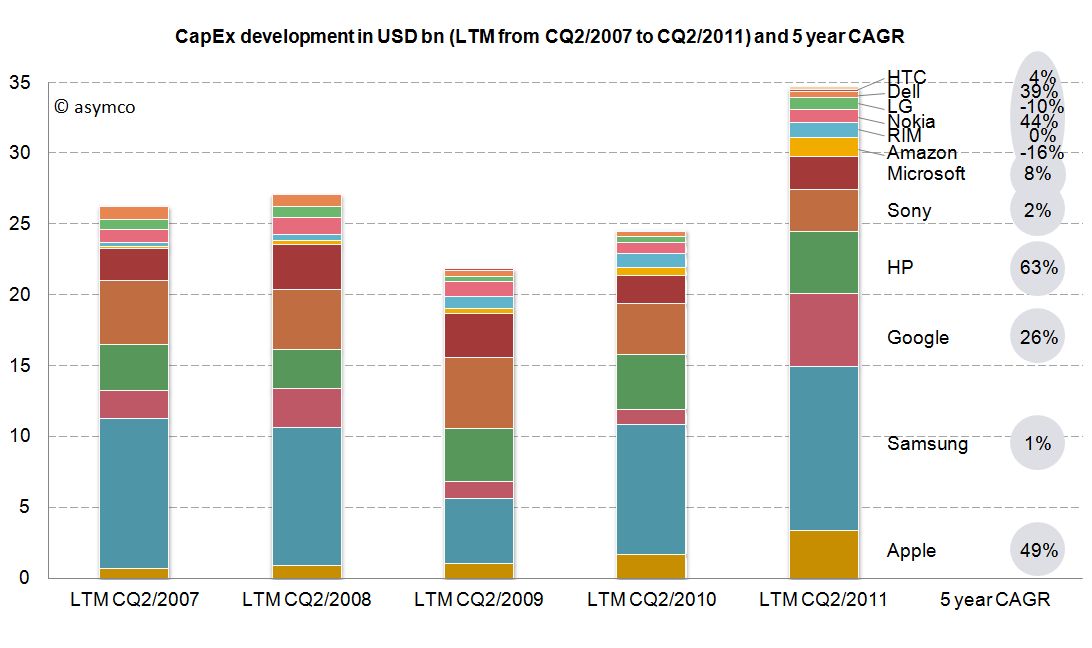
    As the second calendar quarter of 2011 is the latest quarter for which all companies have reported figures, we will take a look at last twelve months’ (LTM) figures from Q2/2011 backwards. The following stacked bar chart shows the combined CapEx of our peer group:


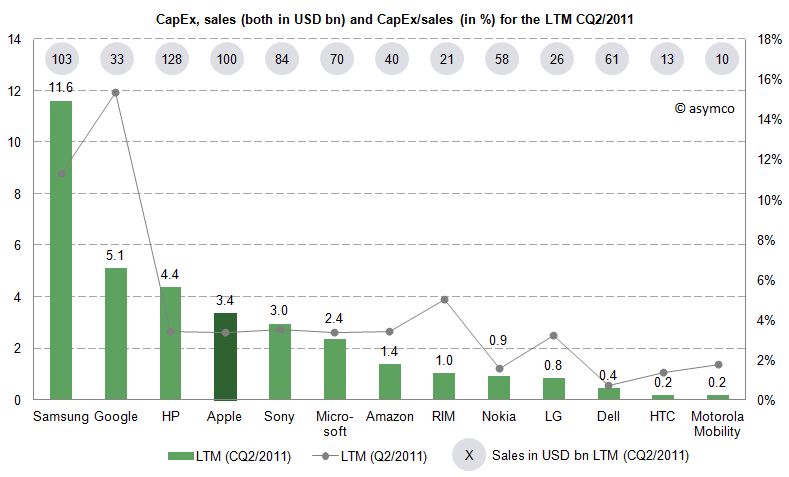
    The combined capital expenditures of our peer group for the LTM CQ2/2011 have outpaced even pre-crisis levels of investments and, combined, account for $34.7 billion. Samsung, a diversified manufacturer of IT hardware and other equipment, has invested more than $11.6bn with Google ($5.1bn), HP ($4.4bn) and Apple with $3.4bn following in line. While Google’s CapEx mostly account for its infrastructure of server farms and other IT hardware, HP’s CapEx mostly account for IT hardware it leases to its customers [3]. In absolute terms, Apple takes fourth place in CapEx spending for the last twelve months ending in CQ2.

    Since the business model and sales magnitude varies largely in our peer group, we can also take a look at a common measure to compare CapEx intensity by dividing CapEx by sales achieved in the same period. For the last twelve months we can depict the following chart:


    The average of the peer group accounts for 4.4% of CapEx over sales. Samsung’s and Google’s business model are clearly more capital intensive, while Apple’s CapEx ratio of 3.4% is below the peer group average but above some of its peers like Nokia, Dell, LG, HTC or Motorola Mobility. Interestingly, capital intensity of HP, Apple, Sony, Microsoft and Amazon is at a comparable level of around 3.4%.

    As noted before, business models and strategies are significantly different among companies in our peer group. However, while Apple’s CapEx intensity is not extraordinary, Apple’s CapEx in absolute terms are among the largest in it this peer group and have grown constantly throughout a five year period.

    Is this a good thing and why does it matter?

    CapEx by itself does not tell us much. We still do not know in what companies specifically invest as financial regulations do not require detailed CapEx accounts. We know that even if a company is not growing assets they need to be maintained, upgraded and replaced – this spending is also called "Maintenance CapEx". Everything else can be called "Expansion CapEx" associated with new product launches, entry to new business area or geographies or expansion of (manufacturing) capacity.

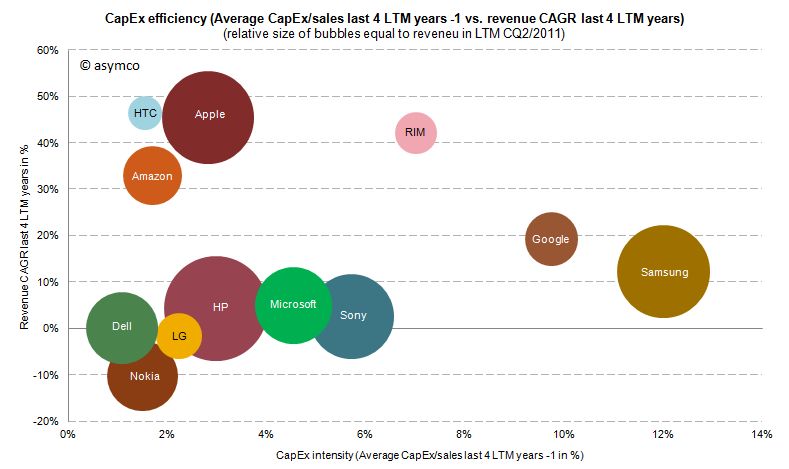
    Therefore, Expansion CapEx is closely linked to expected organic sales growth in the future. So let’s go ahead and link CapEx ratio of the previous years with the sales growth of the following year. The following chart shows the cumulative average growth rate (CAGR) over the last four years versus the average of CapEx/sales ratio of the four last preceding years:


    We can see that high CapEx efficiency has been achieved by Amazon, Apple and HTC with sales growth rates of 33-47%. RIM reached similar revenue growth but with higher CapEx intensity. Google and Samsung with high CapEx intensity have only reached modest growth rates. Dell, HP, Microsoft and Sony have not grown significantly but have close to average CapEx intensity.

    We cannot state that CapEx in absolute terms have been extraordinary for Apple, but we can witness that with below average CapEx/sales ratio Apple outgrew in absolute terms Dell, LG, Microsoft, Nokia and Sony and has grown close to the revenue size of Samsung and HP in the last four years.

    ---

    Notes:

    1. Excluding Lenovo (not reported) and Acer (extra-ordinary low numbers reported, to be investigated), Motorola Mobility figures only available for the last six quarters
    2. Minor differences may occur due to local Generally Accepted Accounting Principles (GAAP)
    3. HP assumes ownership of these assets and rents them to the customers who in turn have a smaller balance sheet and can run IT hardware CapEx through the income statement as lease expenses
  5. Windows Phone, a year on

    Research · 103 comments

    Windows Phone is in limbo. The company acknowledged that it has performed below expectations. During the last quarter for which we have data (ending June) I have an estimate that Windows Phone sold only 1.4 million units (Gartner's sell-through analysis suggests 1.7 million). That gives Microsoft a 1.3% share of units sold (Gartner 1.6%), a new low.

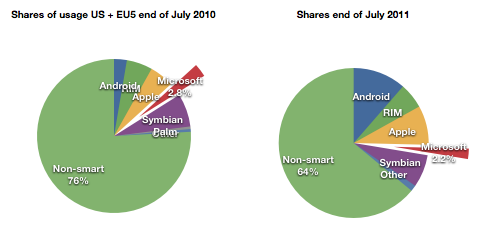
    At the same time, comScore data shows that user erosion in the US and EU5 has slowed and is holding at about 2.2% of all users.

    For its part Microsoft has lain low during the last few months. It released version 7.5 (Mango) last month to manufacturers.  It has a number of Windows Phone SKUs in the market or recently announced (27 with version 7 and eleven with version 7.5)

    It also sued Android vendors successfully and obtained royalties from the largest Android licensees Samsung and HTC. Patent royalties from Android are probably going to be higher than license revenues from Windows Phone for quite some time.

    Something is missing from this analysis. Clearly Microsoft has a plan. It's always had a plan. The plan is not easily perceived because the market Microsoft addresses itself to is not directly to the consumer--we cannot read the message. Microsoft needs to work through partners. Device vendors and operators mainly. In order to persuade them Microsoft deploys its check book.

    Put another way, the plan is that Microsoft intends to buy market share. Before we get into exactly how, we need to understand the most important but least discussed contributor to device sales: channel incentives.

    Before a phone is sold it needs to get through a mine field of obstacles: it needs to appeal to operator or distributor priorities; it needs to fill a slot in a portfolio of products for the manufacturer and the channel; it needs to acquire shelf space; it needs to appeal to some end users and, unless it has a blindingly strong brand, it needs to offer incentives to the retailer.

    This last piece of the puzzle is something of a mystery. Although not a universal practice, in many cases retail staff are paid commissions directly or indirectly by the device vendor. This relationship between the retailer and the vendor is not transparent. A buyer typically does not know what incentives are attached to a given device. Stories of salespeople steering people to and away from certain devices abound.

    Microsoft acknowledges this:

    Both Samsung and HTC Corp. have committed to increasing marketing budgets for the phones, said Andy Lees, president of Microsoft’s mobile unit, in an interview. While manufacturers will determine how the money is spent, some of it will probably go toward spurring retail staff to tout Windows Phone models, he said.

    Microsoft Phones to Get More Marketing, Sales Incentives - Bloomberg.

    In another interview:

    Q: It seems like one of the challenges is getting the salesperson in the store to push the phone.

    A: Absolutely. I think that's a number of things:

    One — they get influenced by how good the product is. The reviewers have influence with that and also their own experience.

    The second thing is the alignment with the operator. I think we're already pretty aligned and over the life of this release, we'll get even more aligned.

    Much more here: Business & Technology | Windows Phone chief Andy Lees sees time ripe for Mango | Seattle Times Newspaper.

    What's more, Microsoft and Nokia have a deal whereby at least one billion dollars from Microsoft are earmarked for the promotion of Nokia Windows Phones.

    Even prior to the launch of the Nokia relationship, with the original Windows Phone launch exactly a year ago, Microsoft made clear that it had a budget for promoting Windows Phones ($400 million in fact). In the event, the money seems to not have been spent, or spent sparingly because LG made public its disappointment. The coded language can be interpreted as a snub to Microsoft for withholding promised funds.

    Perhaps the funding was withdrawn because by the time the launch was scheduled, the Nokia deal was being negotiated. Perhaps Microsoft felt it better to put more effort behind the re-launch of the platform with Nokia on board. A re-launch which has yet to happen but seems to have already had $127 million allocated to it by Nokia alone.

    Microsoft is proud of what it has accomplished with Windows Phone because they were able to update the OS in 11 months and took only about two years to completely rebuild Windows Mobile into Windows Phone.

    But the dependence on a complex value network means that products do not reach users quickly enough and when they do the marketing message is weak, even when backed by large budgets. The real problem with Microsoft's approach is that it's neither viral like Android (because it has a price and a contract associated with it) nor is it focused and agile like Apple's. It seems to suffer from the worst aspects of modularity (market lag) without benefiting from the control over the ecosystem and end user experience that differentiates it.

    Microsoft will muddle through but the 20% share that it says is "conservative" seems anything but.

  6. Mobile Impossible

    Research · 25 comments

    In yesterday's post about the "biggest mobile loser" I covered the exodus of users from non-smart devices in the US and EU5. I also said that what happens in those regions tends to happen in other regions with a time shift. In some regions it happens quicker but in most it happens more slowly.

    But can we be sure that there isn't vast non-smartphone growth in other regions? Well, no, we can't be sure. At least not without access to reliable data.

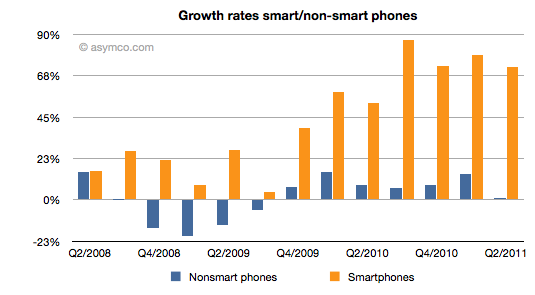
    But what we can track is the overall non-smart phone market and compare it to the smartphone market. Here are the growth rates of the two sub-markets:

    The difference is plain to see. We can also note that the non-smart market may be heading into a contraction--something noted by some analysts close to the market--but no real sign of that happening in smartphones.

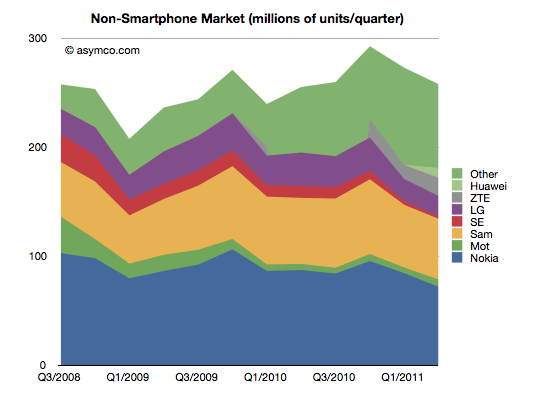
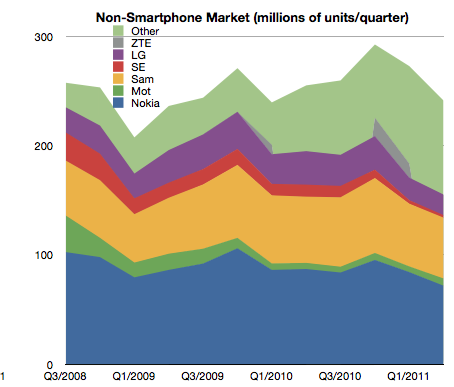
    Beside growth, we can also see actuals and the split of various vendors' volumes in the market.

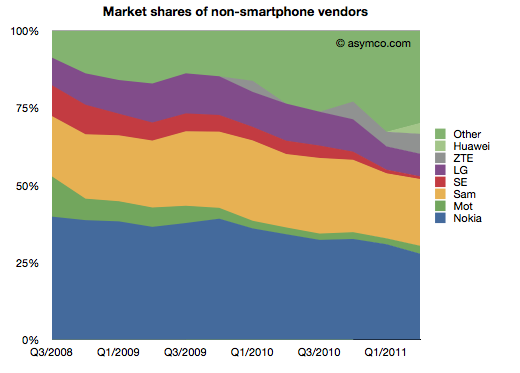
    It's also clear that the top line has not moved much in the last few years. Next, the shares of the vendors.

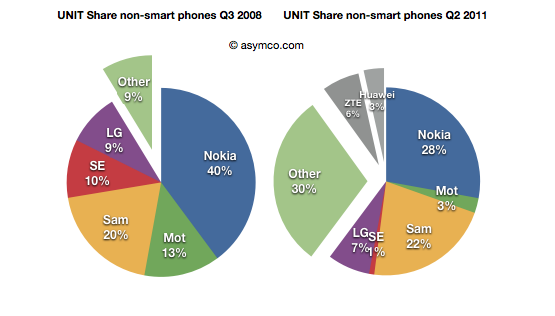
    Finally, the before-and-after share pies.

    We can see that the growth story, if there is one, is coming from low-end entrants. In late 2008 the main brands had 90% share. They now have about 60% (in a flat market.) The growth is all from "Other".

    What seems to be happening is that buyers in mature markets are swapping (or upgrading) from non-smart to smart and adopting new smartphone brands. At the same time, new users in emerging markets are increasingly adopting new non-smartphone brands.

    So the question for the incumbent vendors is extremely important: Facing them are low-end and smartphone entrants engaged in a pincer movement, with obvious success; can the old brands survive?

    The answer, as always, depends on whether the competition is symmetric or not. Low end competitors are usually structured around low cost structures. High-end competitors are exploiting new markets and new business models. For an incumbent to survive and fight on both fronts they'd have to adopt both of these models for themselves, simultaneously and quickly.

    We can see that Sony-Ericsson and Motorola (Google) have thrown in the towel on the low end. The question of dual-front strategy is mainly relevant only for Nokia, Samsung and LG. LG is on the ropes and may actually be ready to exit the market so that really means Nokia and Samsung. Nokia has signaled continuing interest in the non-smart market (citing "the next billion users"). Samsung also seems to be hanging in there. Can they do it?

    I cannot stress how difficult this is or how rarely it has been achieved. The two approaches are if not opposites then at least orthogonal. It's like Mission Impossible. You can't be a low cost global vendor while investing in R&D for differentiated platform-based devices. These are shaping up to be businesses requiring completely different skill sets. Few have the ability to host these skills inside one company. I can think only of one example.

  7. Samsung's Polyplatform Paradox

    Research · 57 comments

    Samsung has, over the years, shipped phones using almost every operating system it could get a hold of. That includes Symbian, Windows Mobile, Windows Phone, LiMo, Android, PalmOS and OPhone.

    As far as I know, today its portfolio includes Android, Windows Phone and its own Bada OS. The relaxed attitude to platform exclusivity at Samsung is in stark contrast with almost all other competitors who either for the sake of encouraging their own platforms or minimizing development costs maintained either one or two smartphone platforms.

    Samsung justified their polyplatform strategy a few years ago by saying that different platforms are popular in different regions and as they did not want to be excluded from any market, they felt that being agnostic is the best policy.

    The idea that platforms are not universal, but the result of provincial preferences is interesting. It's a concession that "politics" plays a large part in mobile markets. However, for all the volume growth the strategy has produced, the strategy has not paid off in terms of higher margins or pricing power as the following chart shows.

     So perhaps polyplatform thinking is coming to an end.
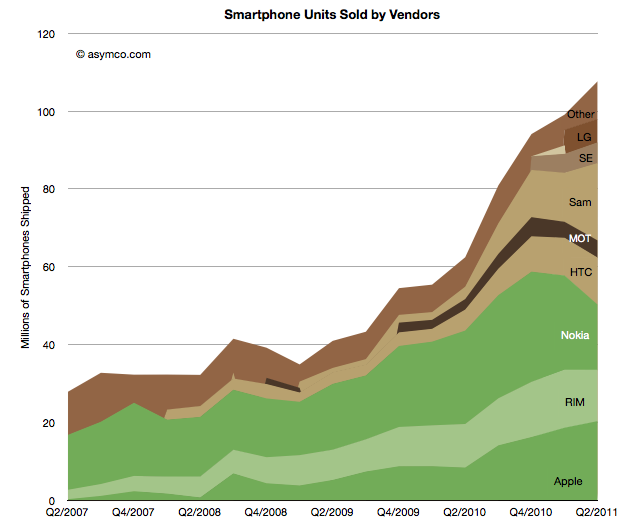
    Exhibit A is Bada itself. The idea that Samsung would build its own OS came as a surprise to anyone following their history. Why did Samsung buy a book when there's a library in town?

    Exhibit B is the repeated statements of Samsung's Chairman saying that the company should invest in software. Software!

    Exhibit C is the statement today that Samsung intends to spend some of its $9.3 billion R&D budget on Software.

    The money is expected to be used to strengthen the company technology prowess in such areas as mobile phones, semiconductors, displays and electronics products. Funds will also be allocated to software development.

    Samsung investing in software development does indicate that perhaps the company does see value in that component and would prefer not to be dependent on suppliers for it.

    In theory, as the market power of inputs (supplier power) increases due to concentration and forward integration it makes sense to backward integrate.

    As a supplier itself, however, Samsung has to ask itself if its component customers are thinking the same thing.

  8. The fate of mobile phone brands

    Research · 99 comments

    The violence with which new platforms have displaced incumbent mobile vendor fortunes continues to surprise.

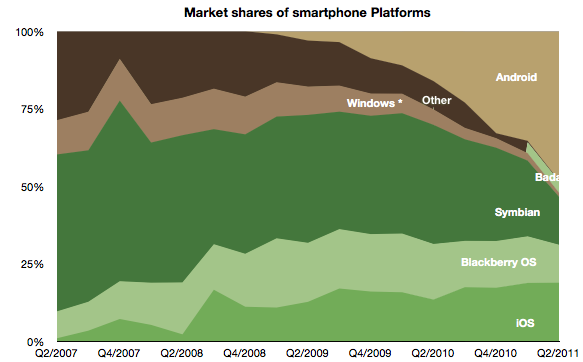
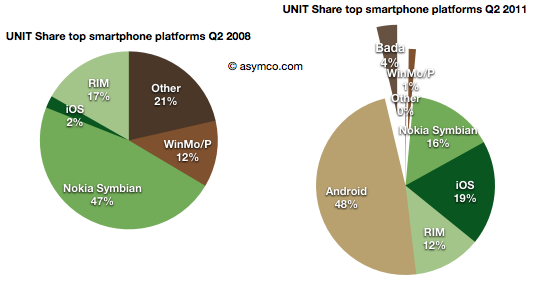
    • Nokia's Symbian platform has gone from 47% share to 16% in three years
    • Microsoft's phone platforms have gone from 12% to 1%
    • Other platforms have gone from 21% to zero
    • Although far less dramatic, RIM's decline from 17% to 12%  is causing acute pain and anxiety

    This while entrants have grown share in spectacular fashion:

    • Android from zero to 48% (A two year period)
    • iOS from 2% to 19%
    • Bada from zero to 4% (two quarters only)


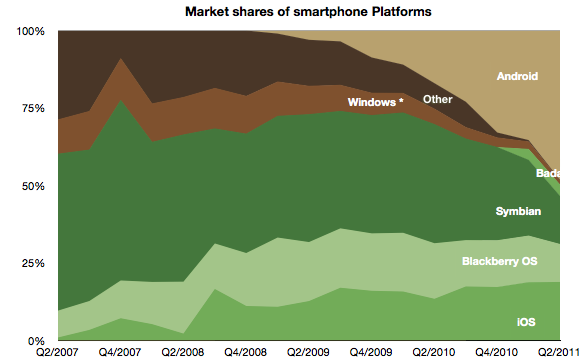
    The picture of platform share over time looks like this:


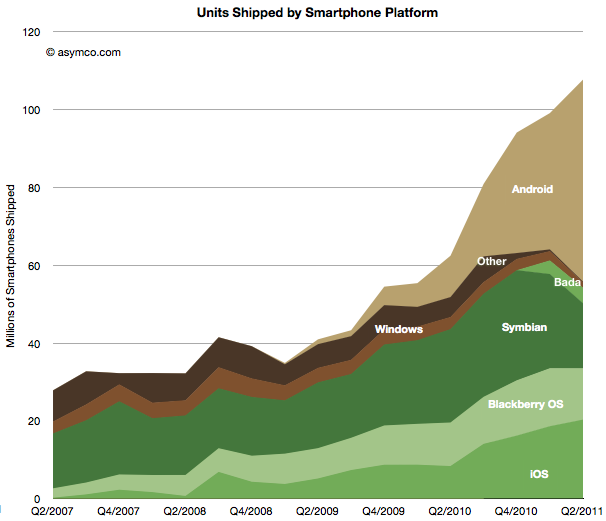
    The platform volume growth is shown in the following graph:

    Shocking

    Or is it?

    The surprising thing is that it should not be surprising. When the iPhone re-defined the basis of competition (at the beginning of the time frame of these charts) it unleashed forces which are still spinning the industry into a new configuration.

    In that context, Android is a natural consequence. As iPhone created a threat, the response from all other vendors (other than Nokia and RIM) was to seek something that would sustain their business. Android was salvation.

    It enabled the pursuit of better margins and hence better returns. So much so that Android offers the escape up-market they have always sought. It enables vendors to abandon the profit-free feature phones to low-end entrants like ZTE and Huawei.

    LG, Samsung, Motorola and Sony Ericsson all took the bait. They are racing as quickly as possible to turn their feature phone portfolios into Android portfolios. This is certainly something that Google also wants to see happen and has been planning all along.

    However one of the consequences of the modular (aka "open") approach is that the low end disruptors gobbling up low-end share are also motivated to move into the Android business as soon as it comes within reach.  The only reliably predictable consequence of Android will be the postponement of displacement of the existing brands by the low-end entrants.

    Is this fate unavoidable for all brands?

    Clearly some vendors see the trap. For all its apparent failings, Nokia saw this outcome and chose to attempt a "Hail Mary Pass" with Microsoft. The strategic point being that because they no longer had faith in their ability to execute on an independent platform, they would pick a platform that gave them at least some control or leverage. There are serious risks and problems with this approach--something which has been covered here already--but the bet being made is a clear rejection of the slippery Android slope.

    RIM is trying to resist with QNX which is a similar approach but timing may also be the undoing of this strategy. HP's approach with WebOS and Samsung's Bada are also hedges to avoid this fate.

    And what about Apple?

    Apple is always skating in a different direction. iOS needs to be seen as not so much a phone platform but a computing platform. Given what we know, iOS was always conceived as the future of computing. Voice, after all, is just an app on iOS. So my expectation is that Apple's iOS will continue its attack on the mobile computing market, skimming (or carving as the case may be) profits from the phone business to sustain its ultimate target of reclaiming the computing universe.

    By this thinking iOS lives only by improving more rapidly than anything else in dimensions that redefine the basis of performance. In other words, doing more of what the iPhone did in the first place to set off this disruption.

  9. The Competition

    Research · 20 comments

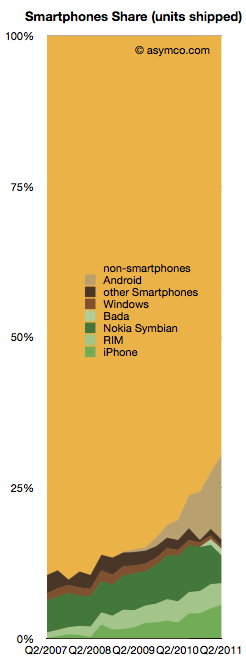
    Smartphones made up about 30% of global phone sales last quarter. That is a significant increase from 10% in Q4 of 2007.

    From this perspective, iPhone obtained 5.6% share, Android 14.2%, Nokia Symbian 4.6%, RIM 3.6%, Bada 1.1% and Windows 0.4%.

    The competition however still has 70.5%.

    The chart to the right shows the challenge remaining and the progress being made.

    The good news is that the non-smartphone market is not growing while the smartphone market is. In fact, the non-smart market has had a three year CAGR of 0% and a y/y growth of 1.0% and a sequential decline of 6%.

    The non-smart portion of each branded vendor's business is pretty dismal:

    • Nokia saw 17.57% decline y/y
    • Samsung's non-smart business declined by 8.14%
    • Sony Ericsson's dropped by a dramatic 80%
    • LG's fell by 38.56%
    • Motorola is the only one that grew y/y, by 17.86.

    The reason all these brands fell is because the unbranded vendors took their place. "Other" non-smartphones grew by 43%. They have been sustaining growth at the rate of 57% compounded over three years.

    The following chart shows the increasing share taken by the "other" vendors in non-smartphone units:

    The non-smart business is so dismal for branded vendors that I've been assuming that they will cease to build such devices in the near future.

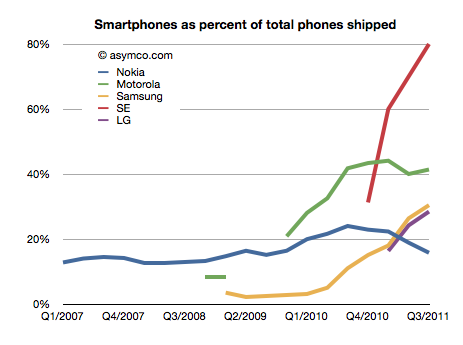
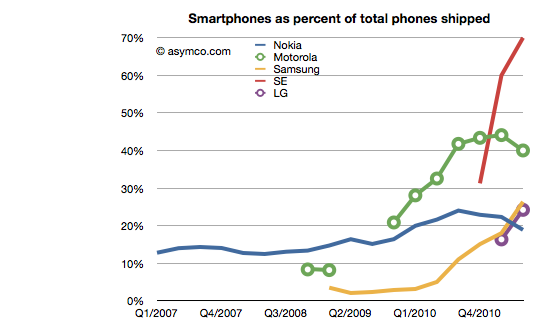
    The trend is shown in the following chart which shows the percent of units for branded vendors which are smartphones.

    Motorola, Sony Ericsson and Samsung are fleeing to smartphones as rapidly as they can. LG is following as quickly  as possible as well.

    The only question remains with Nokia. While their smartphone business evaporates they've also made a commitment to the non-smartphone market and are thinking about "the next billion" users who, presumably, will not buy smartphones and will buy some variant of Nokia's Series 40.

    Targeting the low end may be commendable, but the question they need to answer is why would those next billion buy anything other than a low cost smartphone? And if not, then what's so different about the next billion?


  10. The Android and iOS pincer movement

    Research · 47 comments

    Nearly all the data on smartphone shipments is now available for the second quarter 2011. Some fragments are still not public, including ZTE and Huawei (and any others) shipments. We also have estimates for the various platforms including an estimate for Windows Phone and Bada (though not for WebOS).

    This allows the following chart:

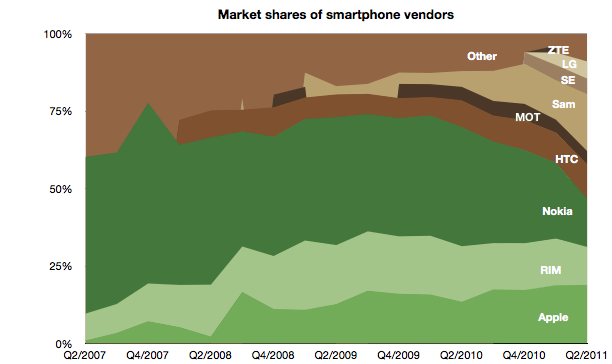
    Using the traditional color scheme which separates "integrated" from "modular" vendors, the chart shows overall volume growth and how the volumes are split among vendors.

    The market grew at about 73% y/y and 50% compounded over three years and 9% sequentially. The y/y growth rates for individual vendors were:

    1. Samsung 525%
    2. Apple 142%
    3. HTC 124%
    4. Motorola 63%
    5. "other" 29%
    6. RIM 18%
    7. Nokia -30%

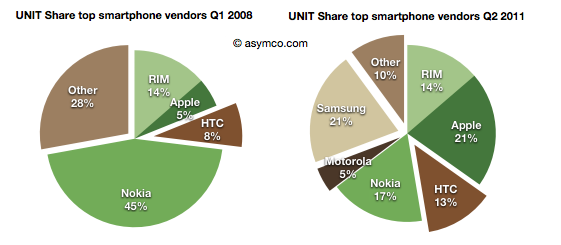
    In terms of unit share, the pie charts below show the before and after (three year span):

    And the stacked area below shows every quarter over a four year period.

    The story is largely unchanged since last quarter except perhaps in the rapidity or deterioration in Nokia's performance and Samsung's partial exploitation of that decline.

    It should be noted that not all of Samsung's volumes are licensed platforms. An increasing share of Samsung smartphone volumes is Bada, an internally developed OS.

    In the charts above I arranged the bars to place Nokia and RIM in the middle to show their double envelopment. A pincer movement is only an analogy but perhaps it's evocative of what's happening.

  11. The Samsung hedge: Estimating Bada for Q2 and hence Samsung's Android shipments

    Research · 28 comments

    The number of Bada phones shipped last quarter is not public, however some assumptions can be made that lead to plausible estimates.

    First, we know that Samsung shipped about 3.2 million smartphones in Q2 2010 and that total included Bada and Android (and perhaps even some Windows Mobile).

    Second, we know that there were about 19.9 million smartphones in Q2 2011.

    Third, Canalys published an estimate that Bada grew by 355% y/y.

    So if we knew how many Bada phones shipped in Q2 2010 we could derive the current Bada shipments and also realize how many of the nearly 20 million smartphones from Samsung were actually Android.

    The clue is in an estimate from December last year that suggested that there would about 5 million Bada shipments in 2010. Coming close to the end of the year, and from Samsung directly, we can be pretty sure the figure is accurate.

    Taking this 5 million and spreading it over four quarters could give us enough of an estimate. That makes 1.25 million quarterly units. If we assume some seasonality or increase toward the end of the year, a Q2 figure of 1 million might be more accurate.

    Therefore, applying the 355% growth rate yields a Q2 2011 estimate of 4.5 million Bada shipments and hence about 15.4 million Android devices from Samsung last quarter.

    Considering the increasing importance of Bada to Samsung, it should be clear that Android is not the only source of growth for the company and its transition of feature phones to Bada as well as Android is a key strategic driver for differentiation vis-a-vis low end entrants.