As we move ahead into the September quarter, I'd like to review our outlook, which includes the types of forward-looking information that Saori referred to at the beginning of the call. We expect our September quarter year-over-year revenue performance to be similar to the June quarter, assuming that the macroeconomic outlook doesn't worsen from what we are projecting today for the current quarter. Foreign exchange will continue to be a headwind, and we expect a negative year-over-year revenue impact of over 2 percentage points.
We expect iPhone and Services year-over-year performance to accelerate from the June quarter. Also, we expect the revenue for both Mac and iPad to decline by double digits year-over-year due to difficult compares, particularly on the Mac. For both products, we experienced supply disruptions from factory shutdowns in the June quarter a year ago and were able to fulfill significant pent-up demand in the year ago September quarter.
We expect gross margin to be between 44% and 45%. We expect OpEx to be between $13.5 billion and $13.7 billion. We expect OI&E to be around negative $250 million, excluding any potential impact from the mark-to-market of minority investments, and our tax rate to be around 16%.
Luca Maestri, CFO Apple Inc., Aug. 03, 2023
In August Apple reported Net sales growth of -1% and EPS growth of 5.4%. My expectation is a 1% sales growth with EPS growth of 11.4%. This might be slightly optimistic but it's based on the following assumptions:
iPhone unit growth of -1.4% (y/y) but revenue growth of 2% (as per guidance, up from -2% previous quarter's growth).
Mac unit and revenue growth of -12% (this might be optimistic, low confidence)
iPad unit growth of -2% but revenue growth of -12%.
Services revenue growth of 12% (acceleration from 8% q/q)
Wearables 2% revenue growth (consistent q/q, down from 10% y/y)
I estimate the gross margin to remain at 44.5%, open to be $13.5 billion (low-end of guidance), OI&E at -$250 million (per guidance) and tax rate at 16%.
The number of shares I estimated at 15.666 billion (down 109 million, below 126 million average drop for last 8 quarters.)
To summarize, for the fiscal fourth quarter 2023:
Total revenue: $91.1 billion
EPS: $1.43
Revenue by segment:
iPhone: $43.5 billion
iPad: $6.2 billion
Mac: $10.0 billion
Services: $21.5 billion
Wearables/Home/Accessories: $9.8 billion
Gross margin on total revenue: 44.5%
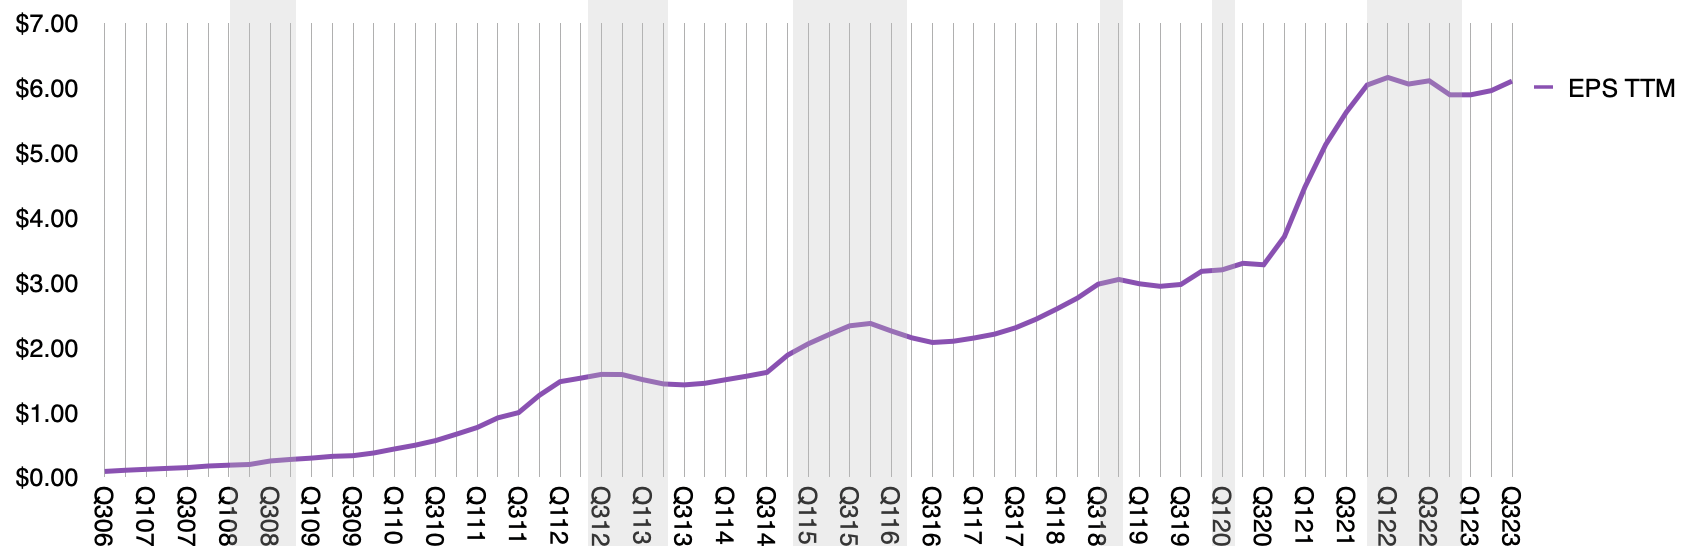
As can be seen in the following graph, my expectation is that the company will return to a pre-Covid growth trajectory (on a TTM EPS basis) after a transient surge and recovery due to the phenomenon of work-from-home and reduced travel. The uncertainty related to Covid is subsiding but macro and geopolitical uncertainties remain and the company continues to provide limited guidance.
I'm super excited to announce the Apple Investor Event 2023. This will be the third Apple Investor Event I've hosted but it's been a long time since the last one.
The event will take place November 9th, 2023 in Downtown Boston Area (precise location will be announced soon.)
The program is a series of talks with data/visualizations on the following topics:
Products: Financial performance and market overview.
Services: Understanding synergies with products
Valuation: Measuring customer creation and retention
Growth: Opportunities in Products, Services and Geographies. Emphasis on new products in Spatial Computing.
Limits to growth: Market Saturation, Apple Silicon headroom, GDP growth.
Before the iPhone launched in late 2007, Apple was trading consistently at a P/E ratio above 30. Here is a table for the P/E ratio on each Friday's closing price from May to August, 2007. The iPhone launched on June 29, 2007.
Apple's P/E ratio around the iPhone launch
Date
P/E Ratio
5/23/07
31.5
5/30/07
31.6
6/6/07
34.1
6/13/07
33.7
6/20/07
34.6
6/27/07
33.6 (2 days before iPhone launch)
7/11/07
37.2
7/18/07
34.6
7/25/07
34.3
8/1/07
33.3
8/8/07
34.2
8/15/07
30.2
Apple was not super powerful but it was not doomed either. It was a time when the iPod was dominant and the Mac was still alive. iTunes re-wrote the rules of the music industry and debate was raging whether Apple should be considered a media company. Platforms were not its strength but Steve Jobs showed he was still able to distort reality.
These good times did not last. The first year of the iPhone was a period of minimal contribution from the new category with Apple still largely valued on the basis of the iPod. The predictions of failure for the new communications product, especially given its high price, were legendary. It wasn't until 2008 that the iPhone began accelerating and making a meaningful contribution to the bottom line.
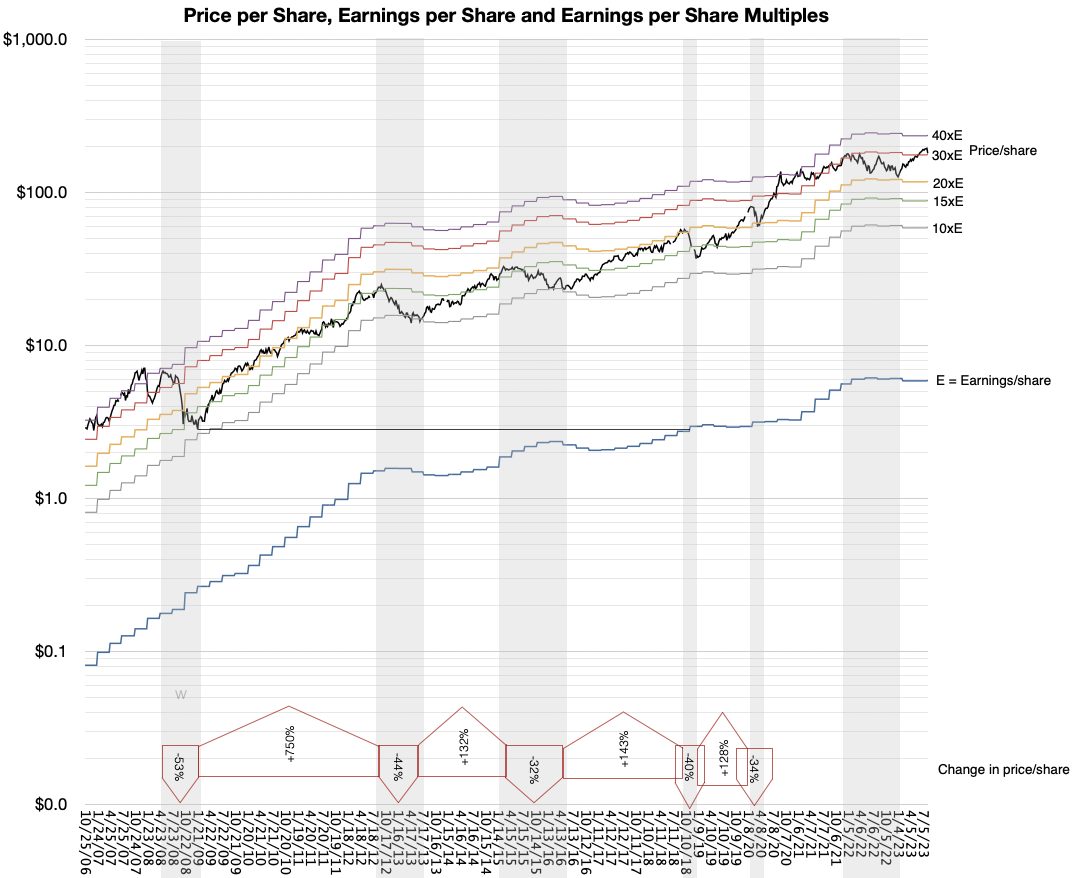
It was then, in late 2008, that Apple's valuation broke. The P/E ratio fell from above 30 to nearly 10. The following graph shows the catastrophic 53% share price collapse coupled to the triple digit surge in earnings which led to the P/E ratio tanking.
[The graph shows earnings per share for the trailing 12 months (blue line) and 10x, 15x, 20x, 30x and 40x that value (colored lines). The share price is the black line. The share prices are sampled every Friday. The graph is notably logarithmic. The grey shaded areas are periods of significant contraction. The percent drops/increases during these periods of contraction/expansion are shown in the annotation arrows near the bottom.]
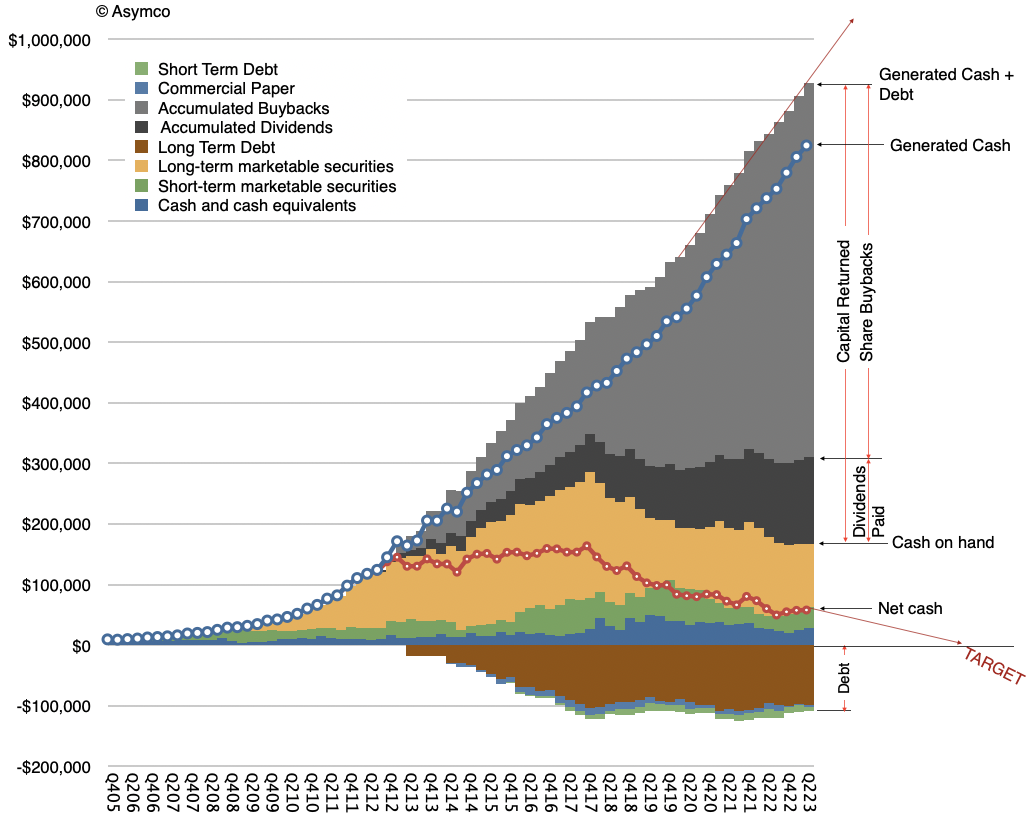
The valuation remained broken for 12 years, between late 2008 and late 2020. This period being, arguably, the most remarkable wealth creation event in history of business. For evidence see the following graph showing the amount of retained earnings returned to shareholders building inexorably toward one trillion dollars. This is not share price appreciation but cash returns. [If you have evidence of a larger wealth-creation event do let me know.]
The creation of $800 billion of shareholder wealth at fire-sale share pricing.
As I explained throughout this period, motivation to dispose of shares which create immense wealth is explained by the fable The Goose That Laid the Golden Eggs but the question some are asking now is whether more wealth can still be created, and if so, can we expect Apple's valuation to collapse accordingly?
I should note that during the long, dark years of wealth creation, other technology companies such as FaceBook, Amazon and Netflix, Google (so-called FAANG) and Microsoft enjoyed far higher multiples than Apple, sometimes 3x higher. This was not seen as abnormal by analysts because those companies were always assumed to have higher growth potential, with a diverse portfolio of opportunities while Apple's growth was perpetually in its past, based on one product.
Paradoxically perhaps, since the Covid-19 pandemic Apple shares have enjoyed P/E ratio roughly equivalent to the other tech companies. For instance, peaking at 42 in January 2021, the P/E ratio has averaged about 27.5 since then. Simultaneously, diversified companies such as FaceBook (now Meta) and Netflix collapsed due to serious business model flaws (based on single sources of income) and Google (now Alphabet) and Amazon have slowed growth and are facing anti-trust scrutiny. Having lost any presence in mobile computing Microsoft has become entrenched in enterprise, finding new businesses in cloud and (possibly) generative AI. As a result of these reversals, the contrast between Apple and the mega-cap cohort has become fuzzy.
So back to the question: does it make sense to price Apple in the 30x P/E or should it go back in the gutter at 10 to 20?
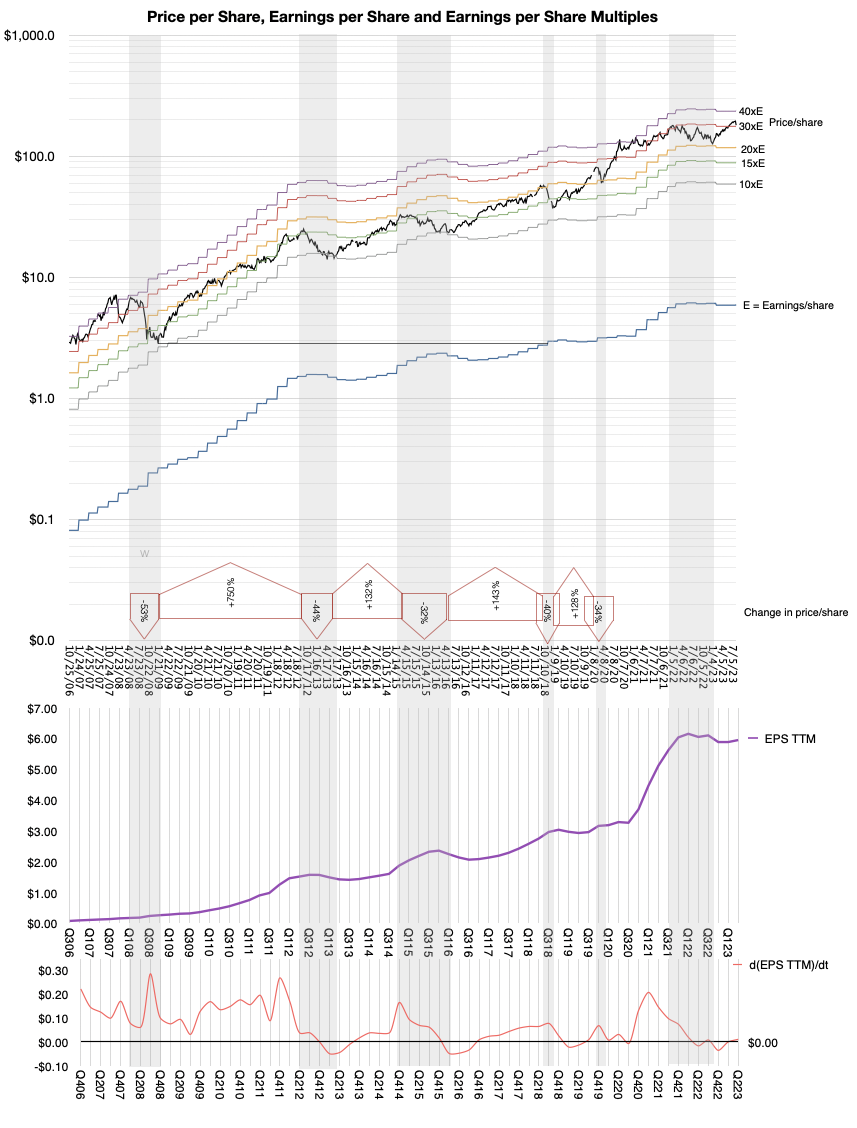
I would argue that the big change in perception hasn't been the surge in earnings during Covid (see graph below). The big change is the realization that Apple is no longer about to go out of business.
How could Apple not be going out of business?
Remember that a P/E ratio in the teens is a clear signal from the market that the company is a questionable "going concern". This is parlance indicating doubt that the company will continue in its present form..
What has changed since 2020 is that even though there were a multitude of crises—from war to pestilence—the eggs kept coming. Perhaps, perhaps, Apple was not doomed after all. In that time it managed to create 1 billion customers. Perhaps having 1 billion customers was a positive outcome. Perhaps counting iPhones during a single quarter was not the only way to value the company. Perhaps having 1 billion satisfied customers made it viable. Perhaps having 1 billion satisfied and loyal customers returning every year was interesting. Perhaps having 1 billion satisfied wealthy customers meant the end is not around the corner. Perhaps having 2 billion active devices in use was sustainable. Perhaps providing services to 1 billion customers using 2 billion devices delivered through 1 billion subscriptions made some sense. Perhaps having all this data in a linear graph made it predictable?
Perhaps. Though Apple provided updates on these figures regularly, the questions everyone asked were still on unit shipments (which Apple stopped providing.) While Services grew at double digits and 70% margins the questions from analysts on conference calls persist on the iPhone and currency or production "headwinds". Perceptions take time to change. They are still changing.
Maybe at this point it's time to agree that Apple's end will not come through being easily replaced by the competition (first Windows then Android, etc.) but by having access to its markets restricted. Being the only American company to have cracked the China puzzle, it's surely vulnerable there. And please don't mention India.
Apple is no longer doomed because it's too weak. It's doomed because it's too strong.
It seems that it's not too hard to believe the end is still near.
As I remember it, at least 10 years ago, I began to hear anecdotes from developers who built apps for both iOS and Android about their economics. The story is that they tended to have twice as many users using Android but that iPhone App Store revenues were roughly twice those of Google Play Store. From that I devised a rule of thumb that an iPhone user was about 4 times more valuable than an Android user. Half the users, paying 4 times as much means double the income.
Over the years I came across a lot more data about market development (the diffusion of innovations) and market creation (the innovation process) and applied it to transportation. Along the way I also became more aware that figures of consumption and spending are not normally distributed. That it turns out that the governing function of much of human behavior is log-normal. That is, it is skewed rather than balanced or symmetric around an average. Classic examples are income distribution and the distribution of travel distances.
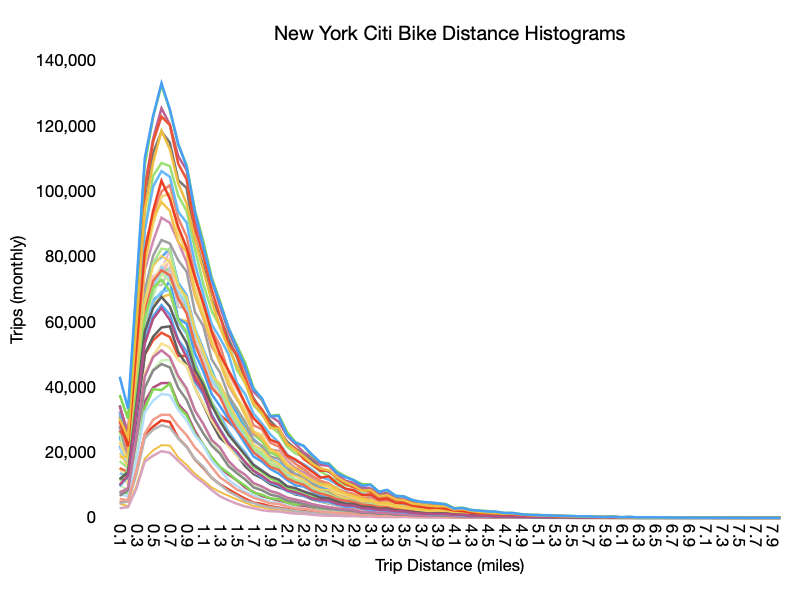
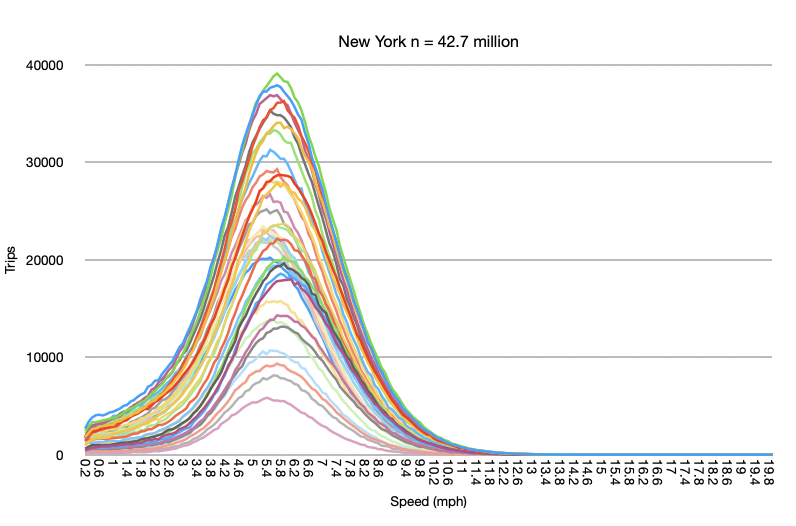
Consider the following diagrams: Trip Distances vs. Trip Speeds for New York Citi Bike travelers (n=42.7 million.)
The different lines represent different time periods spanning the months of the year.
The top graph shows that most trips are short, and the average distance is not the most common distance. The bottom graph shows that the average speed is the most common speed. The top graph is very accurately modeled with the log-normal function. The bottom graph is the classic bell curve of the normal or Gaussian function.
Income is log-normally distributed and so it has to be with services revenues. There must be a definite skew where there is a disproportionate spend by those who have more income. Thus segmenting or, to put it less kindly, discriminating customers properly is super important. Customer quality is just as important, perhaps more so, than quantity.
So let's revisit the question of user quality for online services.
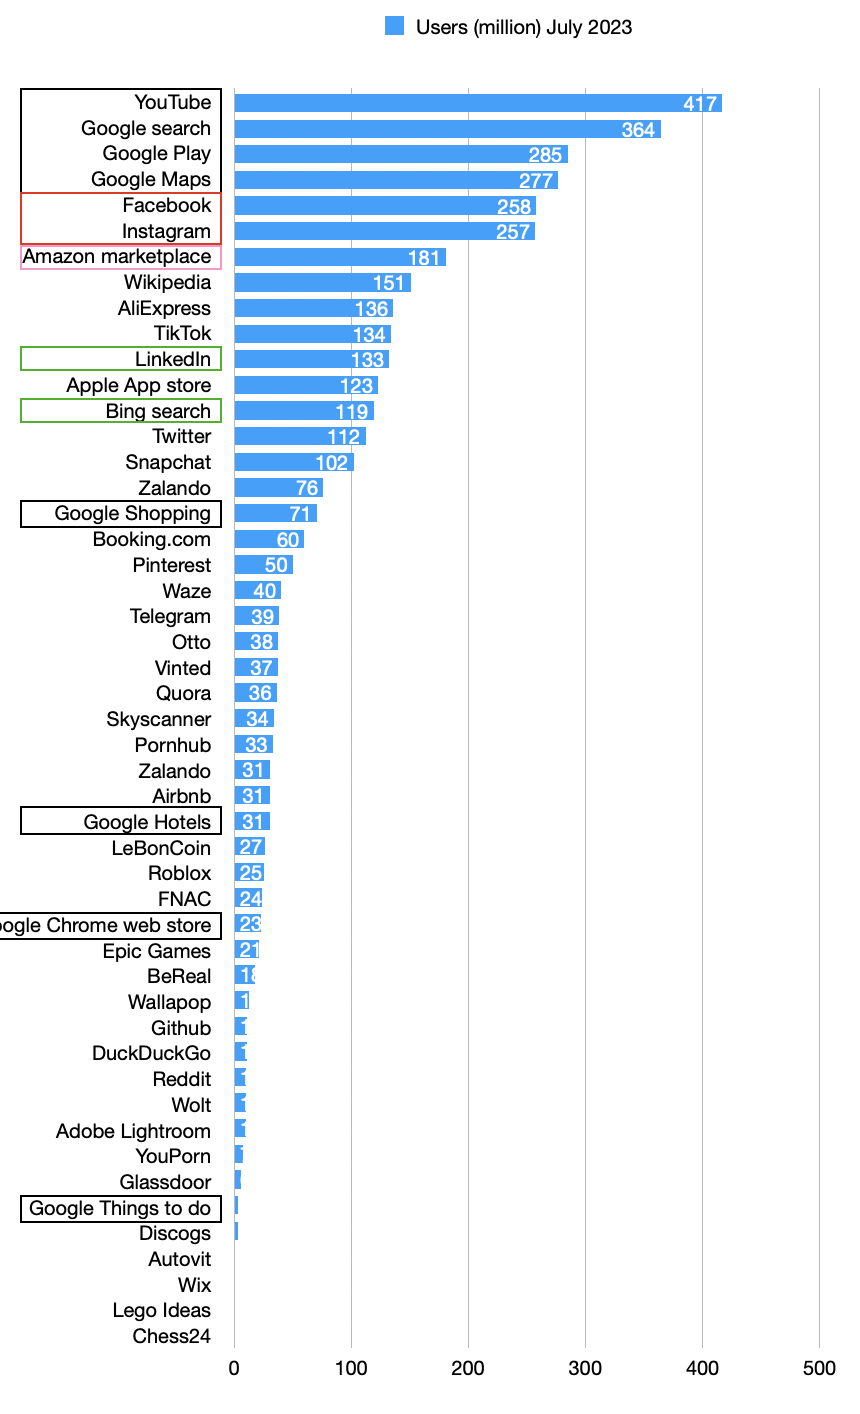
Unlike 10 years ago, there is a lot more data. The EU, for instance requires a report of the number of users on each platform.
The figures I want to focus on are those of Apple App Store and Google Play Store: 123 million and 284.6 million respectively. These are strikingly similar to the ratio of 2x between iOS and Android from my old anecdotes. However, if we look at global data, Apple claims 650 million active App Store users while Google claims 2.5 billion active users. That makes the global ratio closer to 4x Android. However, if we look at the US, the ratio is 167 million iPhone users vs. 144 million Android. In the US, iOS is a majority.
This is explained by income. The wealthier the user base the more iOS seems to be in use.
Now let's look at revenues for the platform stores.
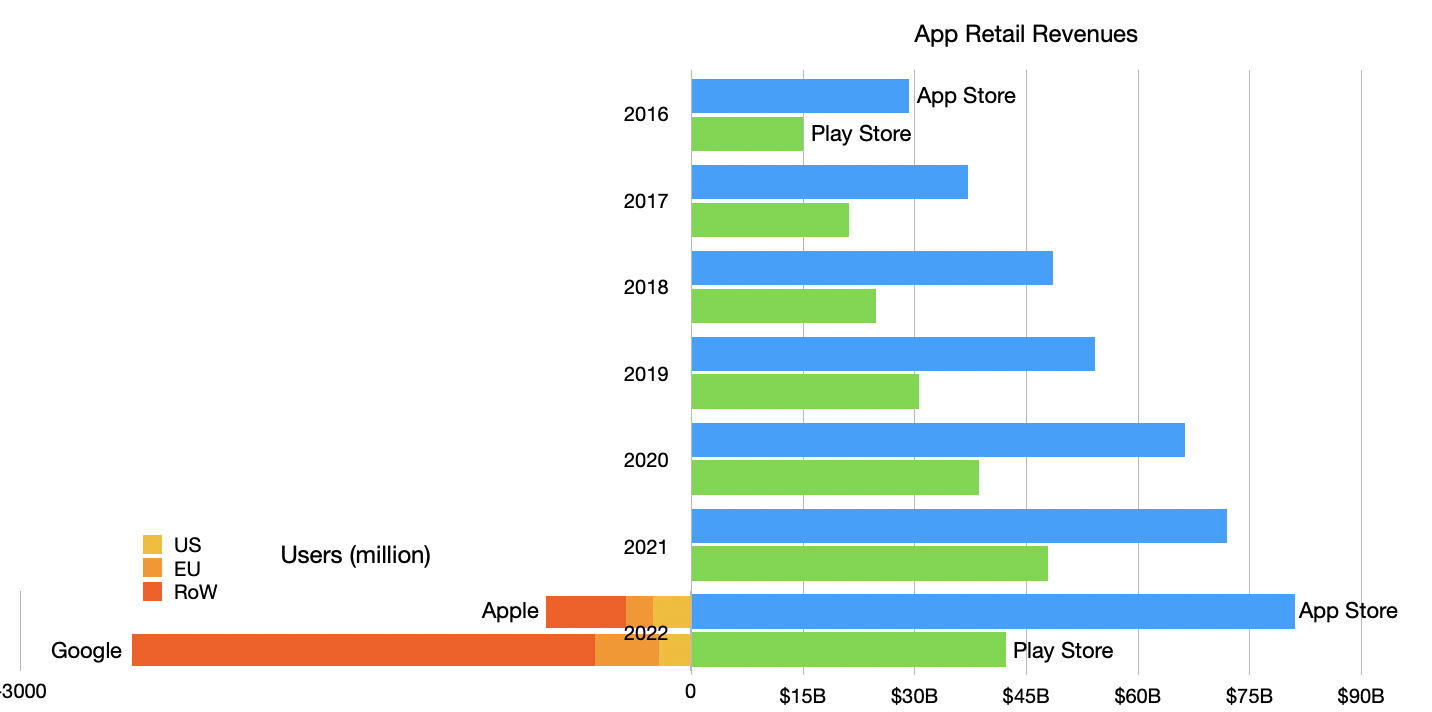
On the right side is the history of retail revenues by year from 2016 to 2022 and split between Apple App Store and Google Play Store. Mirrored on the left is the number of users, also split by store but also by region, but only for 2022. [App Store revenues are my own analysis (with validation against other sources) and include billings not just Apple's own cut. Play Store revenues are from Business of Apps.]
The ratio between revenues has kept remarkably steady, with 2016 revenues at a Apple:Google ratio of 29:15 (1.93) and 2022 at a ratio of 81:42 (1.93).
The global user numbers are, as mentioned, 3.8 to 1.
[Aside: One sanity check on the data is that the 650 million App Store users is about half of my estimate of iPhones in use (1.2 billion). That might be alarming. Why are only 54% of iPhones in use paired with App Store use? However, if we take the sum of both App Store and Play store users (3.15 billion) and compare it with the total number of global smartphone users (6.92 billion), we discover that 45.5% of all smartphone users use some store. Adding Chinese Android stores we can see that the ratio of 54% for iOS is somewhat consistent.]
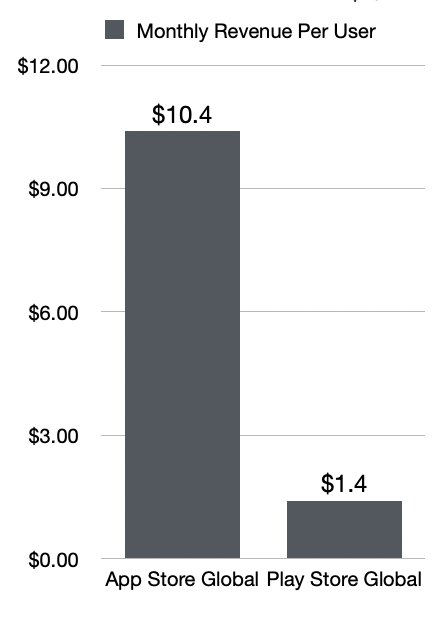
Thus we can compare the app revenue per user of the two platforms by dividing global revenue number by the global user numbers. The results are shown below:
I scaled the spending to a per-month basis.
So the picture becomes clearer. The iPhone customer is 7.4 times more valuable than the Android customer. This is more impressive than the 4x rule I had 10 years ago. The reasons are mainly that my anecdotes were from developers who sold products in the US or EU whereas expansion of smartphones to 7 billion global users has drawn in more lower spending customers.
But Apple's base has also grown to over 1 billion users (650 million store users). This highlights that Apple has effectively grown and discriminated customers effectively. It obtained not just 1 billion customers but the best 1 billion customers.
How to discriminate effectively is the holy grail of marketing. The naïve approach is to keep prices high. But that usually only results in a "luxury" branding and a small base that tends not to grow. The alternative "premium" approach is to offer functionality and multiple tiers and distribution options and financing and merchandising. There is no simple formula.
The bottom line is that Apple's approach is attracting 650 million $10/month app spenders. When we factor in additional subscription services, we get to the juggernaut that is Apple Services. This analysis has shown how difficult it is for anyone to come close to this quality of revenue.
As we look forward to Spatial Computing, the idea of increasing that spend from $10/month for a small glass rectangle in your palm to perhaps $100/month for an immersive 360-degree 3D experience does not sound too crazy.
But only if you can find those customers. I suspect Apple already knows who they are.
If you want to learn more and hear an in-depth discussion on this topic make sure you subscribe to the Asymetric Podcast on Supercast and Apple Podcasts.
The App Store ecosystem crossed $1 Trillion in 2022.
To be precise, in a report published in May 2023 by the Analysis Group the ecosystem is estimated to have exceeded $1.1 trillion. This ecosystem is defined as the total transactional value of the sale or distribution of digital and physical goods and services through apps. It also includes in-app advertising. The analysts relied on a variety of data sources, including data from Apple, app analytics companies, market research firms, and individual companies.
Note that this includes Apple's own services as well as App Store developers. Unlike Apple's own reporting of payments to developers (and thus partially revealing its own App Store revenues) this data includes payments which are not captured by Apple directly. In the words of the authors, "More than 90% of this figure originated from transactions that did not happen through the App Store, meaning that these amounts accrued solely to developers and other third parties, and that Apple collected no commission on them."
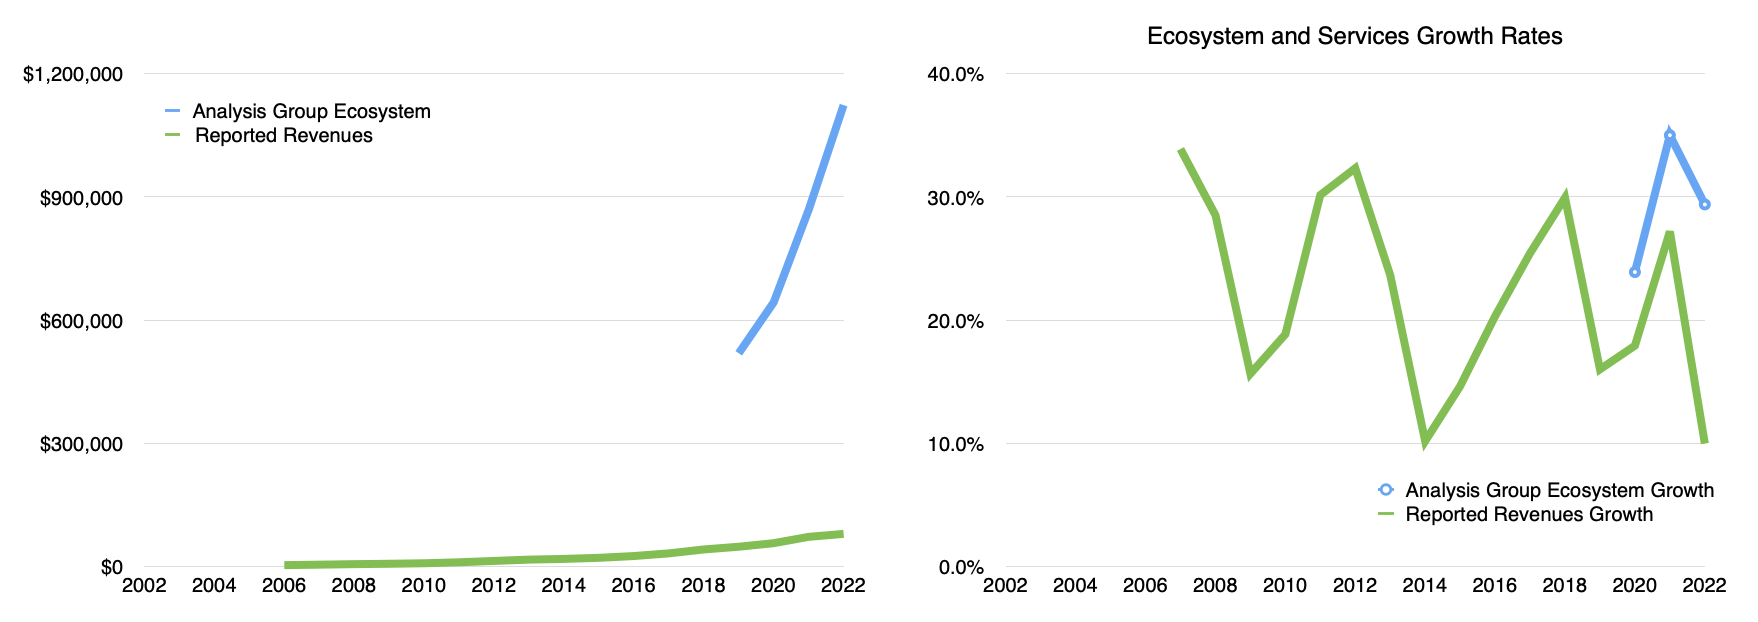
This $1.1 trillion figure is almost double the value from 2019. Ecosystem estimates were first provided in 2019 at $519 billion, with $643 billion in 2020, $868 billion in 2021 and $1,123 billion in 2023. These correspond to growth rates of 24% in 2020, 35% in 2021 and 29% in 2022. The compound growth rate has been 29.4% since 2019.
It would be ambitious to expect this CAGR to continue after the Covid boom but at the same time, it's worth noting that this growth out-paces Apple's own services growth rate. Services (reported) revenues grew at 18%, 27% and 10%. The actual figures and growth rates are shown below.
This Analysis Group report is very much worth reading and adds an important new metric of resilience and scope and scale of the platform and ecosystem that Apple has created.
However it is also not the complete picture. I strive to see the larger picture of what I call the Apple Economy. This includes the ecosystem as well as the direct revenues Apple obtains from products and services. [Of these revenues, roughly 60% is then passed on to Apple's suppliers, with less than 20% retained as earnings].
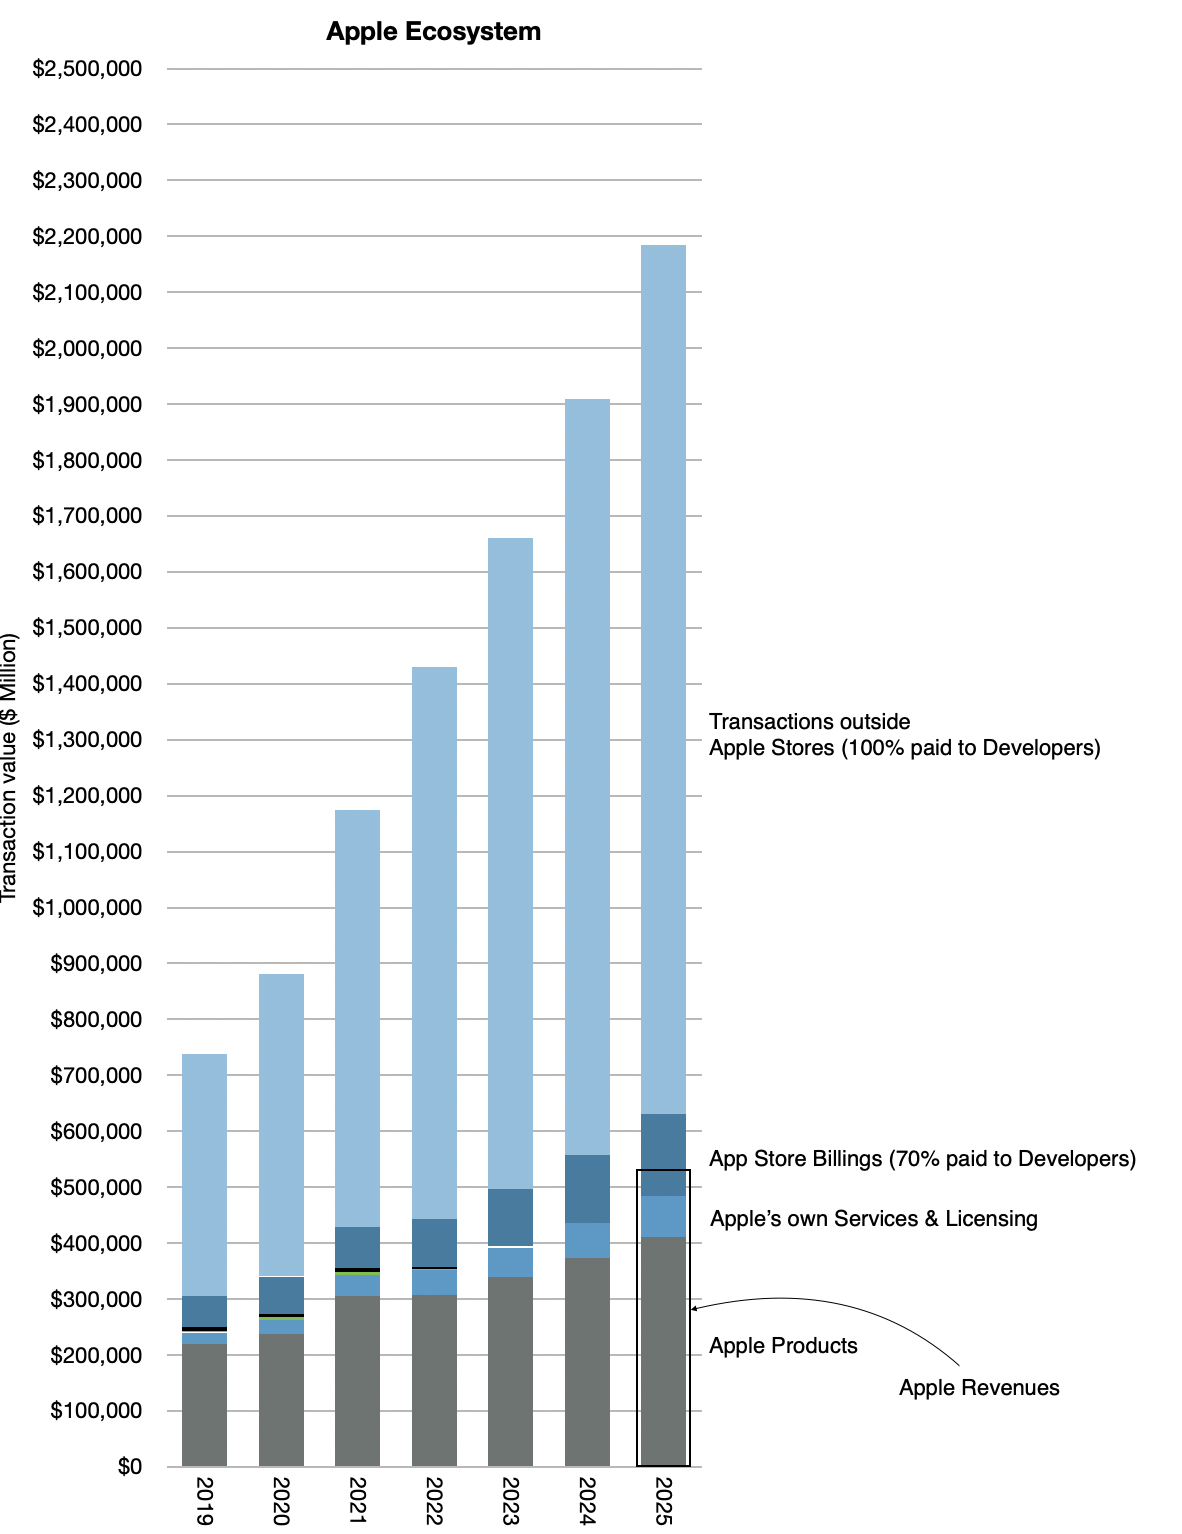
Therefore, the combination of ecosystem and revenues is shown in the following diagram.
Note that the "Economy" size was over $1.4 trillion when the ecosystem alone was $1.1 trillion. Note also that I'm also suggesting that it's likely to be $1.6 Trillion this year. This diagram shows the story since 2019 but also makes a forecast to 2025.
I'm expecting the ecosystem to grow more modestly at 18% in 2023 (down from 29%) and 16% in 2024 and 15% in 2025. Apple's own product and services sales are also subject to estimation error.
Nevertheless, it's not unreasonable to believe the forecast above where the Apple Economy expands to over $2 Trillion by 2025. This is an acceleration from previous forecasts.
It's difficult to write about the implications of this. Any value in the trillions is hard to put in context. Certainly, Apple's market capitalization is in the trillions. For fun, we can calculate that Apple is trading at a multiple of 1.74 of its economy.
But rather than trying to assess valuation directly, Apple's Economy is more like a GDP figure: I think it's helps to understand the overall scale and resilience. You might even ask what would happen if it were to cease to exist. The number of people who are employed in a $2 trillion economy is in the millions; perhaps 10s of millions of people.
In 2023, global GDP is expected to reach $105 trillion. It's nice to think that Apple could soon be about 2% of the world.
The data is finally out. Apple Services and perhaps Apple itself can be quantified and predicted as never before. As we shall see this data changes almost everything we know.
It is even more shocking that this most important data set has been released by Apple itself. (Though it did so in order to comply with regulation, Apple did offer a bit more detail than was required.)
What the data shows is the number of average monthly active recipients in the EU of Apple-provided data services, calculated as an average over the period of the six months to 31 July 2023. This number is 123 million.
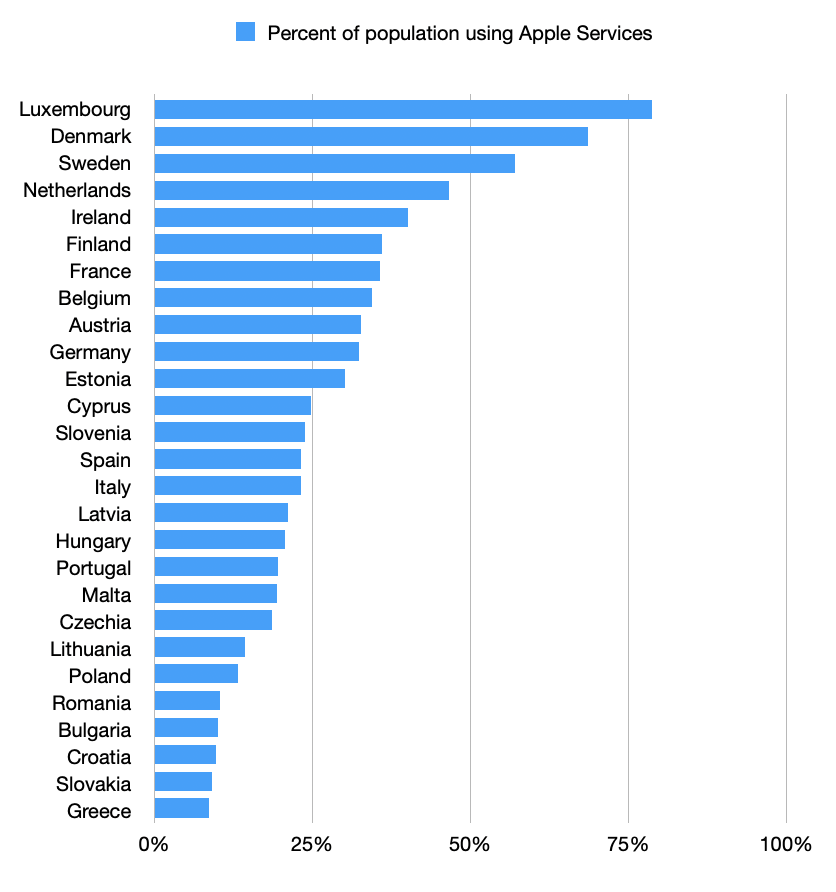
In addition, if you follow the link, you can see the number of recipients broken down by Member States. I summarize this data below.
Note that my summary is not that of the absolute numbers of recipients but the percent of population that these numbers represent. Note further that for some of the states with less than 1 million total recipients, estimates had to be generated. These were done in order to complete a total of 123 million. You'll have to trust me that these estimates make sense.
This release of data might be amusing for the ranking we obtain, showing which countries' citizens are more likely Apple fans than others. Seeing, for example, that the nordic countries show more affinity for Apple than the balkans; whatever that implies.
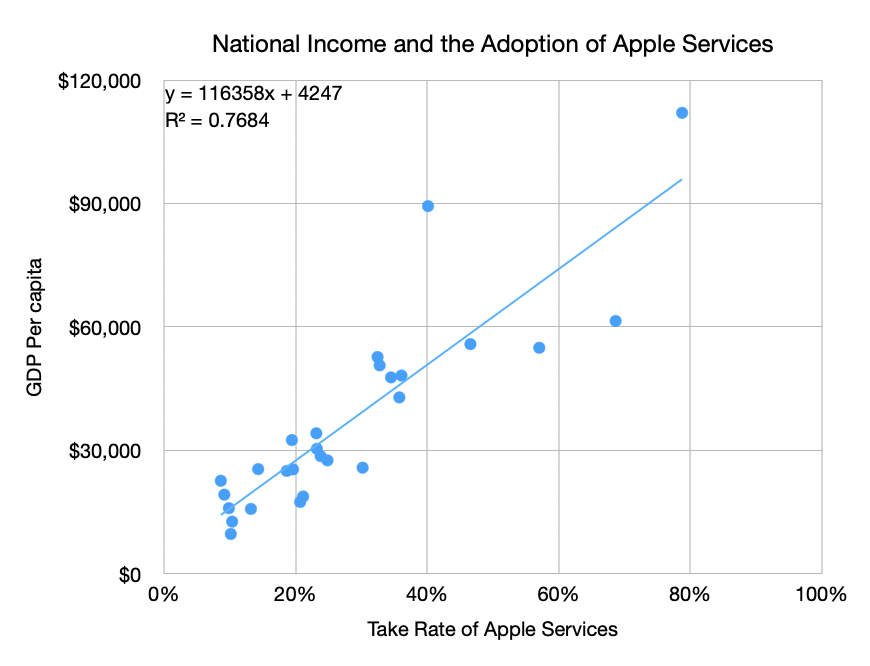
But a geographic categorization is banal. What would be more interesting is to look for a proxy for Apple adoption that is predictive. I know what you're thinking: it's obvious, look at income. More precisely GDP per capita. The data yields the following.
Please keep in mind that some countries might have missing or outdated data, and the values presented here are based on information available up to 2021. Note that there is one outlier. That data point around $90,000 and 40% adoption is Ireland. It's an outlier because the GDP income for Ireland includes the large number of multinational firms based there. That includes Apple, Facebook, Google and LinkedIn, etc. which pull GDP above what would be assumed by GNP.
With Ireland the data fits with the coefficient r-squared of 0.77. Without Ireland it's 0.85. This seems good enough to me to estimate the relationship of Apple Adoption ~= (National Income - 4247)/116,358. The trend line in the graph above shows this relationship.
What are the implications?
First, the ends of the line need to be finessed. 100% Apple Adoption is suggested at income of $116,358/yr/capita. Also, 0% Apple Adoption happens below an income of $4,247/yr/capita. Now both of these are problematic as there are known adopters in countries with income below $4,247/yr (more about this later) and there are countries with income above $116,358 which cannot therefore have more than 100% adoption (or can they? This makes a good trivia question.)
These anomalies should encourage us to look further. What if we apply this formula for countries outside the EU? To answer this, I generated a country set with about 190 entries and applied the pattern seen within the EU country set (n = 27.)
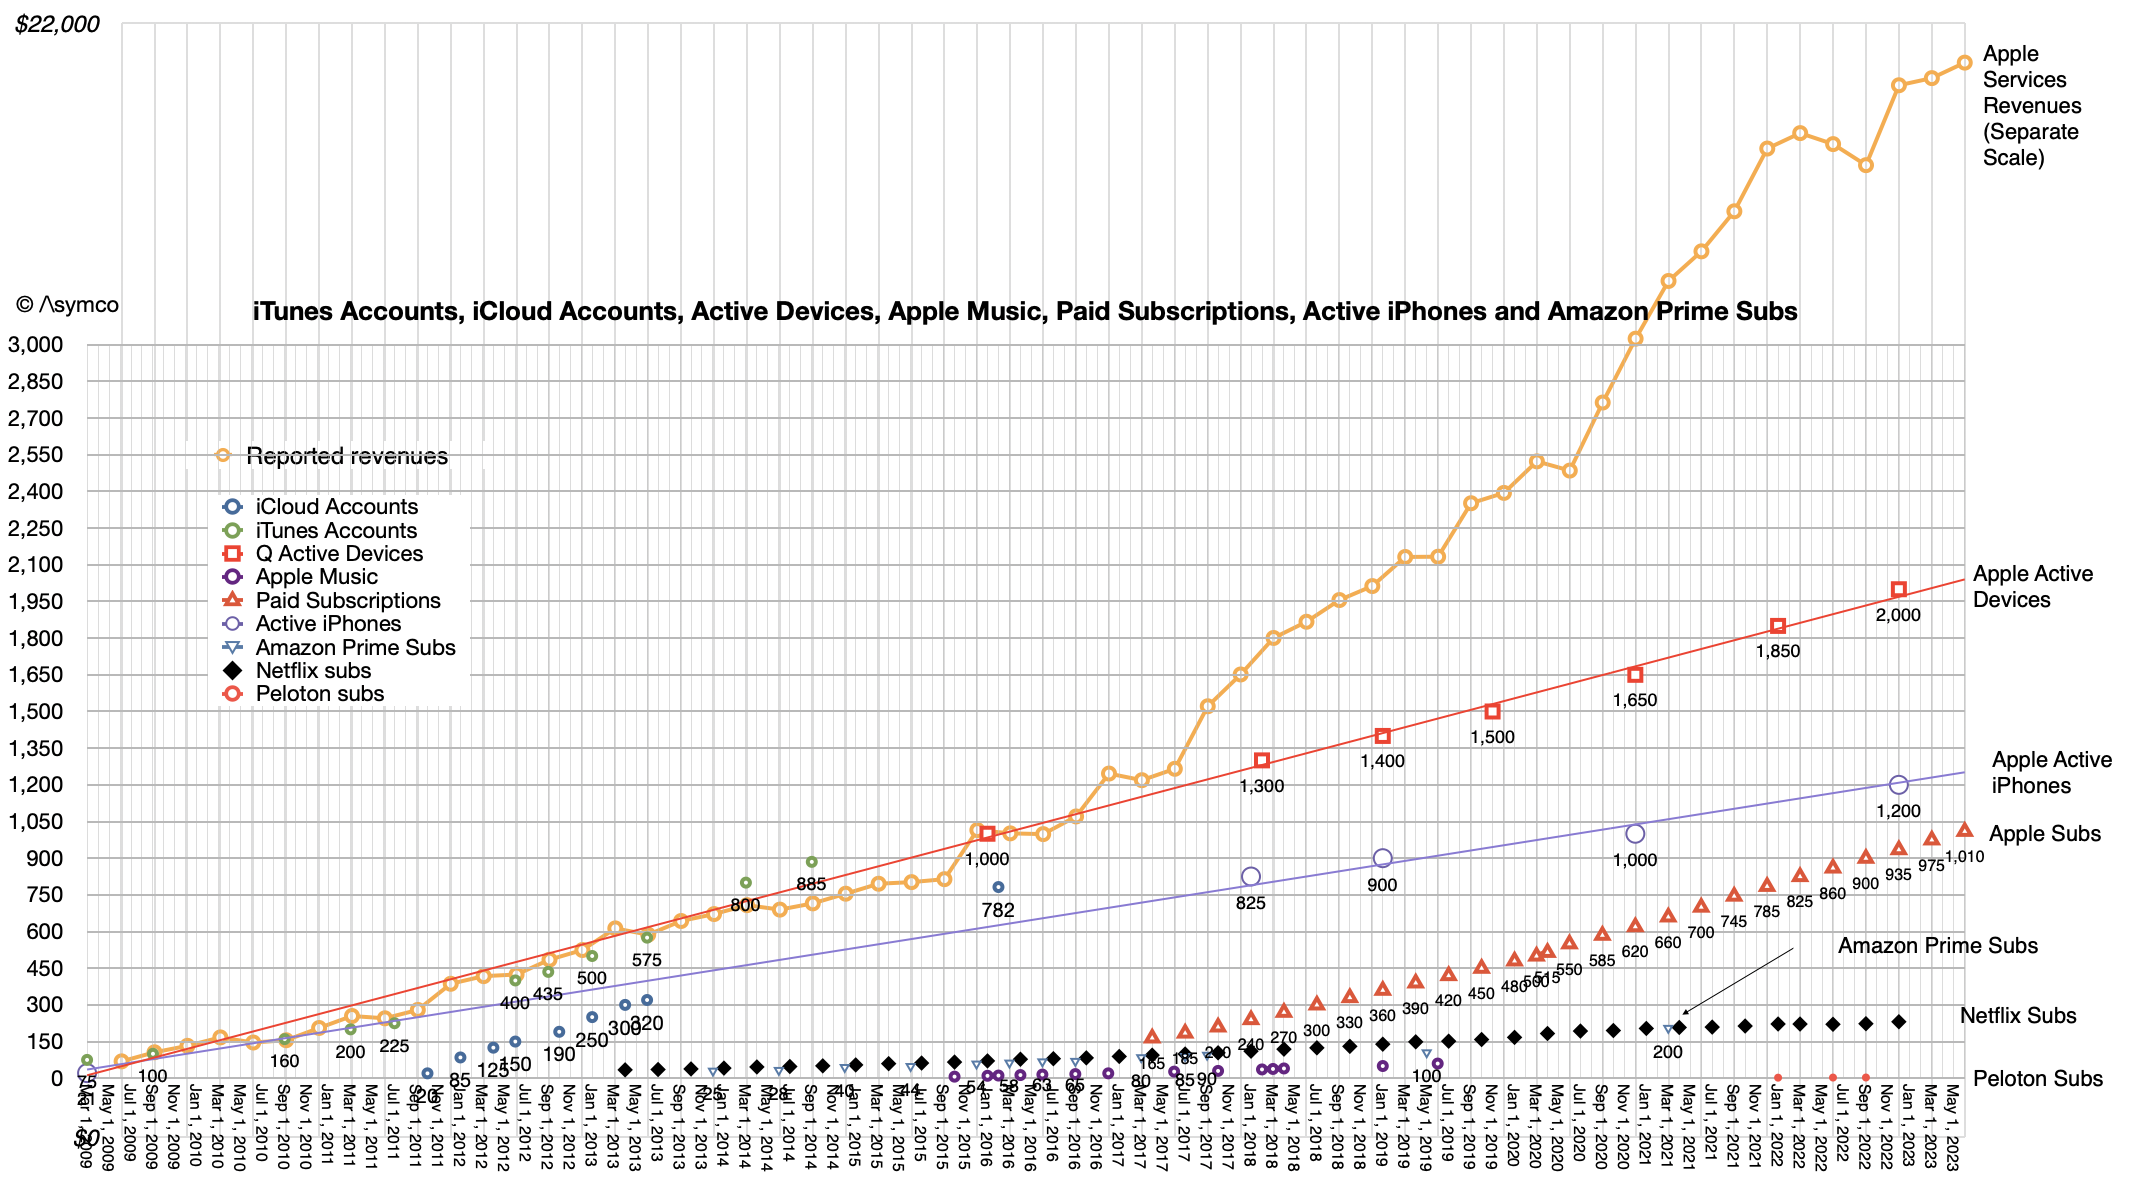
Knowing the GDP per capita for all countries as well as population size, we can estimate the global total of Apple services subscribers to be 560 million individuals. Note that Apple reports 1,010 million total subscriptions but that includes multiple subscriptions per subscriber and subscriptions to services which for Apple only acts as guarantor through the Apple App Store. Overall data on Apple Subscriptions (and other details) is provided below:
Note that we know the total active devices to be over 2 billion and the active iPhones to be about 1.2 billion. This implies that about half of iPhone users have an Apple-owned subscription and that over half of the subscriptions Apple manages are for its own services.
What's more, we can obtain a detailed list of expected Apple Services users for each country. An example would be 5.8 million users in Mexico or 1.7 million in New Zealand. [I could furnish this on a country-level in a newsletter, if anybody is interested please let me know.]
It also allows us to understand the potential for countries which currently are below the model's threshold of income. That list consists of 88 countries with a combined population of over 4 billion. They will join the Apple ecosystem, it's only a matter of time. Can we predict this? I believe so. Stay tuned.
The story of Apple Services is only getting more important but also more detailed in terms of data and analysis. Readers of this blog have been well prepared for what happened and Apple has followed through with gross margin data and now with some limited country-level data.
As we move into the era of spatial computing, services will only matter more and it's imperative that observers of the company stay on top of the data with solid modeling.
The last quarter of 2020 was a remarkable quarter for Apple. Every line in the income statement increased by double digits. Net sales up 21%, iPhone sales up 17%, Mac sales up 21%, iPad up 41%, Services up 24% and Earnings Per Share up 30%. This had not happened in over 10 years. The last time being the first quarter of 2010.
Take a look at the table below which color-codes each line based on the rate of growth. The darker the green the faster the growth (blue being above 100%).
A shockingly good performance is made all the more remarkable by its happening in a time of uncertainty. The company has refused (rightly) to issue guidance as long as a pandemic is raging world-wide. The disruptions in supply chains, demand and changes in behaviors due to new limitations on mobility and interactions between people are unprecedented and consequences are still to be estimated.
The growth surely, you say, is precisely because of this disruption. The "work and study from home" and lockdowns have forced people to buy more technology. Phones, Laptops, tablets are not just tools but lifelines for a society denied other forms of contact.
But this was not at all obvious at the beginning of the crisis. The months leading to pandemic caused the share prices of most equities to fall, and tech was not immune. Apple's shares fell in March 2020 to $57/share. I heard comments suggesting that Apple would collapse as a business with unemployment reaching 25% and nobody willing to pay for luxuries like iPhones.
The crisis has proven that technology is not a luxury but a necessity, and technology that works better is far more valuable than technology that works barely. Spending on better machines has increased.
Some of that is of course helped by stimulus programs but growth was not only in countries which gave out cash. The growth for Apple was in all regions of the world, breaking new records even in poorer countries.
Far more likely, the economic fuel for Apple's growth came from disposable income being unspent on other high-ticket items like dining, vacations and entertainment. Much cash sloshing around the economy surely ended up in an Apple cash register.
But this is all old news. The question into 2021 is what will this year look like. The first quarter already ended and the data is dribbling in: Apple has 1 billion customers, 88% of US teens have an iPhone, 70% have AirPods, China is growing at crazy rates, Foxconn reporting 40% growth, production of next generation iPhone chips starting early (May), etc.
There does not seem to be a let-up in growth, despite some component shortages postponing some non-iPhone product introductions. Apple's cautious comments 3 months ago are probably moot now.
We are providing some directional insights assuming that COVID-related impacts of our business do not worsen from our current assumptions for the quarter. For total company revenue, we believe growth will accelerate on a year-over-year basis and in aggregate, follow typical seasonality on a sequential basis.
At the product category level, keep in mind two items: First, during the March quarter last year, we saw elevated activity in our digital services as lockdowns occurred around the world, so our services business faces a tougher year-over-year comparison; second, we believe the year-over-year growth in the Wearables, Home and Accessories category will decelerate compared to Q1.
As you know, we were chasing demand on AirPods last year as we expanded channel inventory from Q1 to Q2. This year, we plan to decrease AirPods channel inventory as is typical after the holiday quarter. We expect gross margin to be similar to the December quarter.
We expect opex to be between $10.7 billion and $10.9 billion. We expect OI&E to be up around $50 million and our tax rate to be around 17%.
Luca Maestri
Given this, I am tentatively projecting top line growth of 15% (vs. 1% a year ago and 21% last quarter) and EPS growth of 11% (vs. 3.8% year ago and 25.6% last quarter.) A goldilocks quarter.
As a rule, I don't like to make a forecast for Apple's performance during quarters where there is no guidance. There is a good reason why there is no guidance. The management does not feel confident that there is enough information to make a reasonable prediction. Keep in mind that the management has very detailed, very frequent updates on their business metrics.
Anyone who has run a business knows that signals of performance are abundant and one can only imagine how many signals arrive at Apple HQ from the 1.5 billion active devices, tens of thousands of points of sale, and a vast network of resellers. There are also billions of interactions in services. Then there are search queries, store visitor counts (online and physical), developer payments, app downloads, content downloads, subscriptions. All this information is collected and analyzed on (probably) a daily basis.
Also when guidance is given, it's usually a month into the next quarter. The company will have already seen about a third of the quarter already pass before they predict the next two thirds.
This last quarter in particular was even more difficult given the delays in launching the new iPhones and the dynamics related to the broader portfolio.
And yet, the company feels that they can issue some "insights on our expectations". Here is what was said about three months ago:
These directional comments assume that COVID-related impacts to our business in November and December are similar to what we've seen in October. […] [W]e expect iPhone revenue to grow during the December quarter despite shipping iPhone 12 and 12 Pro 4 weeks into the quarter and iPhone 12 mini and 12 Pro Max 7 weeks into the quarter.
We expect all other products in aggregate to grow double digits, and we also expect services to continue to grow double digits. For gross margin, we expect it to be similar to our most recent quarters despite the costs associated with the launch of several new products. For opex, we expect to be between $10.7 billion and $10.8 billion. We expect OI&E to be around $50 million and the tax rate to be around 16%.
Luca Maestri, Chief Financial Officer
So, given this information and some hints from IDC, Gartner and CIRP and China I'm willing to offer some estimates:
iPhone Revenue: $63.9 billion
Mac Revenue: $9.3 billion
iPad: $7.4 billion
Services: $15.1 billion
Wearables & Home: $12 billion
Net sales: $107.8 billion
Gross margin percent: 37.7%
EPS: $1.48 (Growth: 19%)
Of course, this is very speculative and I don't have a lot of confidence in it. If anything it may be on the high side.
I don't expect there to be guidance for the next quarter with a resumption of guidance only after the pandemic has largely subsided (probably Q3 of this year.)
The Apple product line-up for 2023 is almost completely decided. This is not conjecture but simply an observation of the lead times for developing the types of products that Apple offers. The integration of hardware, software and services, often cited as the key to Apple's sustainable competitive advantage, has a great cost: the time required to develop in an integrated fashion is far longer than the time required to develop in a modular fashion.
2.5 years is not a long time. The development process on truly new products could take 4 to 5 years. Apple Silicon, new Operating Systems and new services could all take longer than 2.5 years. The products we just saw launch this year were planned and engineered at least 2 years ago. The more integrated, the more time is needed. Wearables, AI/ML and process engineering are additional examples of long arcs of development needed to reach products.
This does not mean we can predict what these products will be. We don't have visibility to the process but Apple management does and they will make decisions now on adjacent dependencies in the business. For example, visible efforts in planning the use of cash, the carbon offsetting, capital expenditures and R&D are all synchronized to the roadmap and hints may be read into this data.
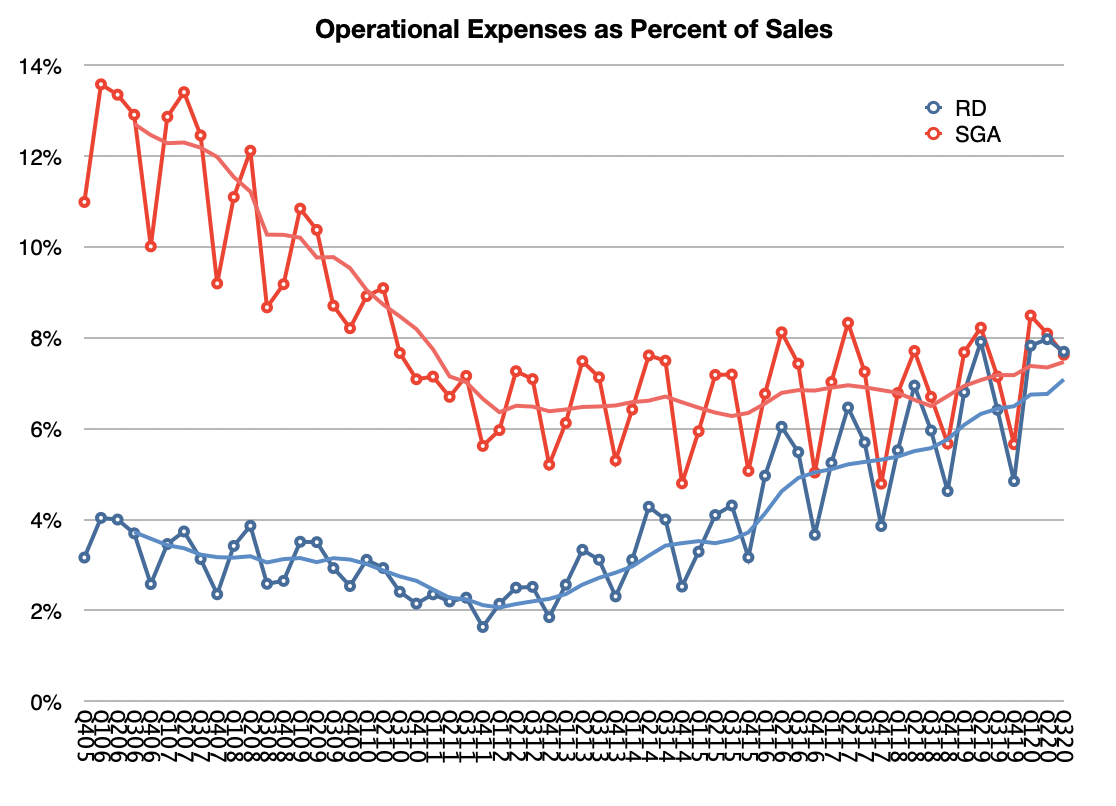
The biggest hints are the R&D spending and the company's capital return program. Combined they show a confidence in the roadmap that is hard to overestimate. First, R&D is reaching new highs of about 7% of sales (on a trailing 12 months' basis, see graph below). This is almost the same as the spending on SG&A which has declined as a percent of sales from above 12% pre-iPhone.
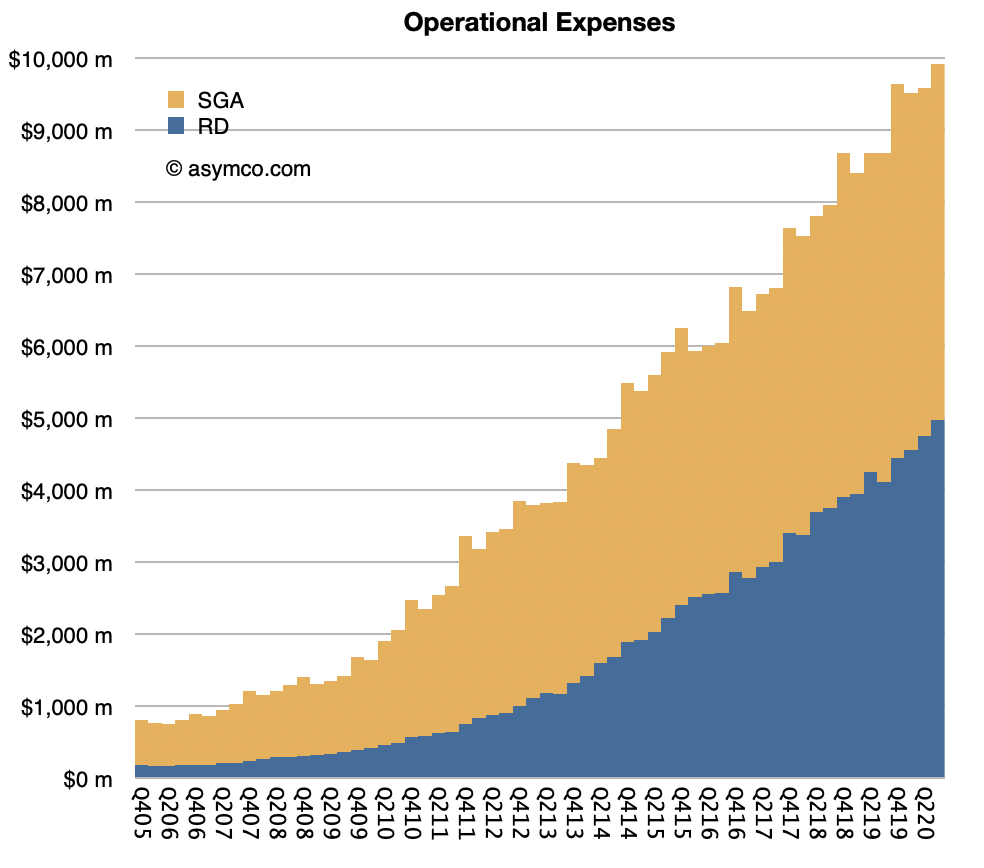
Of course sales have increased significantly over the time shown in the graph below and the absolute spending is shown the following graph. R&D spending is over $5 billion/quarter or about $20 billion/yr. Some of the results of this will be seen in 2023 or beyond.
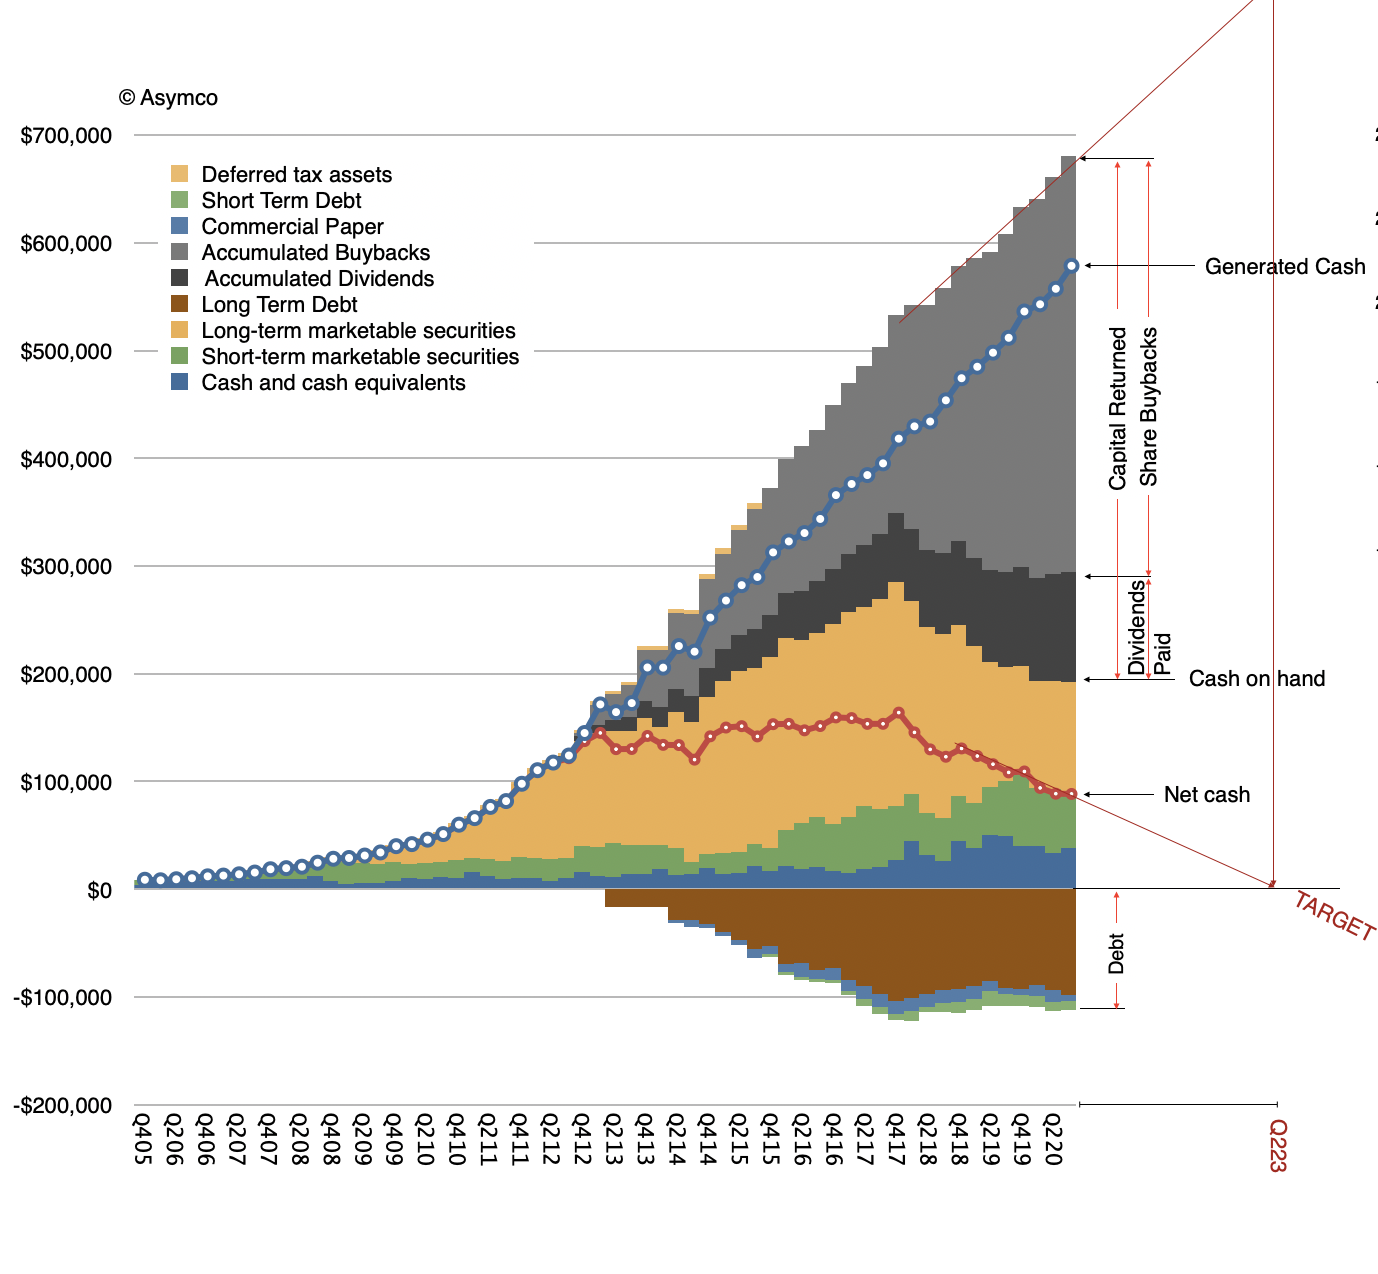
Next, capital returns. The company is returning almost all the cash it generates and is reducing its cash balance. It has returned about half a trillion dollars to date. Dividends paid has reached $100 billion and share buybacks about $400 billion. This is the largest capital return in US history.
The company has declared its intention to reduce net cash to zero. This means it will still have substantial cash due to loans in the form of bonds but no "excess" cash will be held by the company. This is in contrast to the strategy under Steve Jobs where he sought to keep as much cash on hand as possible due to the need to weather potential storms, Tim Cook's Apple is being very "casual" about cash.
Steve Jobs had his reasons for hoarding cash. The company had been through periods of existential crisis. The absence of cash jeopardized its independence and it was something he vowed never to happen again.
However if that strategy would be maintained to this day, as the graph shows, the company would have cash of nearly $700 billion today. It would make Apple the world's largest hedge fund, by far. Second only to a very few sovereign funds. Given a conservative cash preservation mandate it also means that that capital would largely go unrewarded because the return on it would have been minimal, negligible. Not to mention also the target it would paint on the company's balance sheet.
So given the trajectory in net cash being so consistent, it's probable that the goal of net zero will be reached mid 2023.
That leaves the question of what will happen at that time?
The answer is nothing. Nothing will happen. The capital return programs will probably be ended and additional cash generation will be paid as dividends going forward. That's it.
Rather than suggesting a change, the capital return program (and the R&D program) suggest a lack of change, consistency. The company management is anticipating a steady capital generation rate, a steady product roadmap (with predictable growth) and a steady customer base (with predictable loyalty).
This future for Apple in 2023 may seem boring. But that's exactly the plan. This is a plan that the company management has been making for a long time and has been executing for a long time. The plan is to be boring on the business side but exciting on the customer product side.
Consistency has been the characteristic trait of the Tim Cook era. It is a smoothing of seasonality with services. It is the clockwork delivery of product updates, regardless of macro and externalities. It is a growth in user base consistent for a decade.
It is perhaps because more people believe that consistency is the future that we have Apple's P/E ratio now in-line with its peers. Paradoxically, being boring is what makes Apple shares so exciting today.
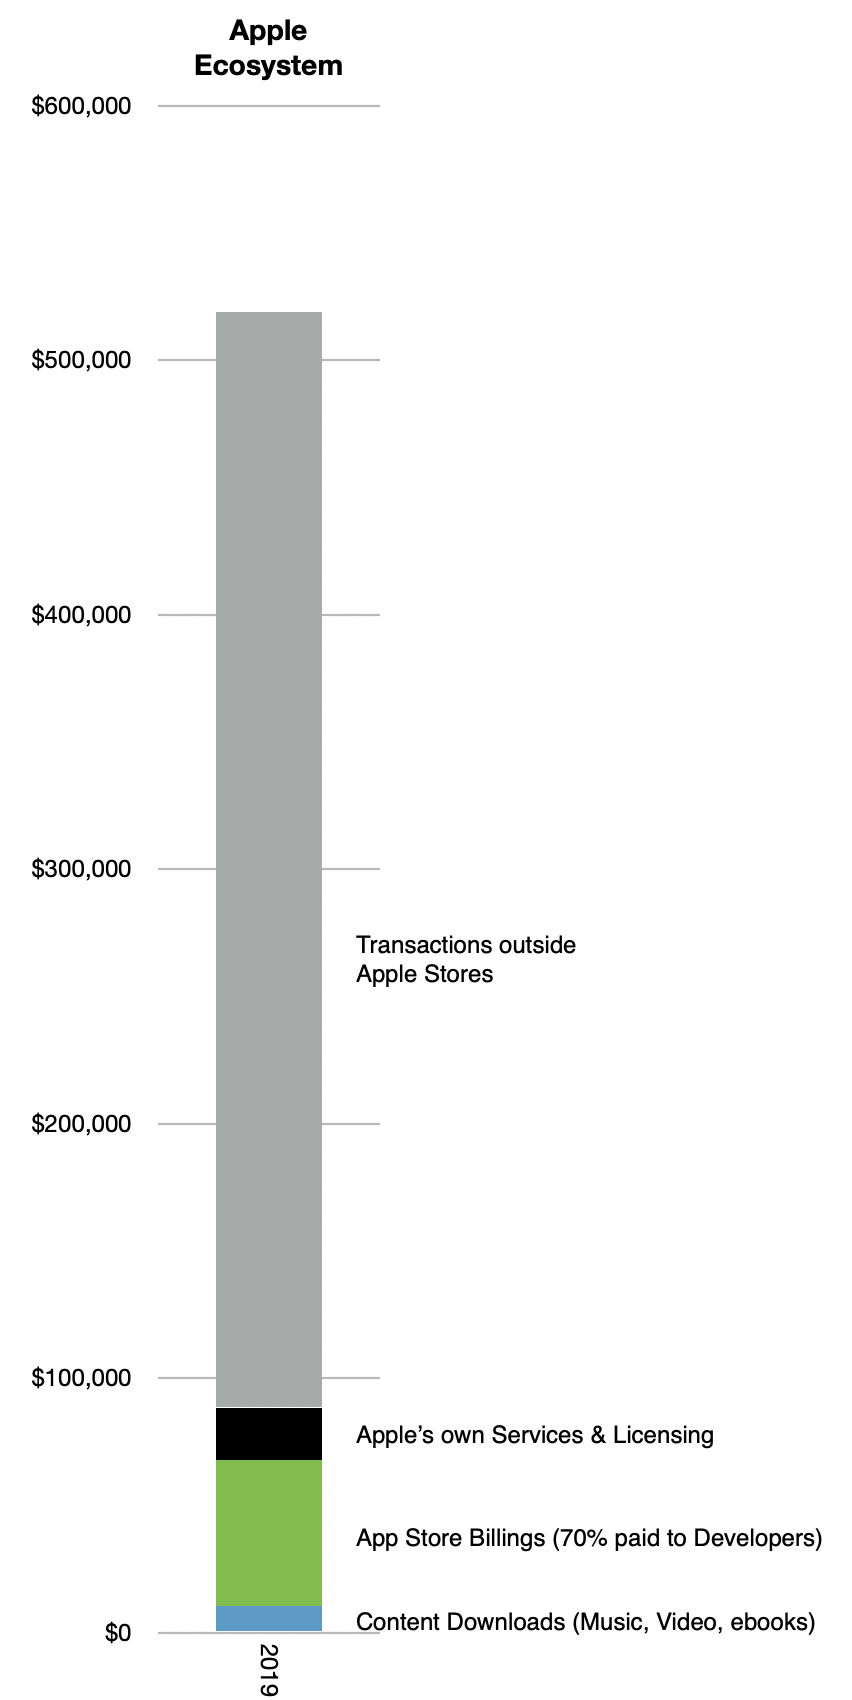
According to one estimate, in 2019 Apple's ecosystem was approximately $519 billion. This includes both transactions that Apple handles, such as paid apps, as well as purchases and other economic activity that happened through apps in which Apple is not involved in the transaction, such as Uber, Bird or Bond rides.
A fraction ($48 billion or 9.3%) of this total is reported as part of Apple's financial statements as "Services Revenues". The rest ($471 billion) is reported on other financial statements, typically businesses which use apps to book sales. These are app revenues are not even accounted as "Payments to Developers" as they are not paid directly to any developer.
The attention to Apple's terms and conditions with developers only apply to transactions in the area shown in green below. The grey area is all outside the App Stores and attracts no attention.
The attention paid to Apple's new services including the "+" brands of TV, News, Arcade, Music and now Fitness and the new bundling thereof refers to the area shown in black above.
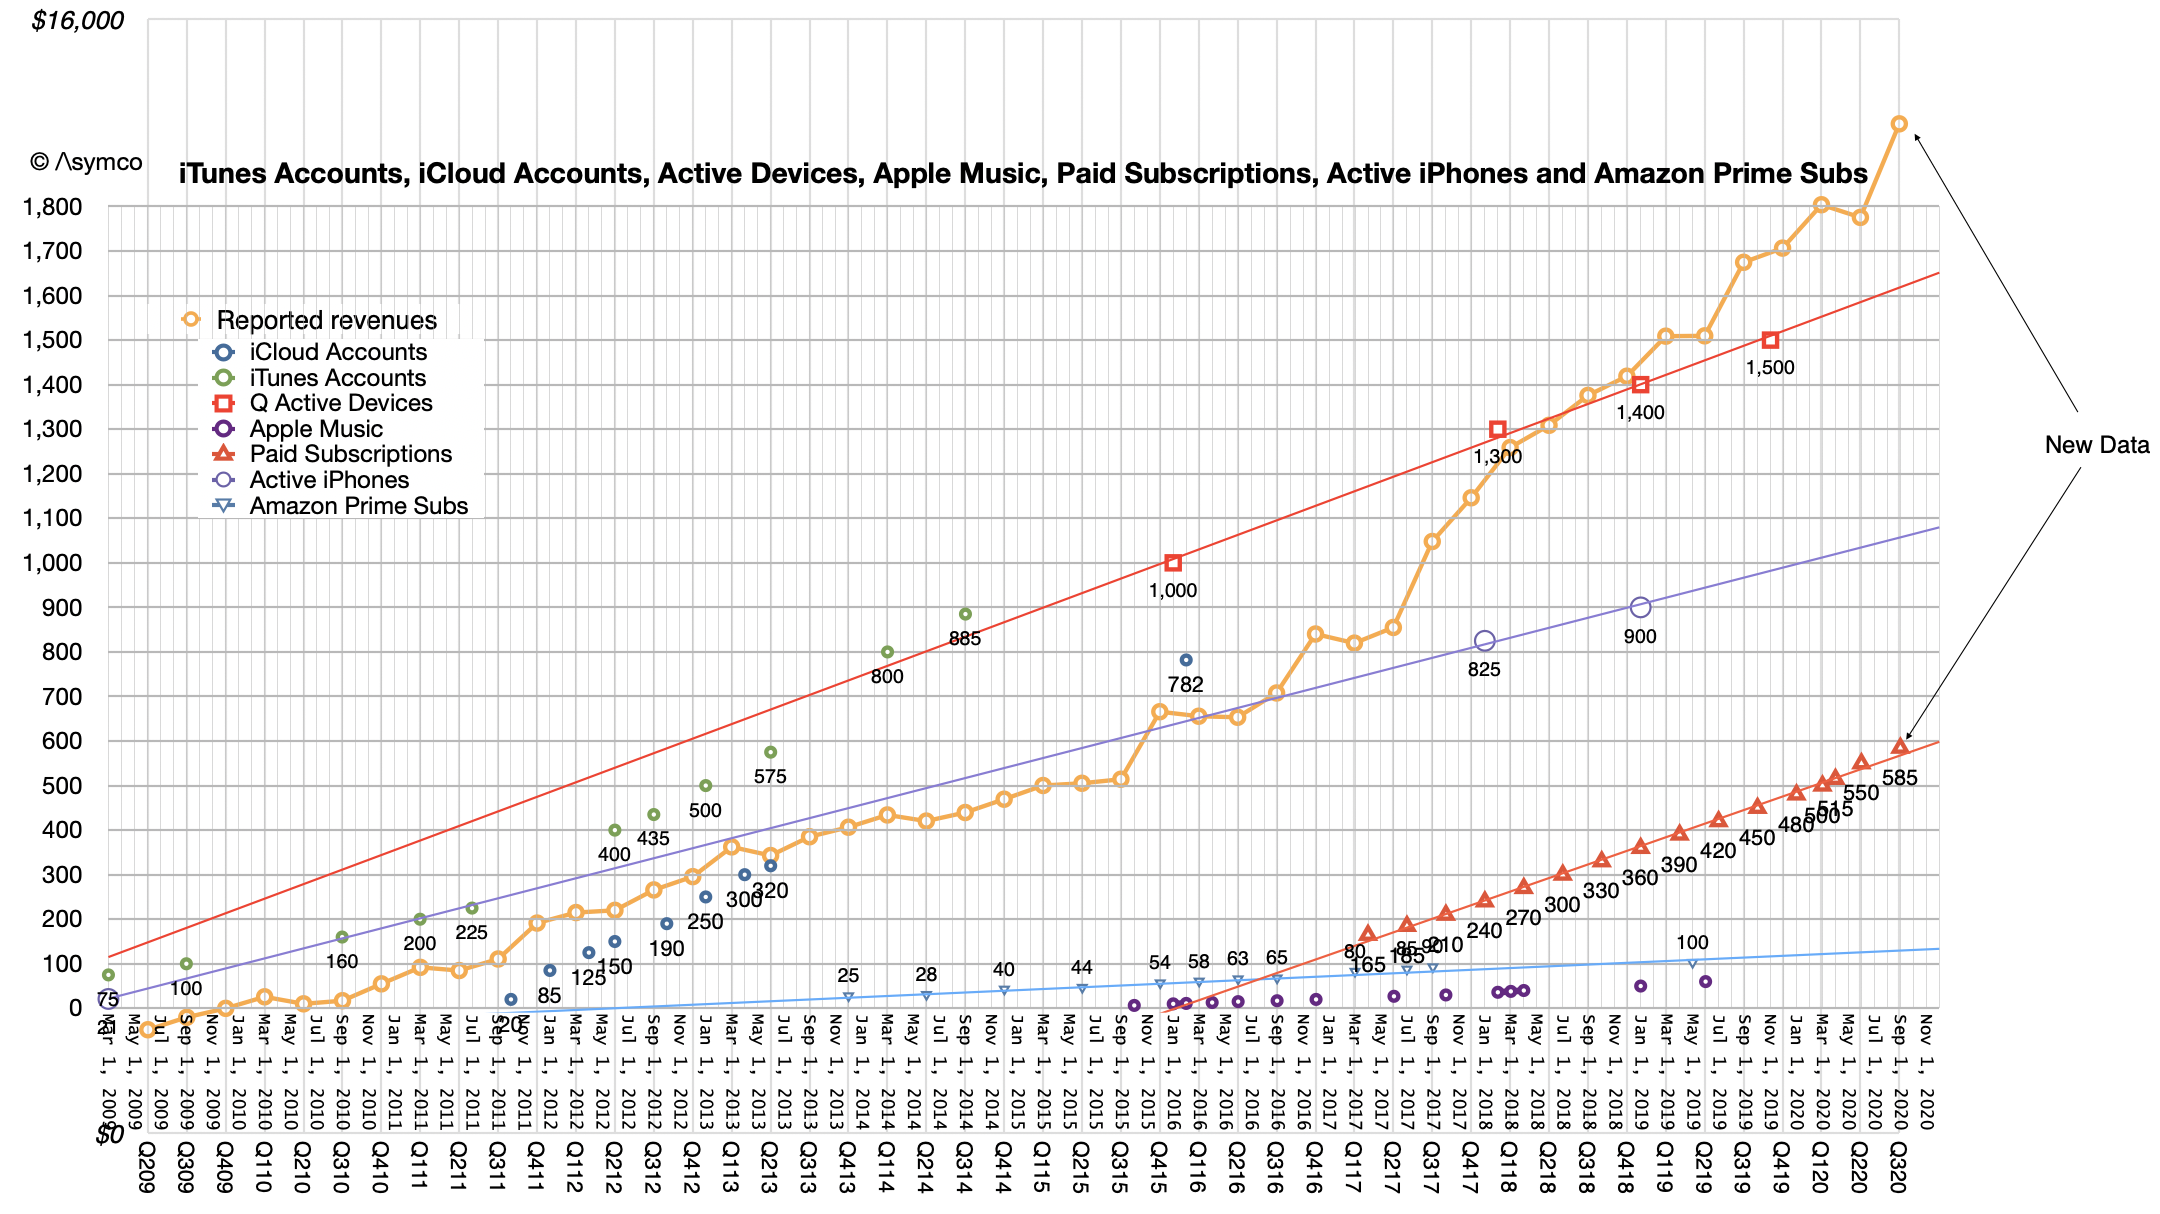
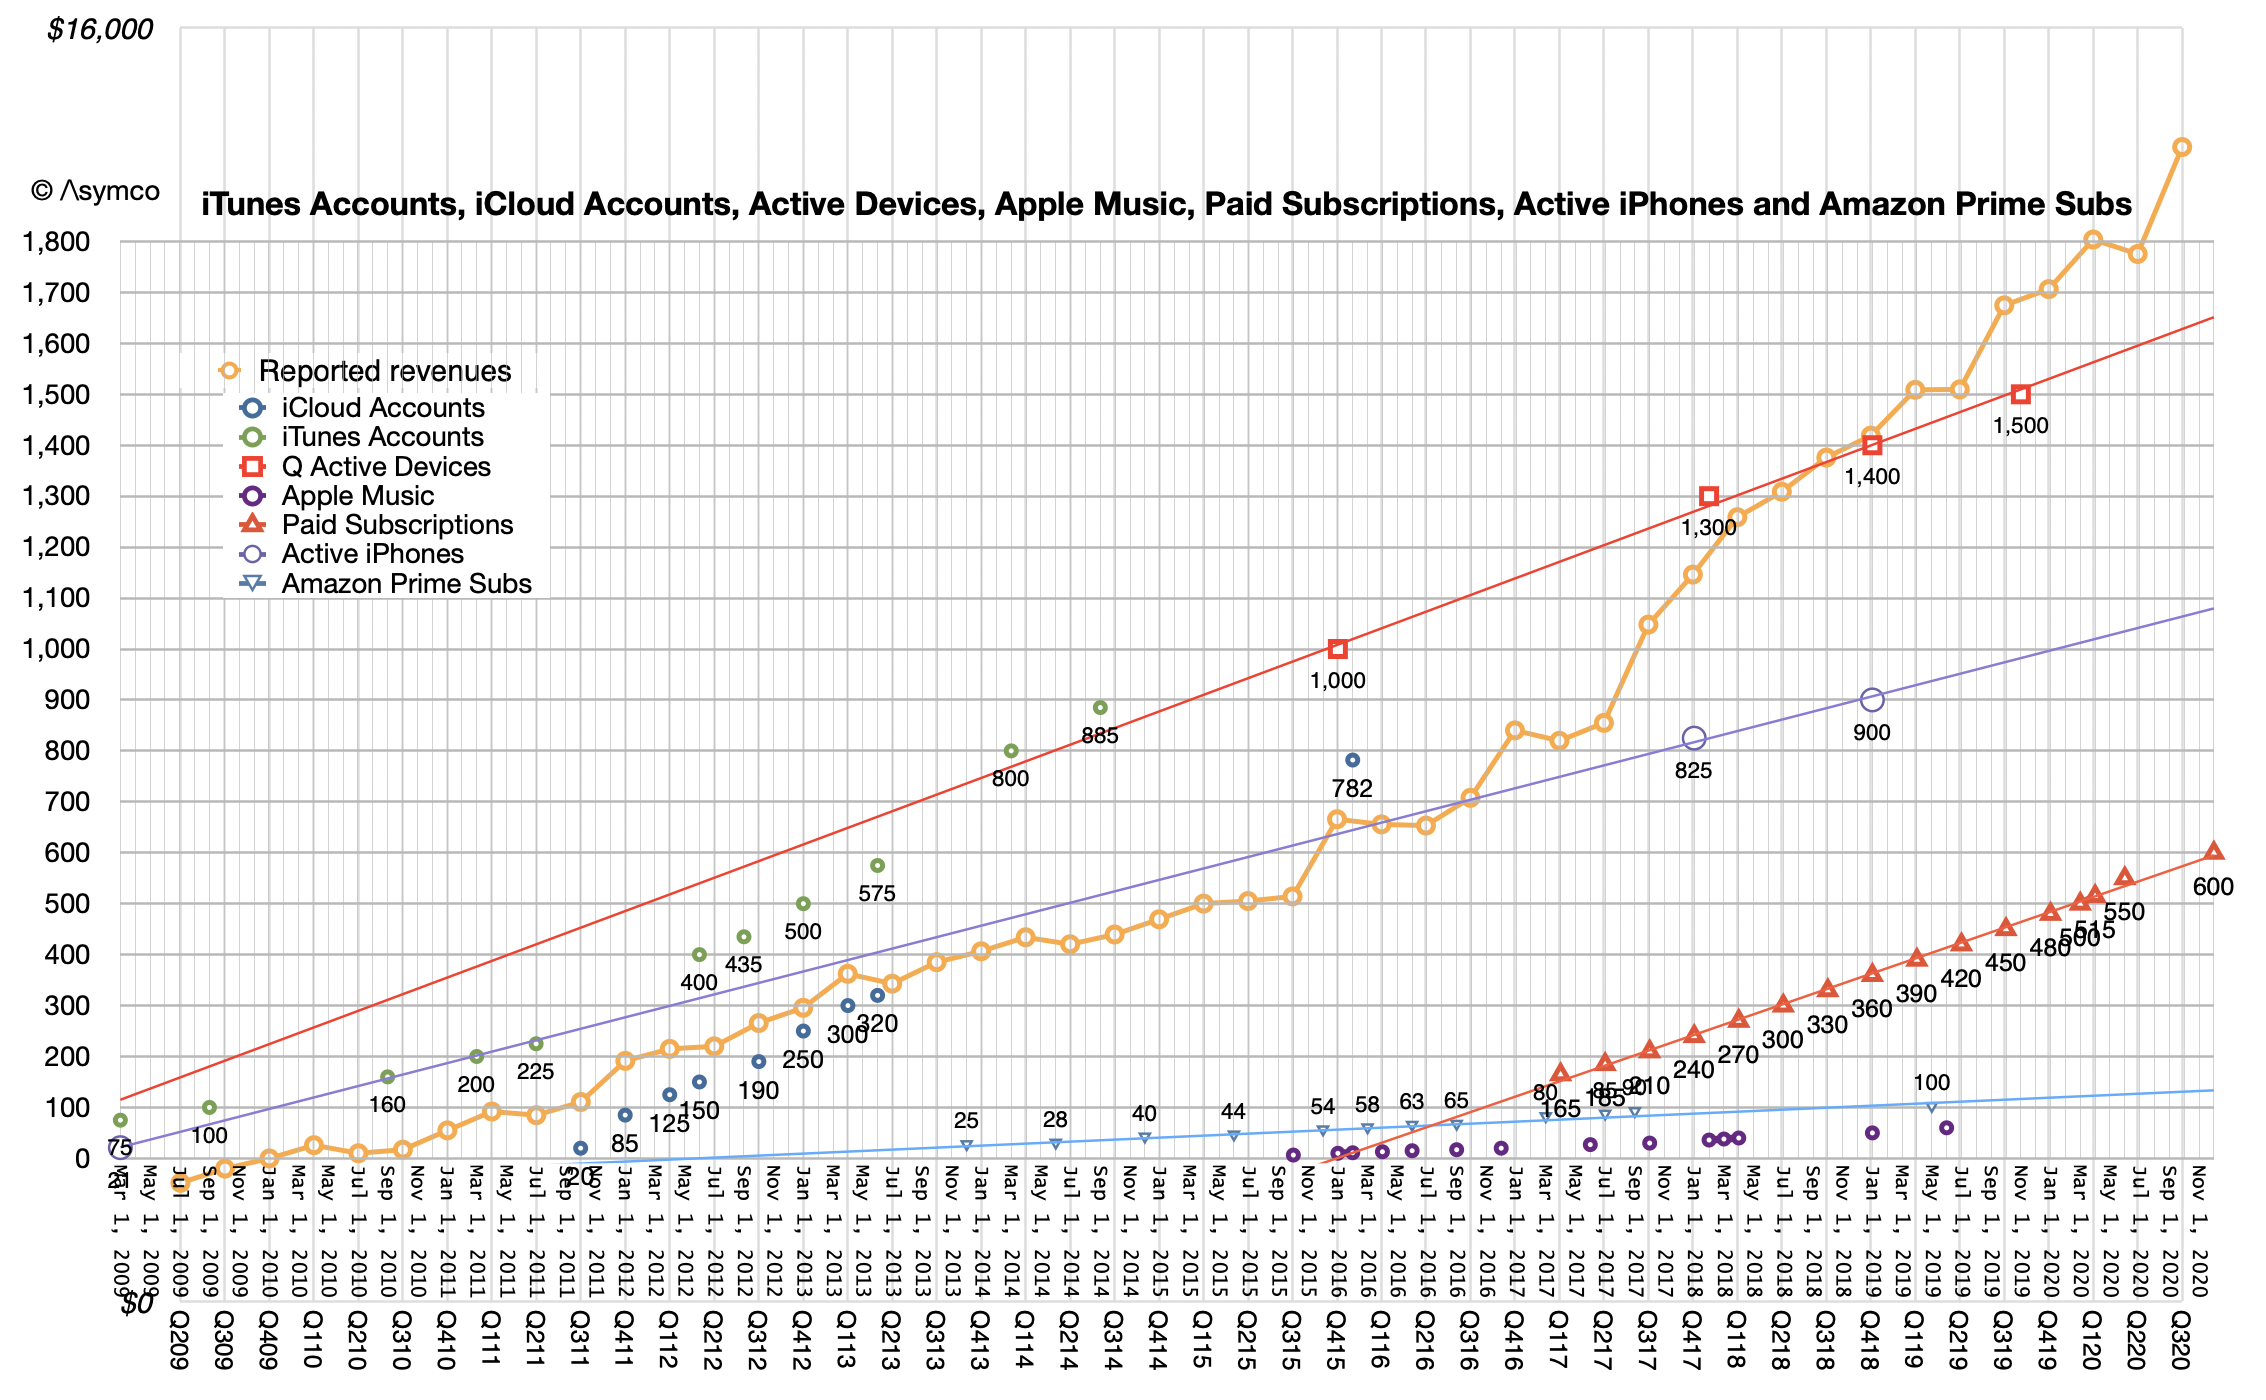
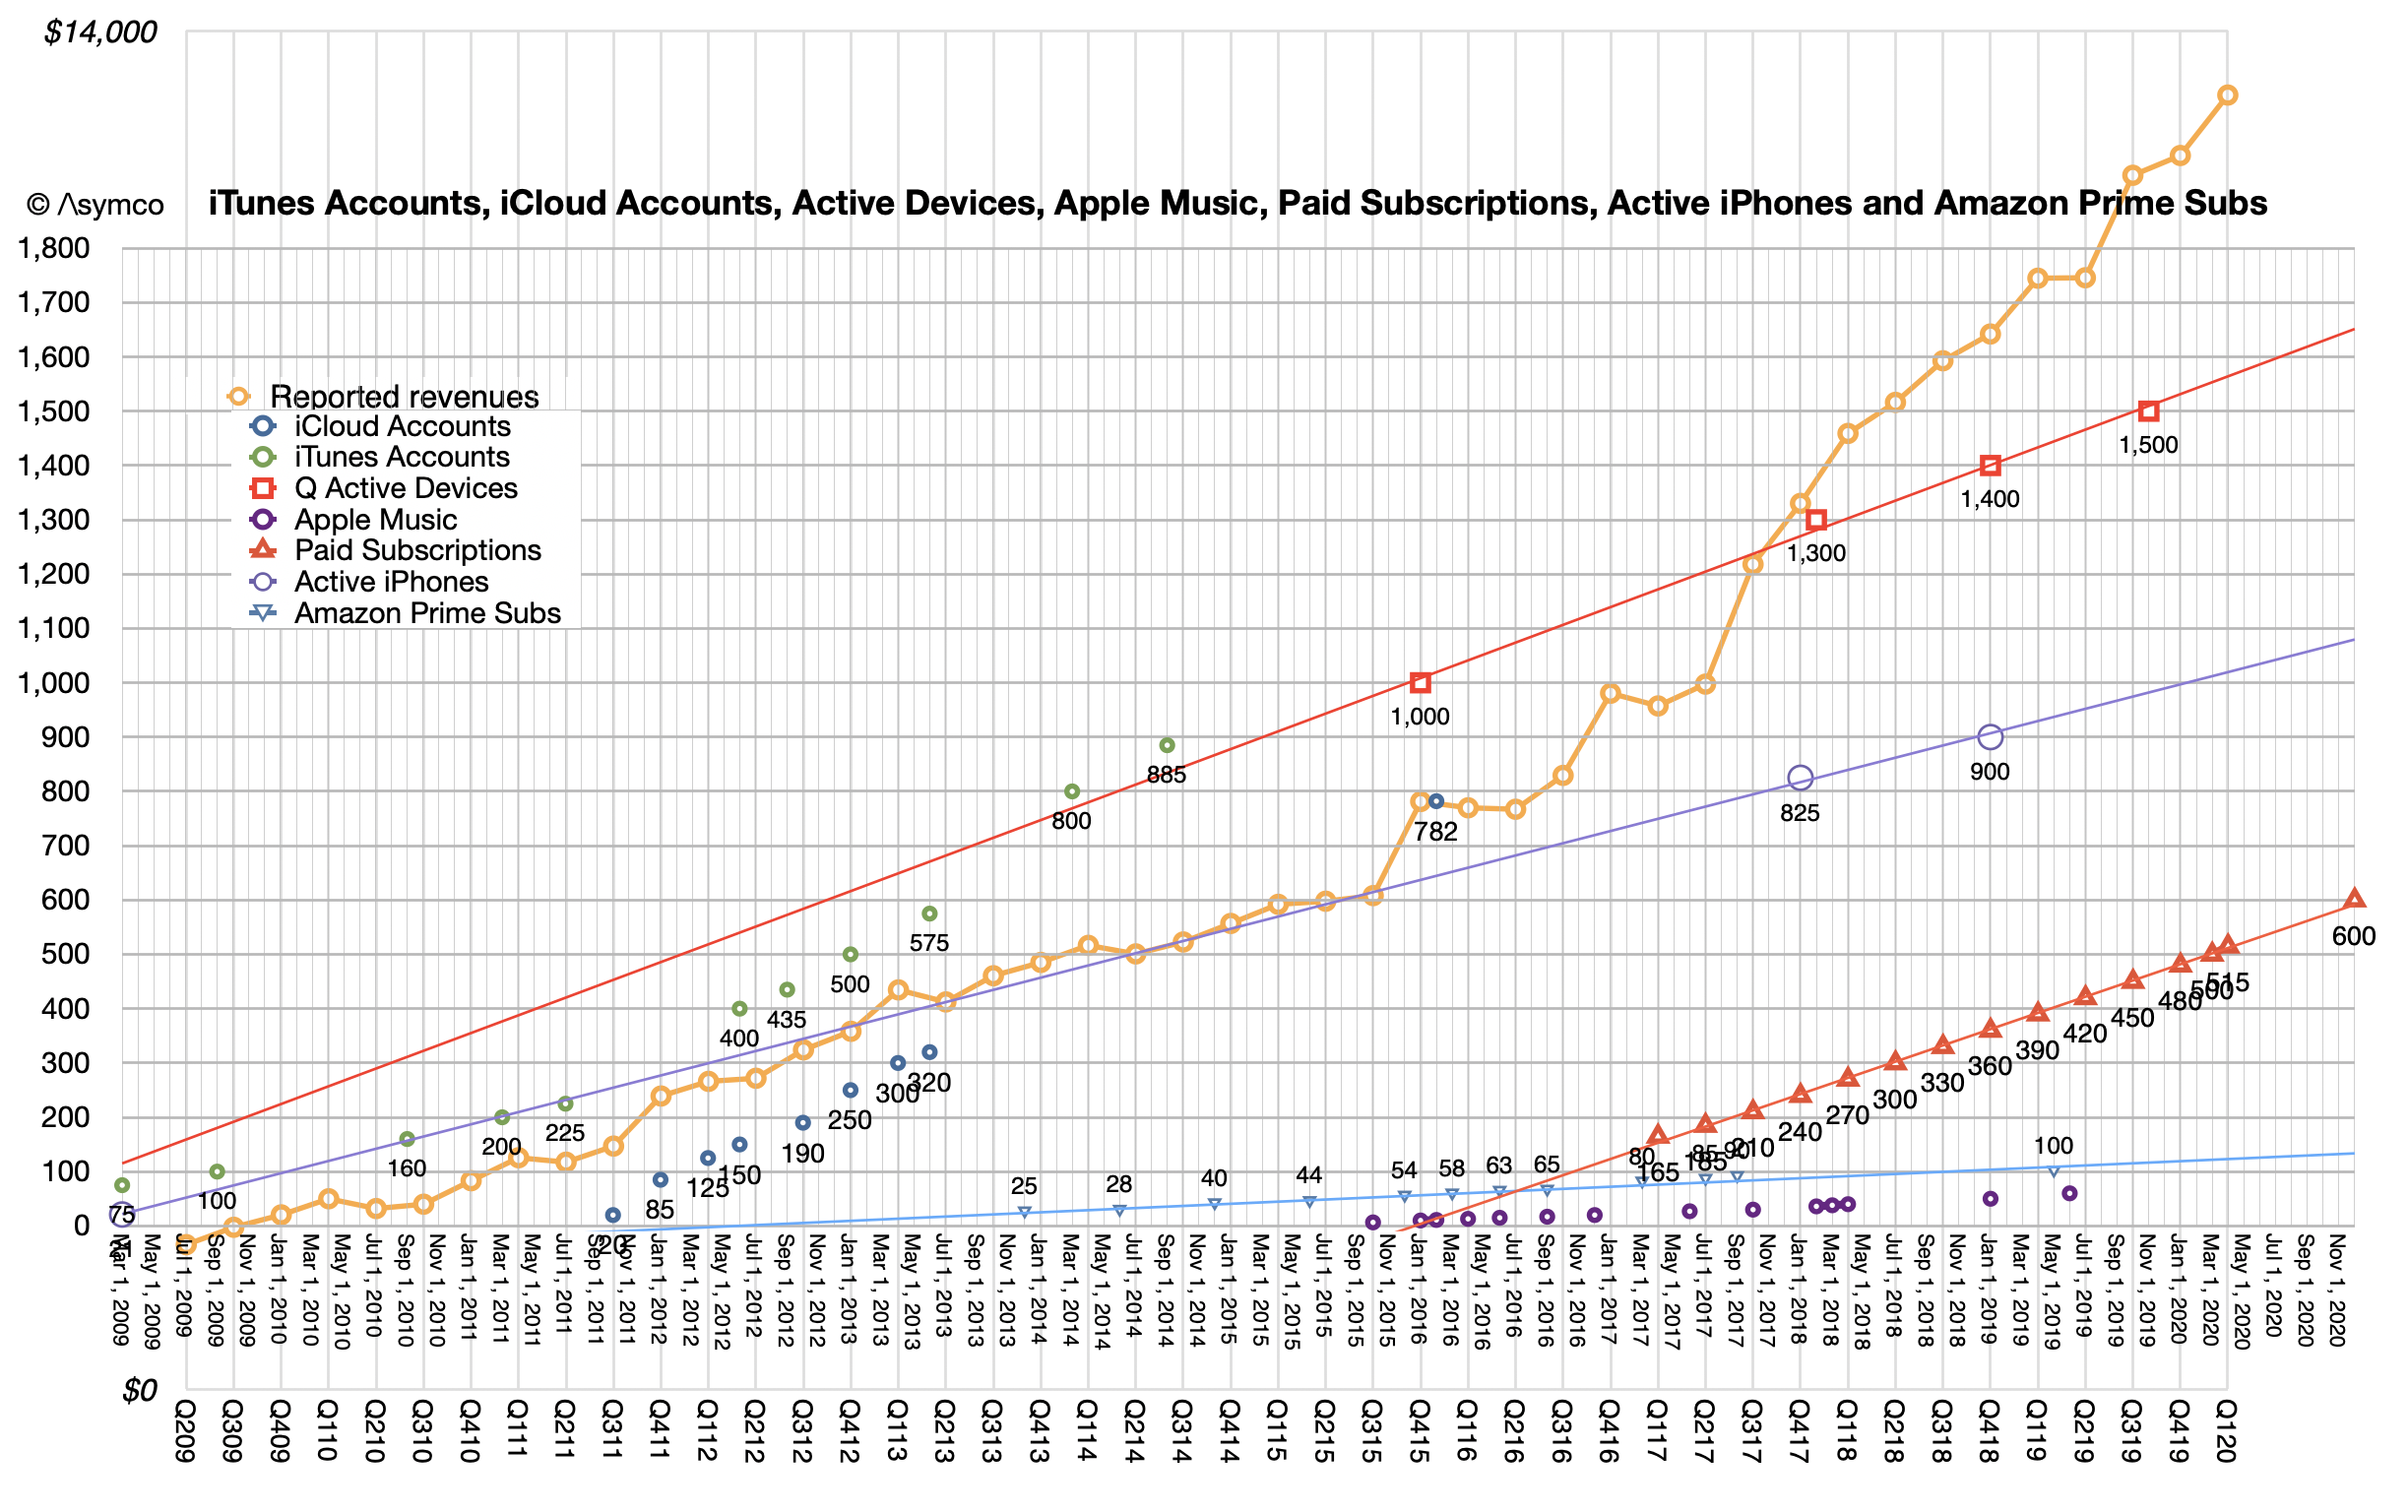
The Green and Black areas are also captured through subscriptions whose quantity is charted with triangles below. Note that the latest quarter saw an acceleration in the accumulation of subscriptions, putting the 600 million target set for end of this year closer than expected. Note also the change in slope of the yellow line as the triangles were added.
These two charts are an attempt to illustrate what is a huge set of activities. Apple's product lines may be something we can grasp in terms of objects for sale and price points, and feature sets, etc. But the Ecosystem that sits on top of these devices is not comprehensible.
There are literally millions of apps, services, and ways of delivering and capturing value. There are millions of people employed in what amounts to an economy bigger than the 25th largest in the world (Belgium (1)). It's half a trillion dollars of activity.
Given the growth of the underlying Services segment (~15%), it's probably going to double in 5 years to $1 trillion. Apple will certainly benefit as even if only 9% of that is booked as direct revenues, the rest will create resilience in the user base.
The power of an ecosystem isn't what Apple is able to skim from it but rather that millions of other people will want to encourage and preserve its existence as their livelihoods, hopes and aspirations will depend on it. This goes beyond loyalty of end users (which is extraordinary) as it's a loyalty of those who co-invest in it. All participants in an ecosystem become partners in its preservation.
Apple is not the only technological ecosystem out there, but I'm willing to bet that it's the most vibrant in terms of creative effort, economic value and growth.
This ecosystem is a thunderous declaration of value which is largely unheard by investors or analysts. While looking at the potential for growing the direct revenue with "+" Apple services, the indirect, qualitative added value of services which never hit Apple's income statement are ignored. Like the ignored value of a satisfied customer, how much is the value of an economic co-dependency?
Although it's inappropriate to compare a company's market capitalization (which is a measure of asset value) with GDP (which is a measure of economic activity) an "economy" like the value of all transactions in an ecosystem is comparable with GDP.
In March 2016 Ben Bajarin and I put on an event called SUBSCRIBE where we asked, among other things,
How will the online services business models evolve?
How will hardware affect software and services and vice versa?
How will users, usage, and capital connect?
Now is a good time to look back on that event.
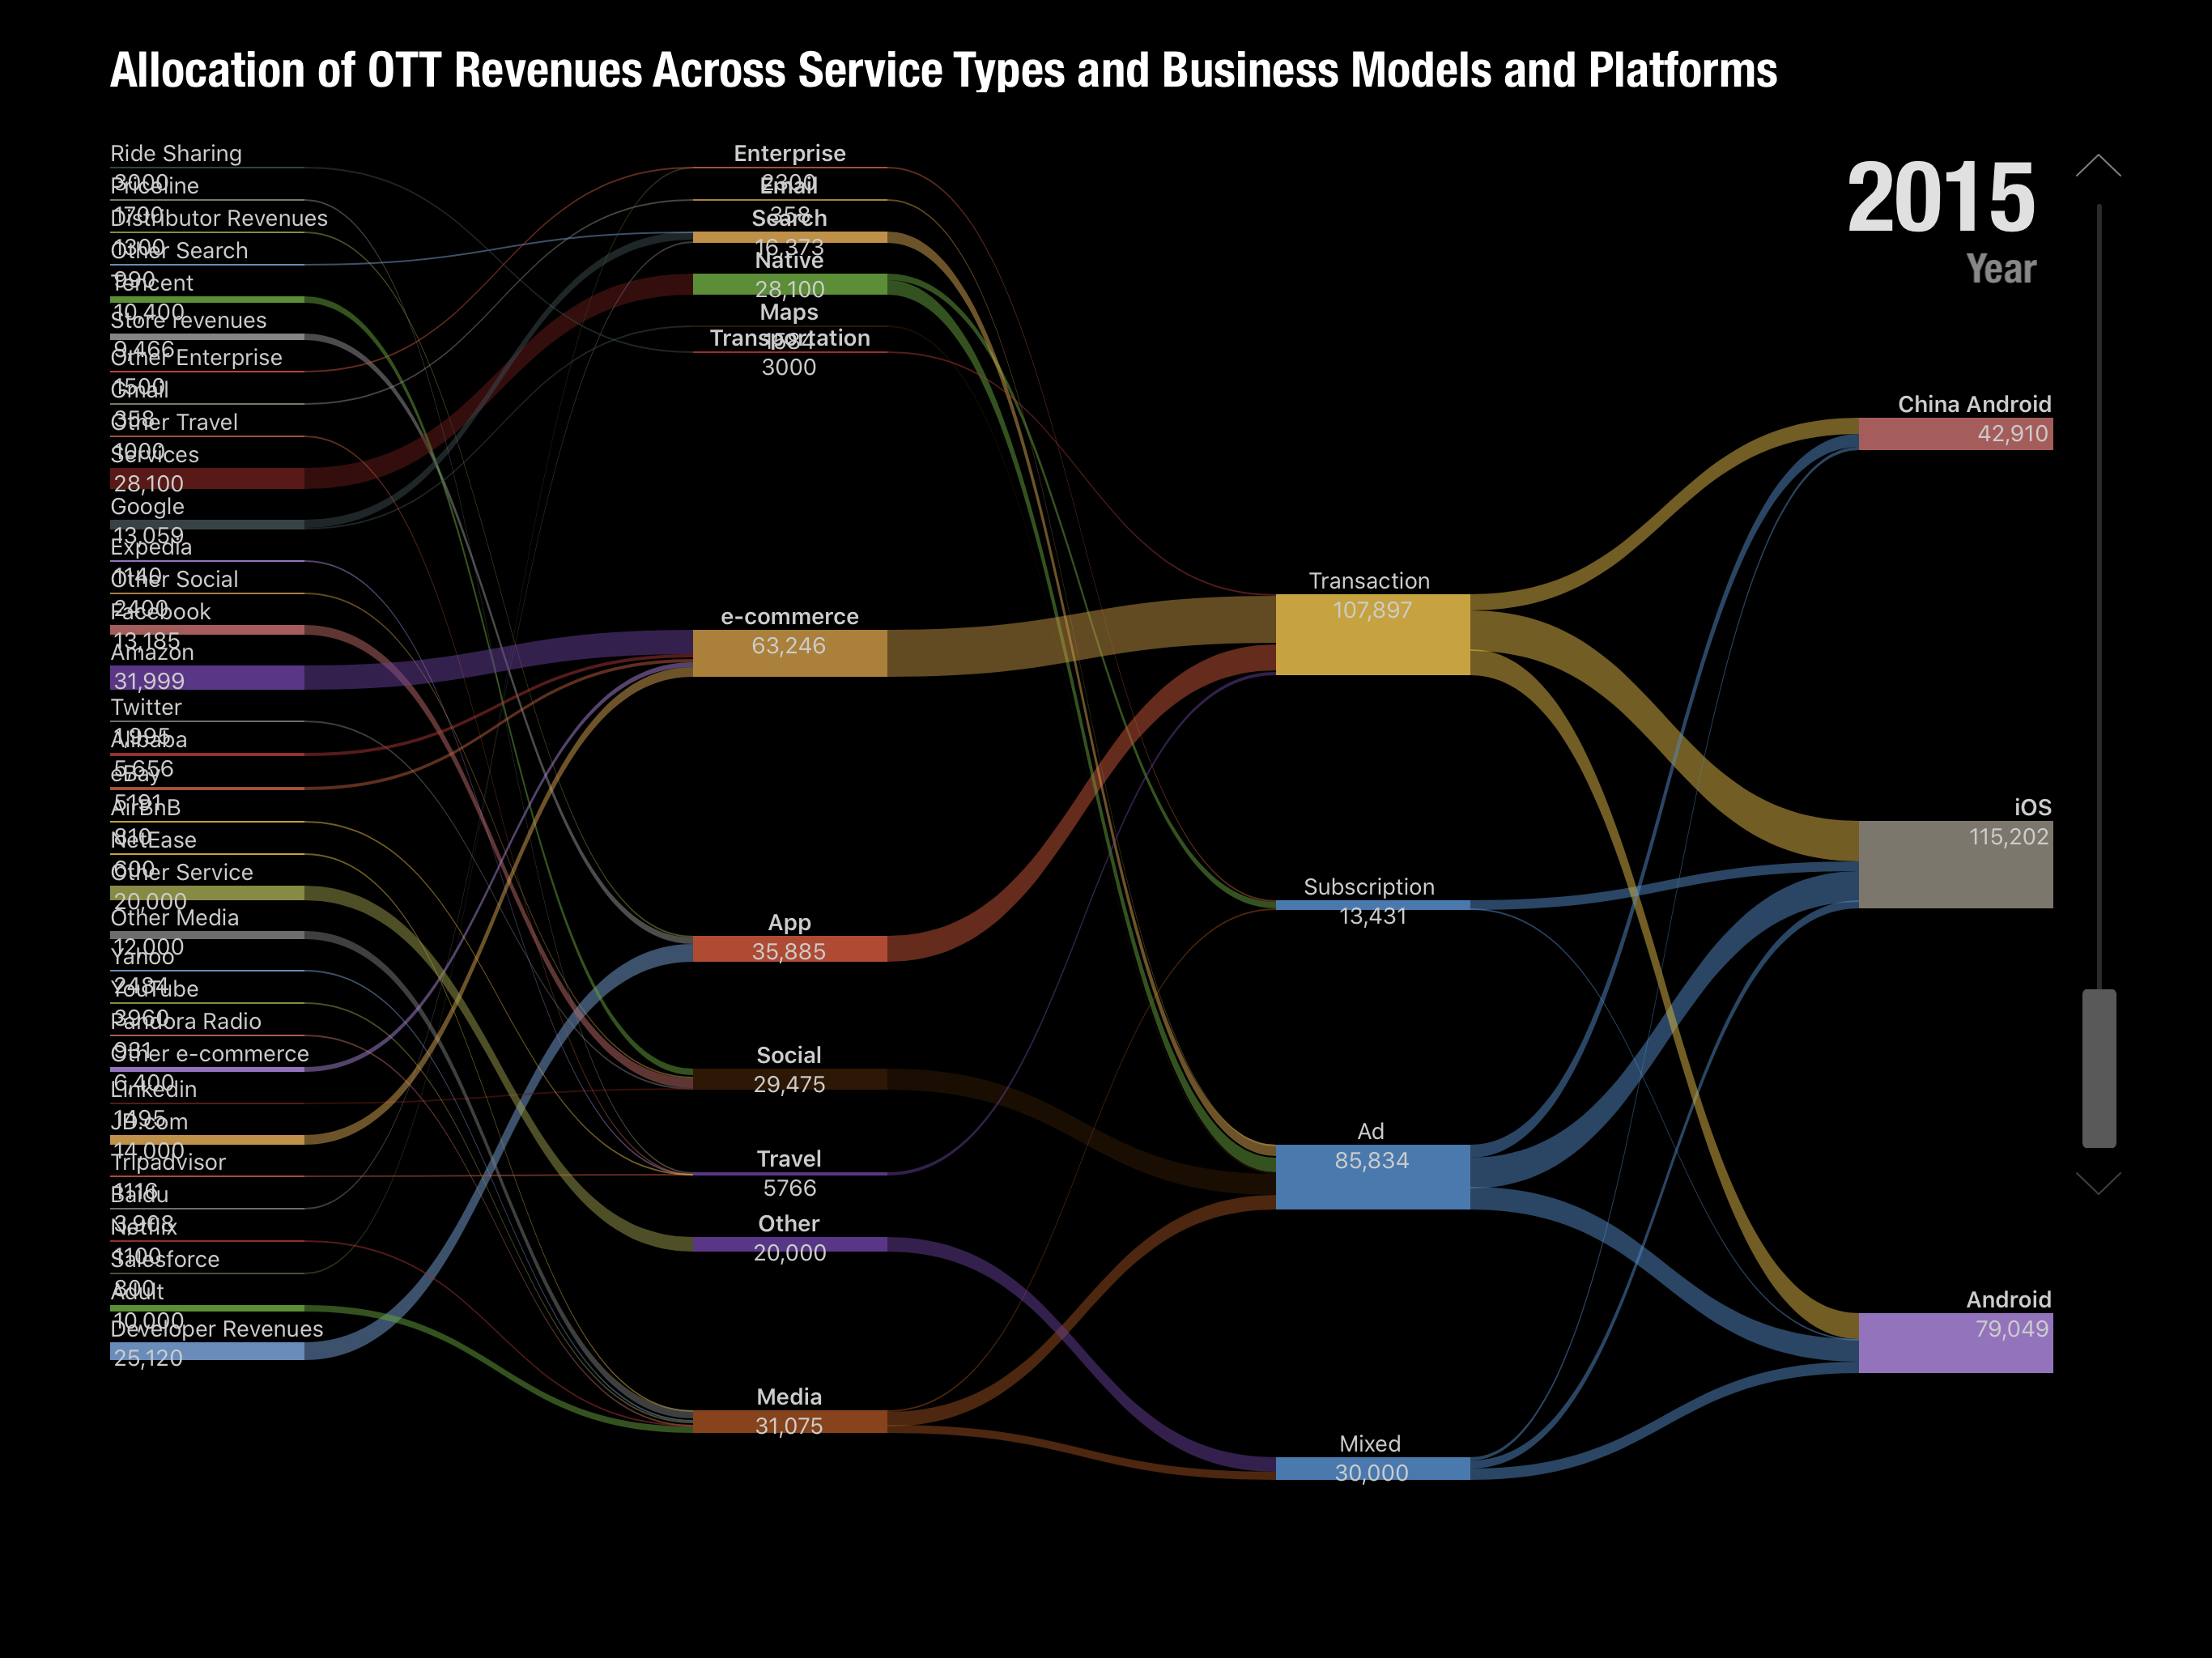
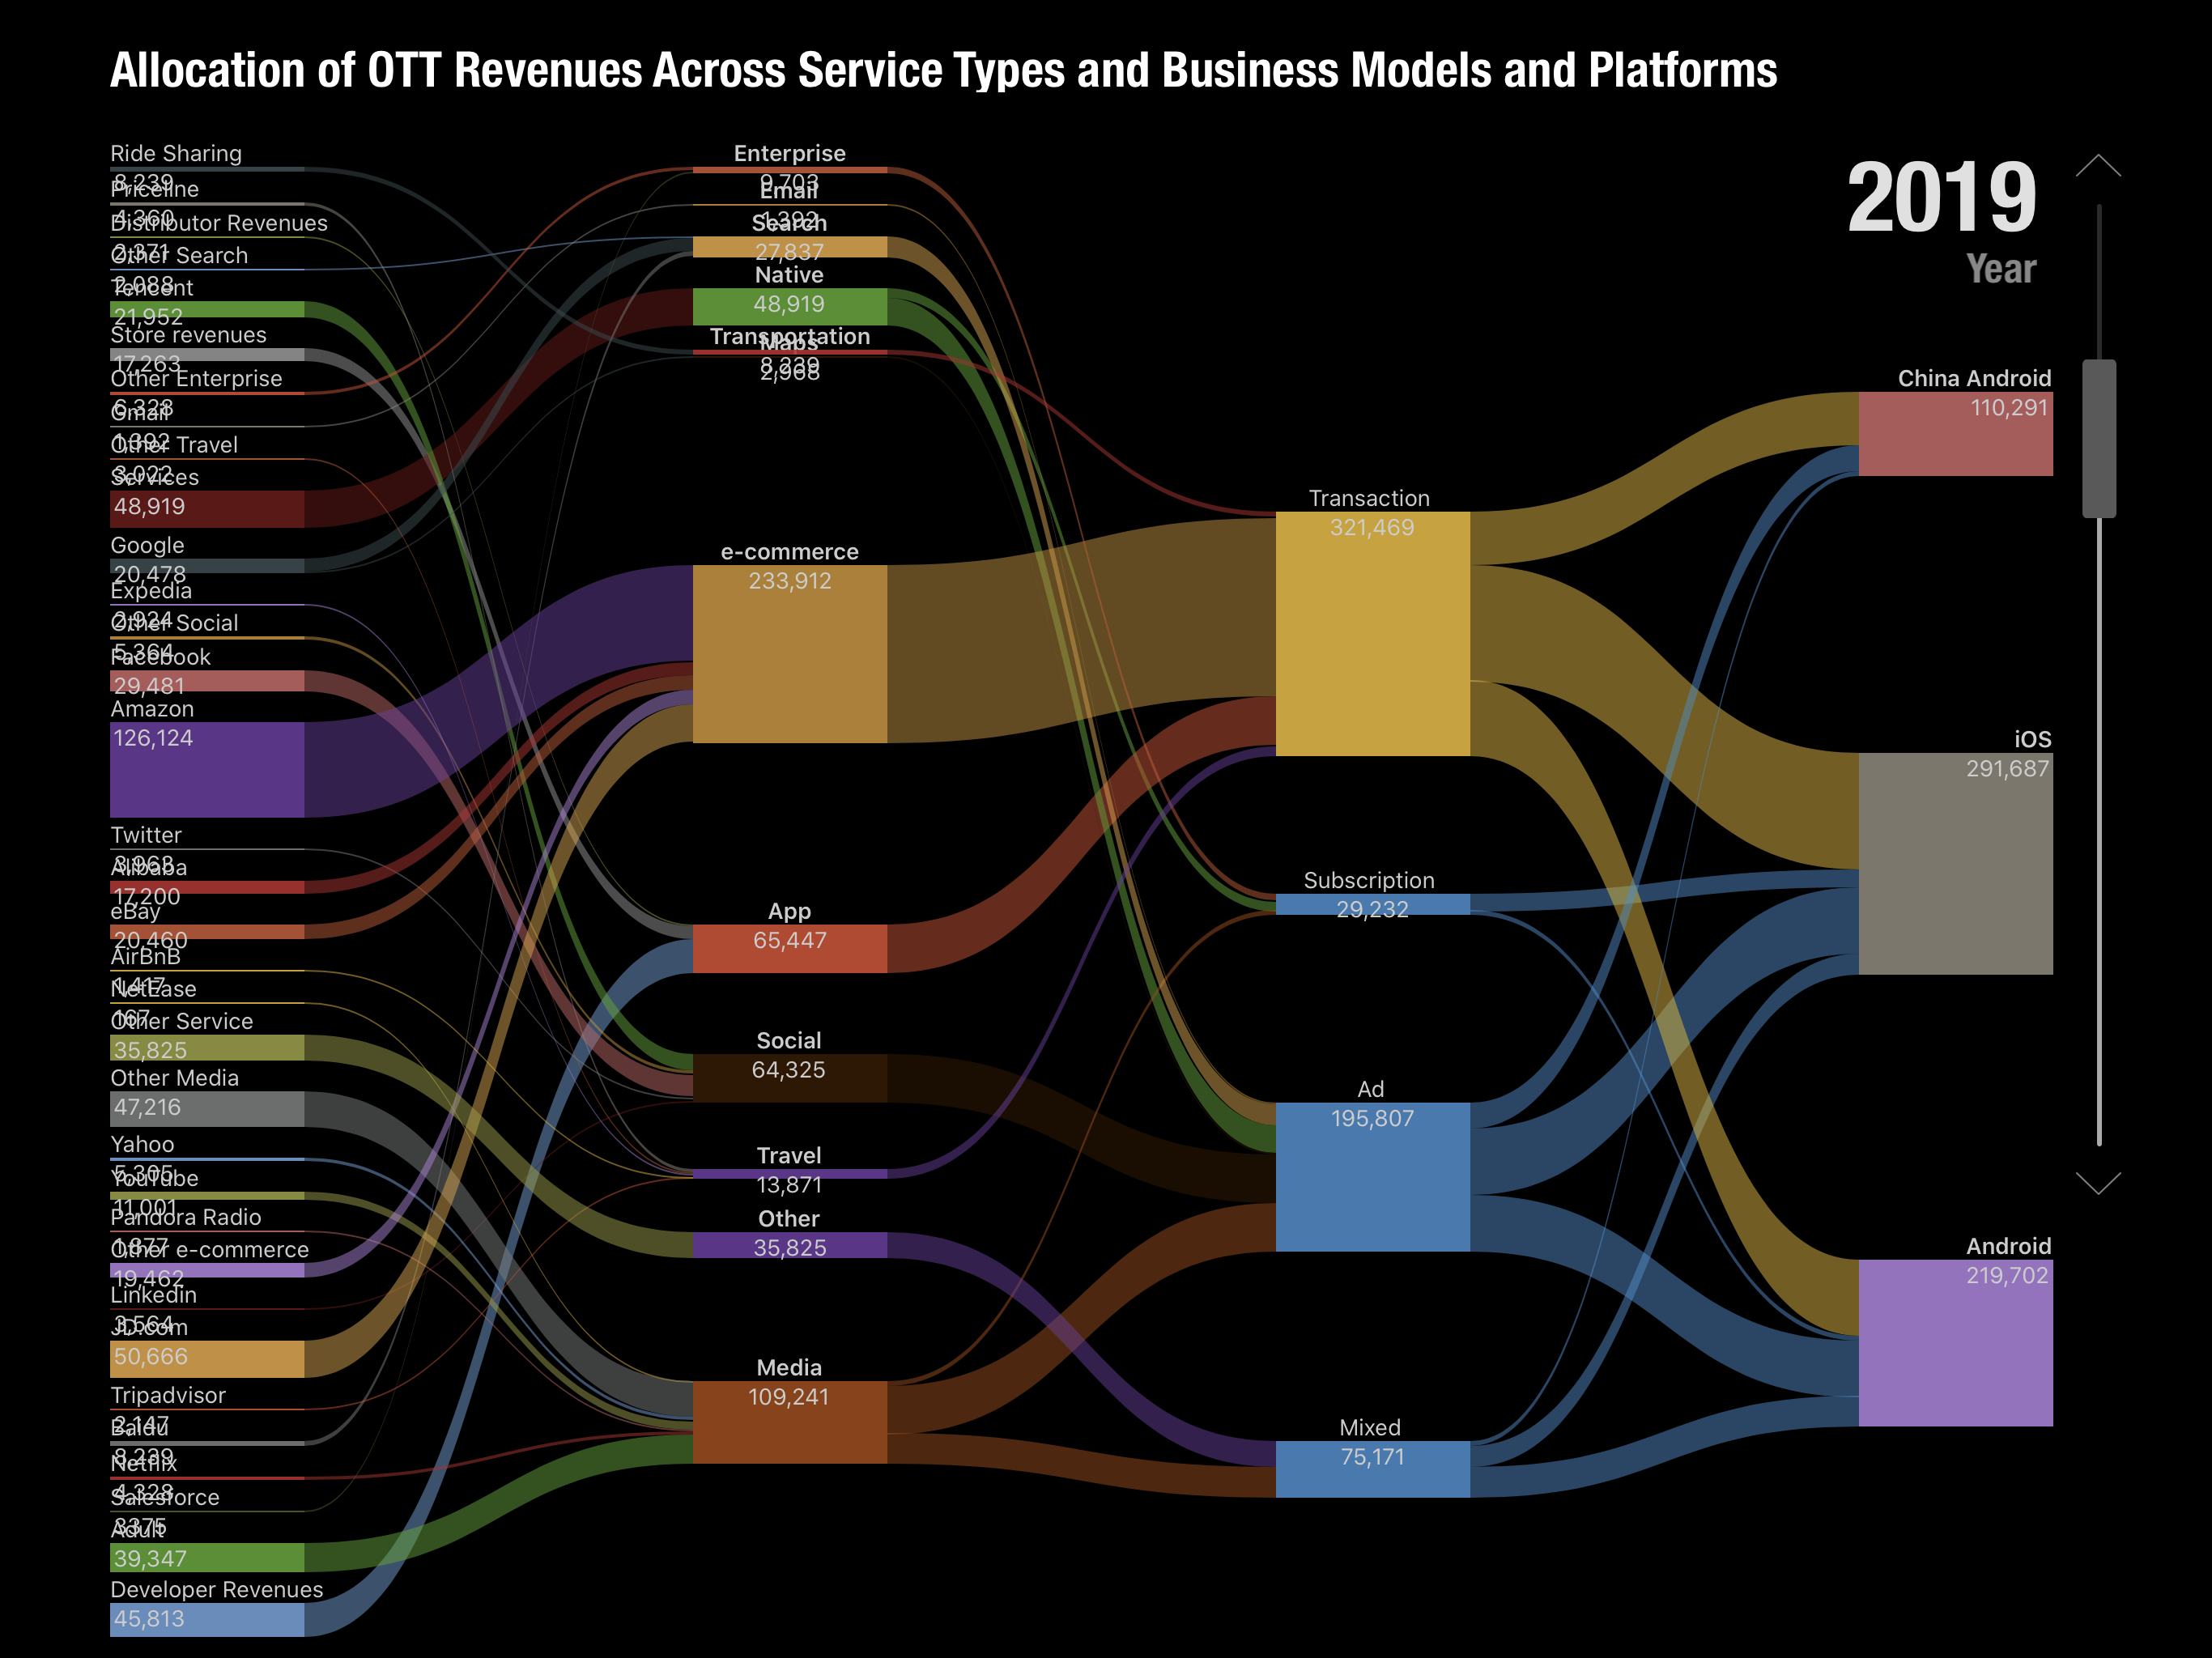
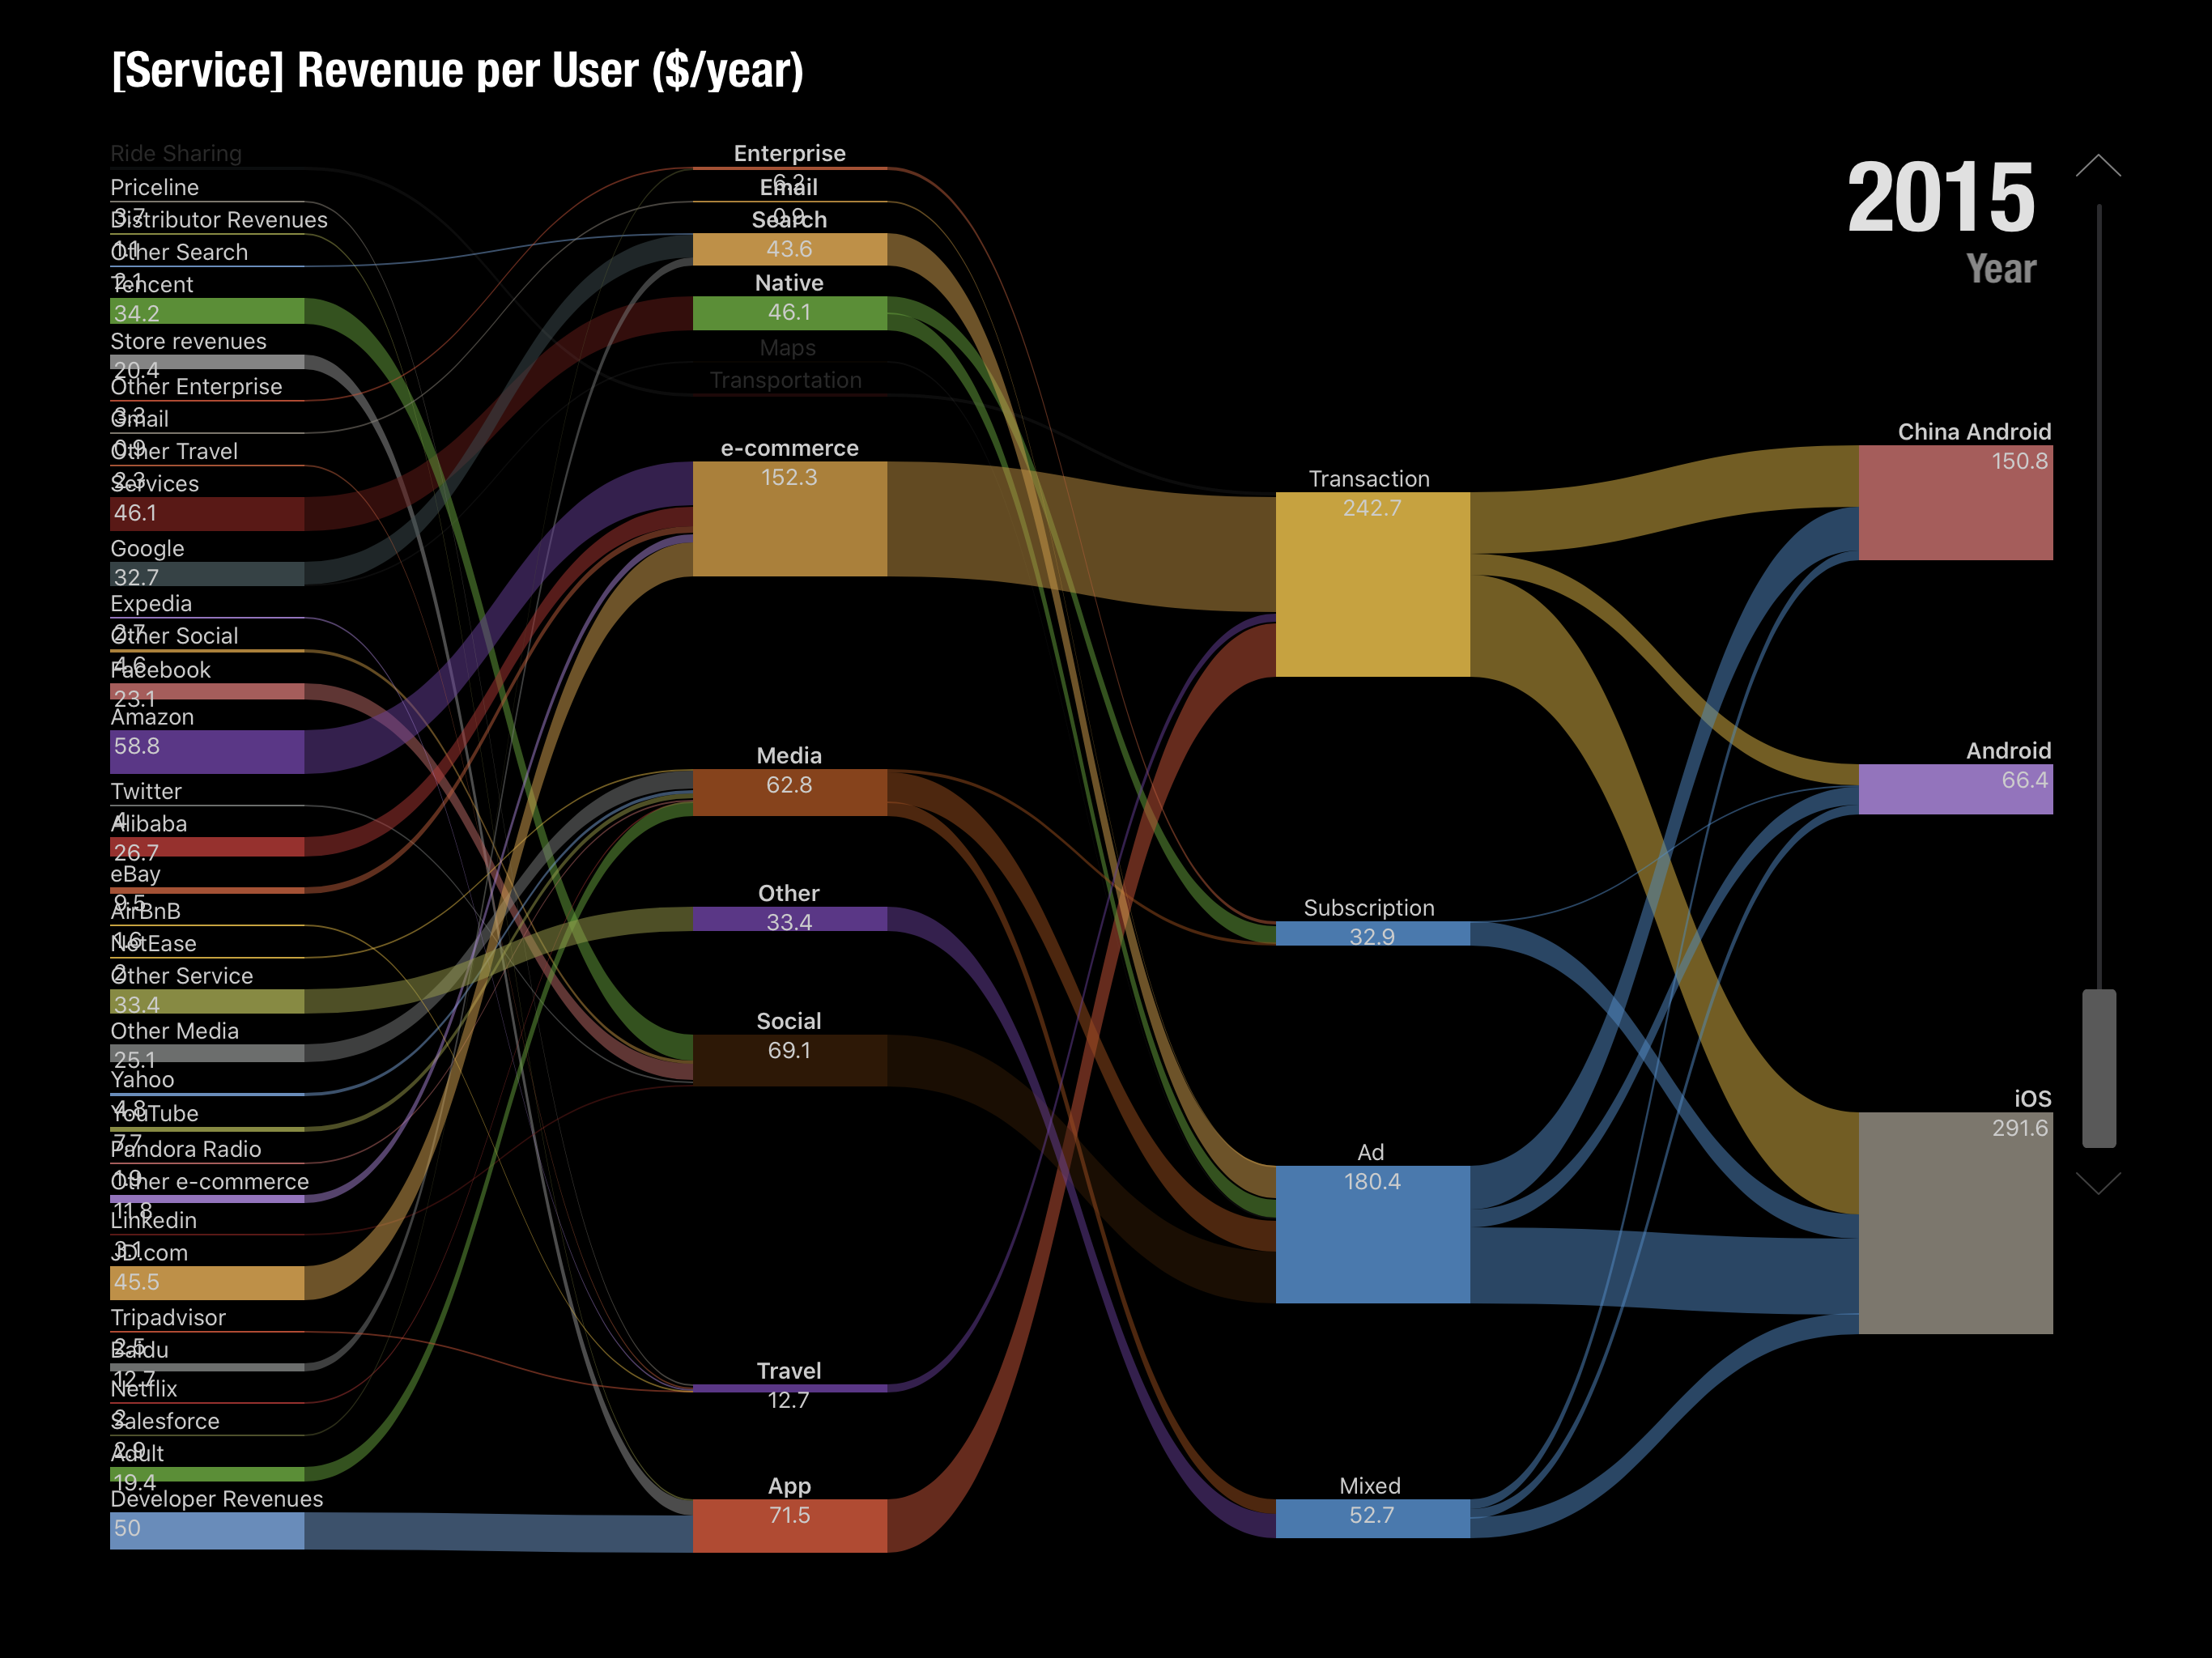
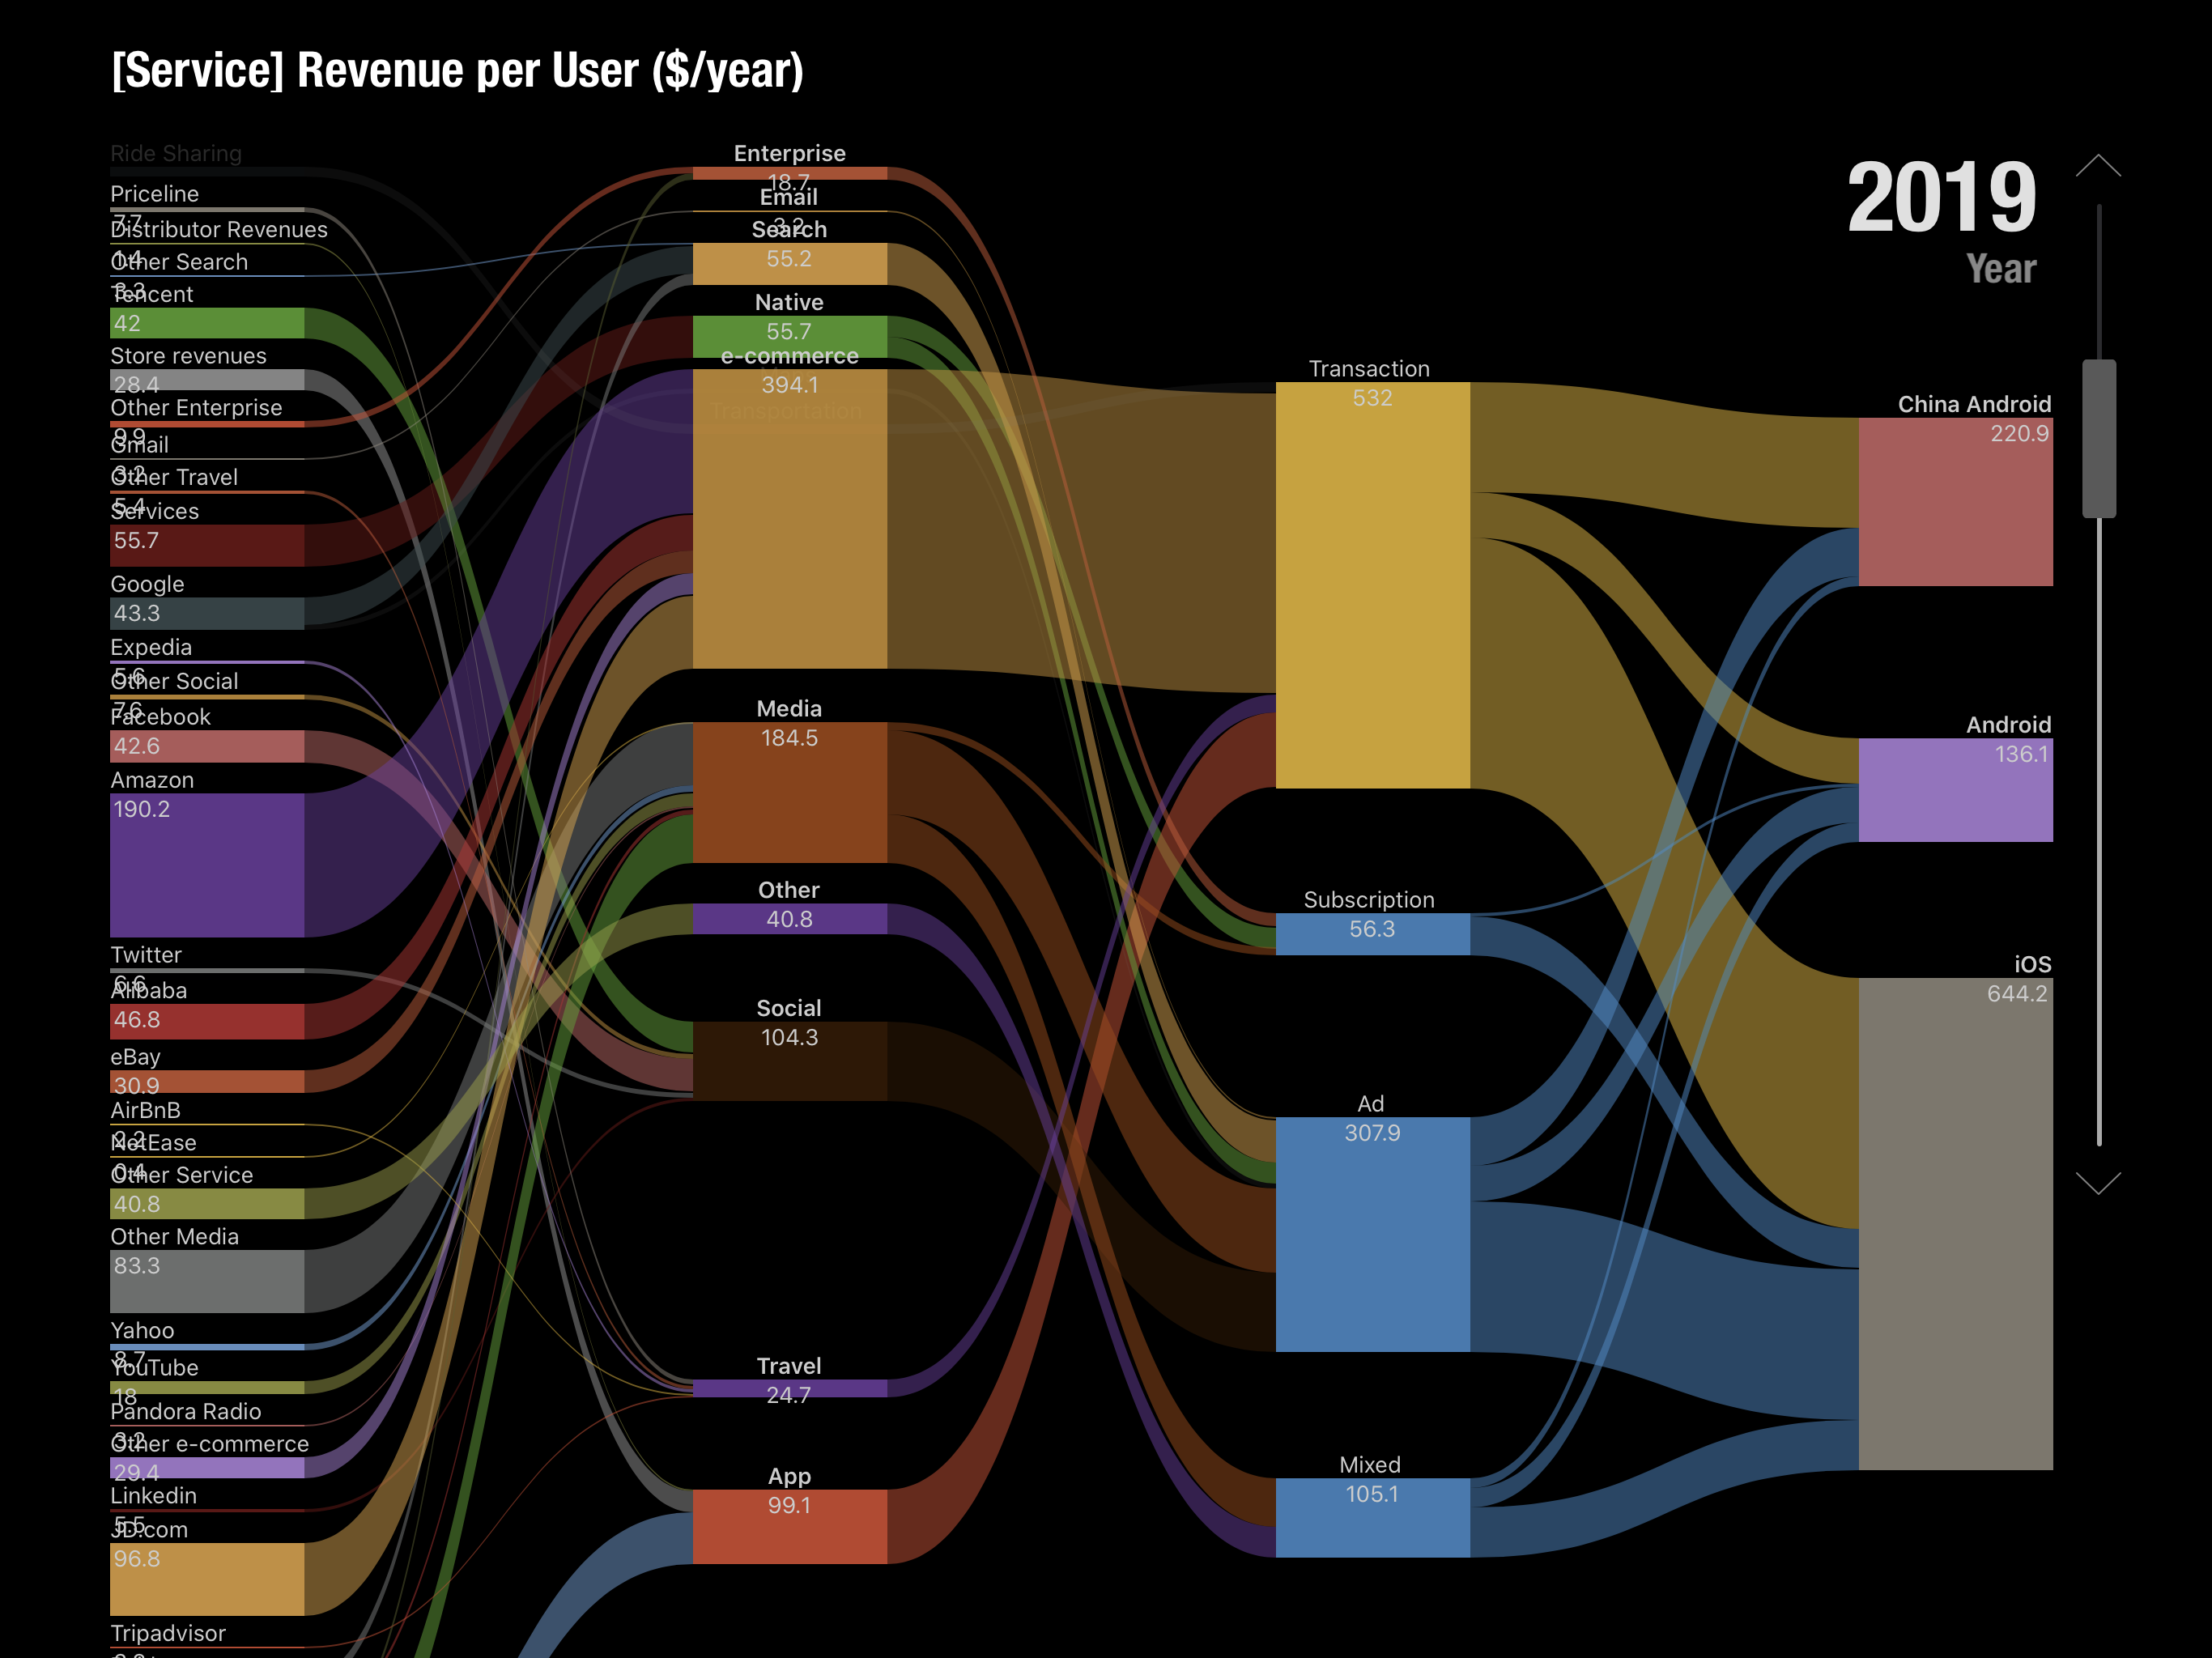
For the keynote I prepared a model which predicted the mobile ecosystems for iOS, Android and Chinese Android over the next 5 years (to 2020). The methodology involved taking a measurement of the revenues of the top internet service companies, building up the categories these companies occupied, estimating how much of those revenues are through mobile distribution and then splitting the result among the three platforms of iOS and the two Androids.
Adding to that the "native" app and content revenues for each platform would yield the Ecosystem total value. Applying a growth rate would offer some visibility into the future.
The following images are screen captures of the Perspective presentation.
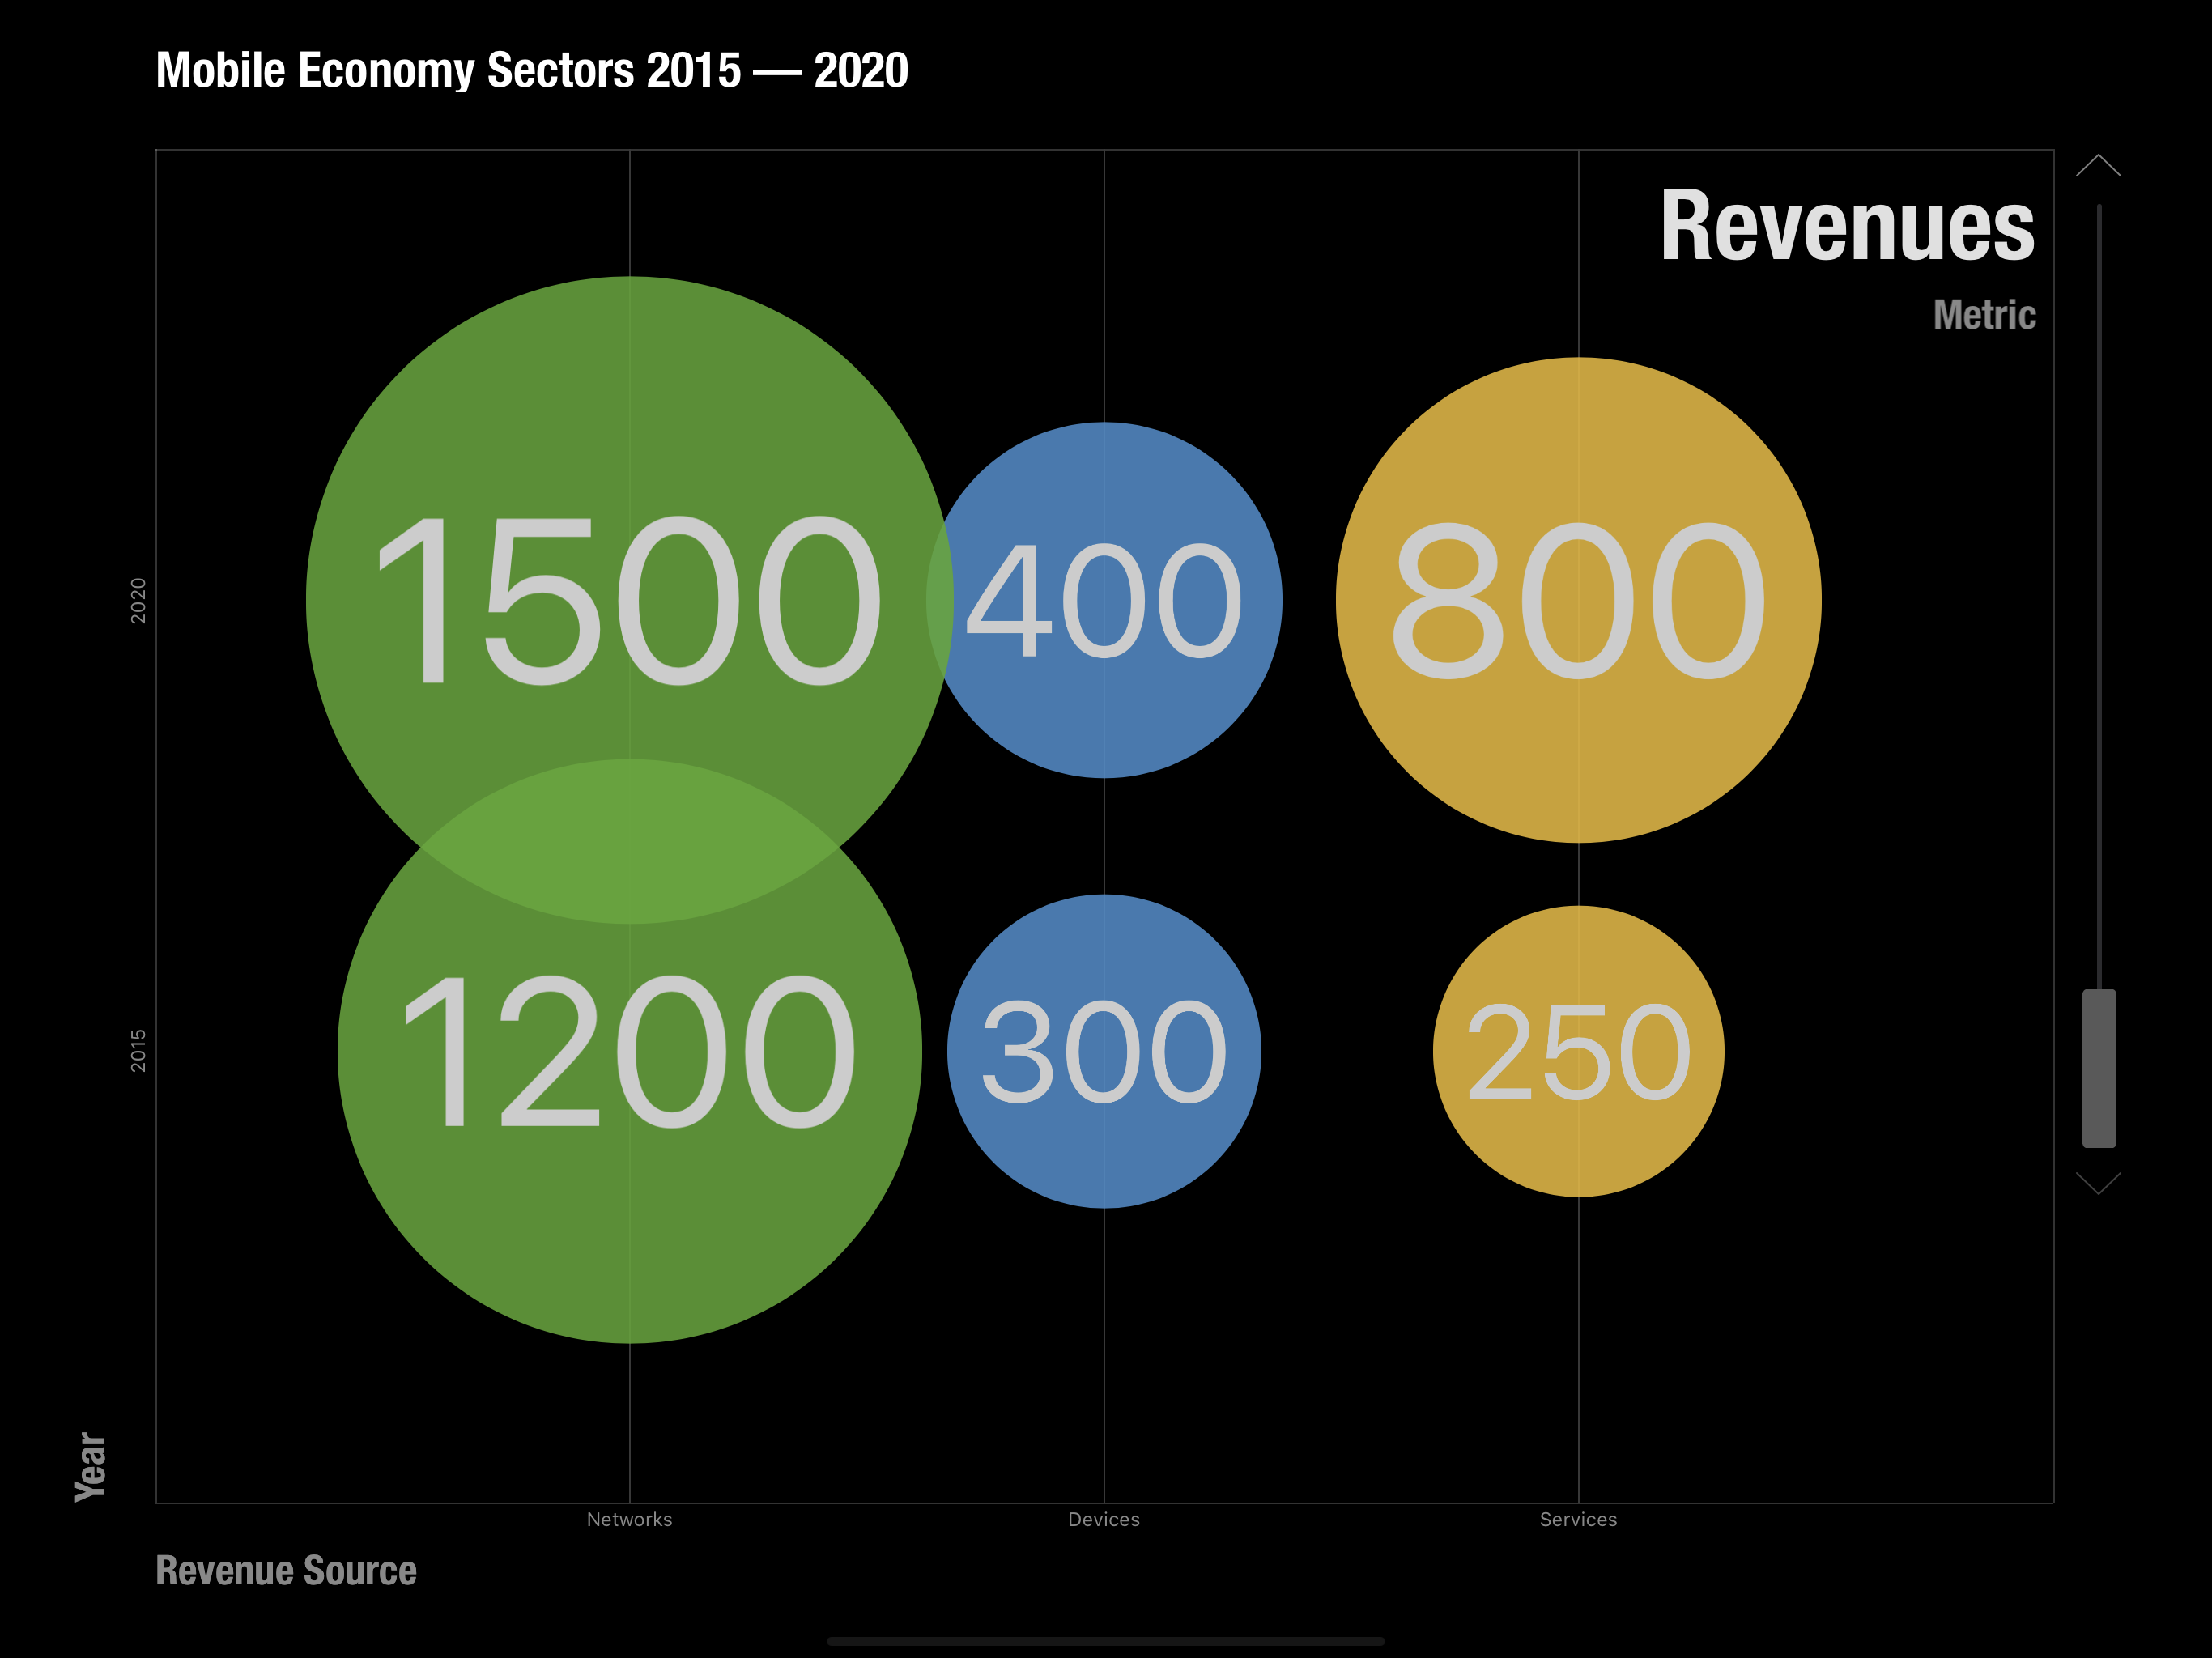
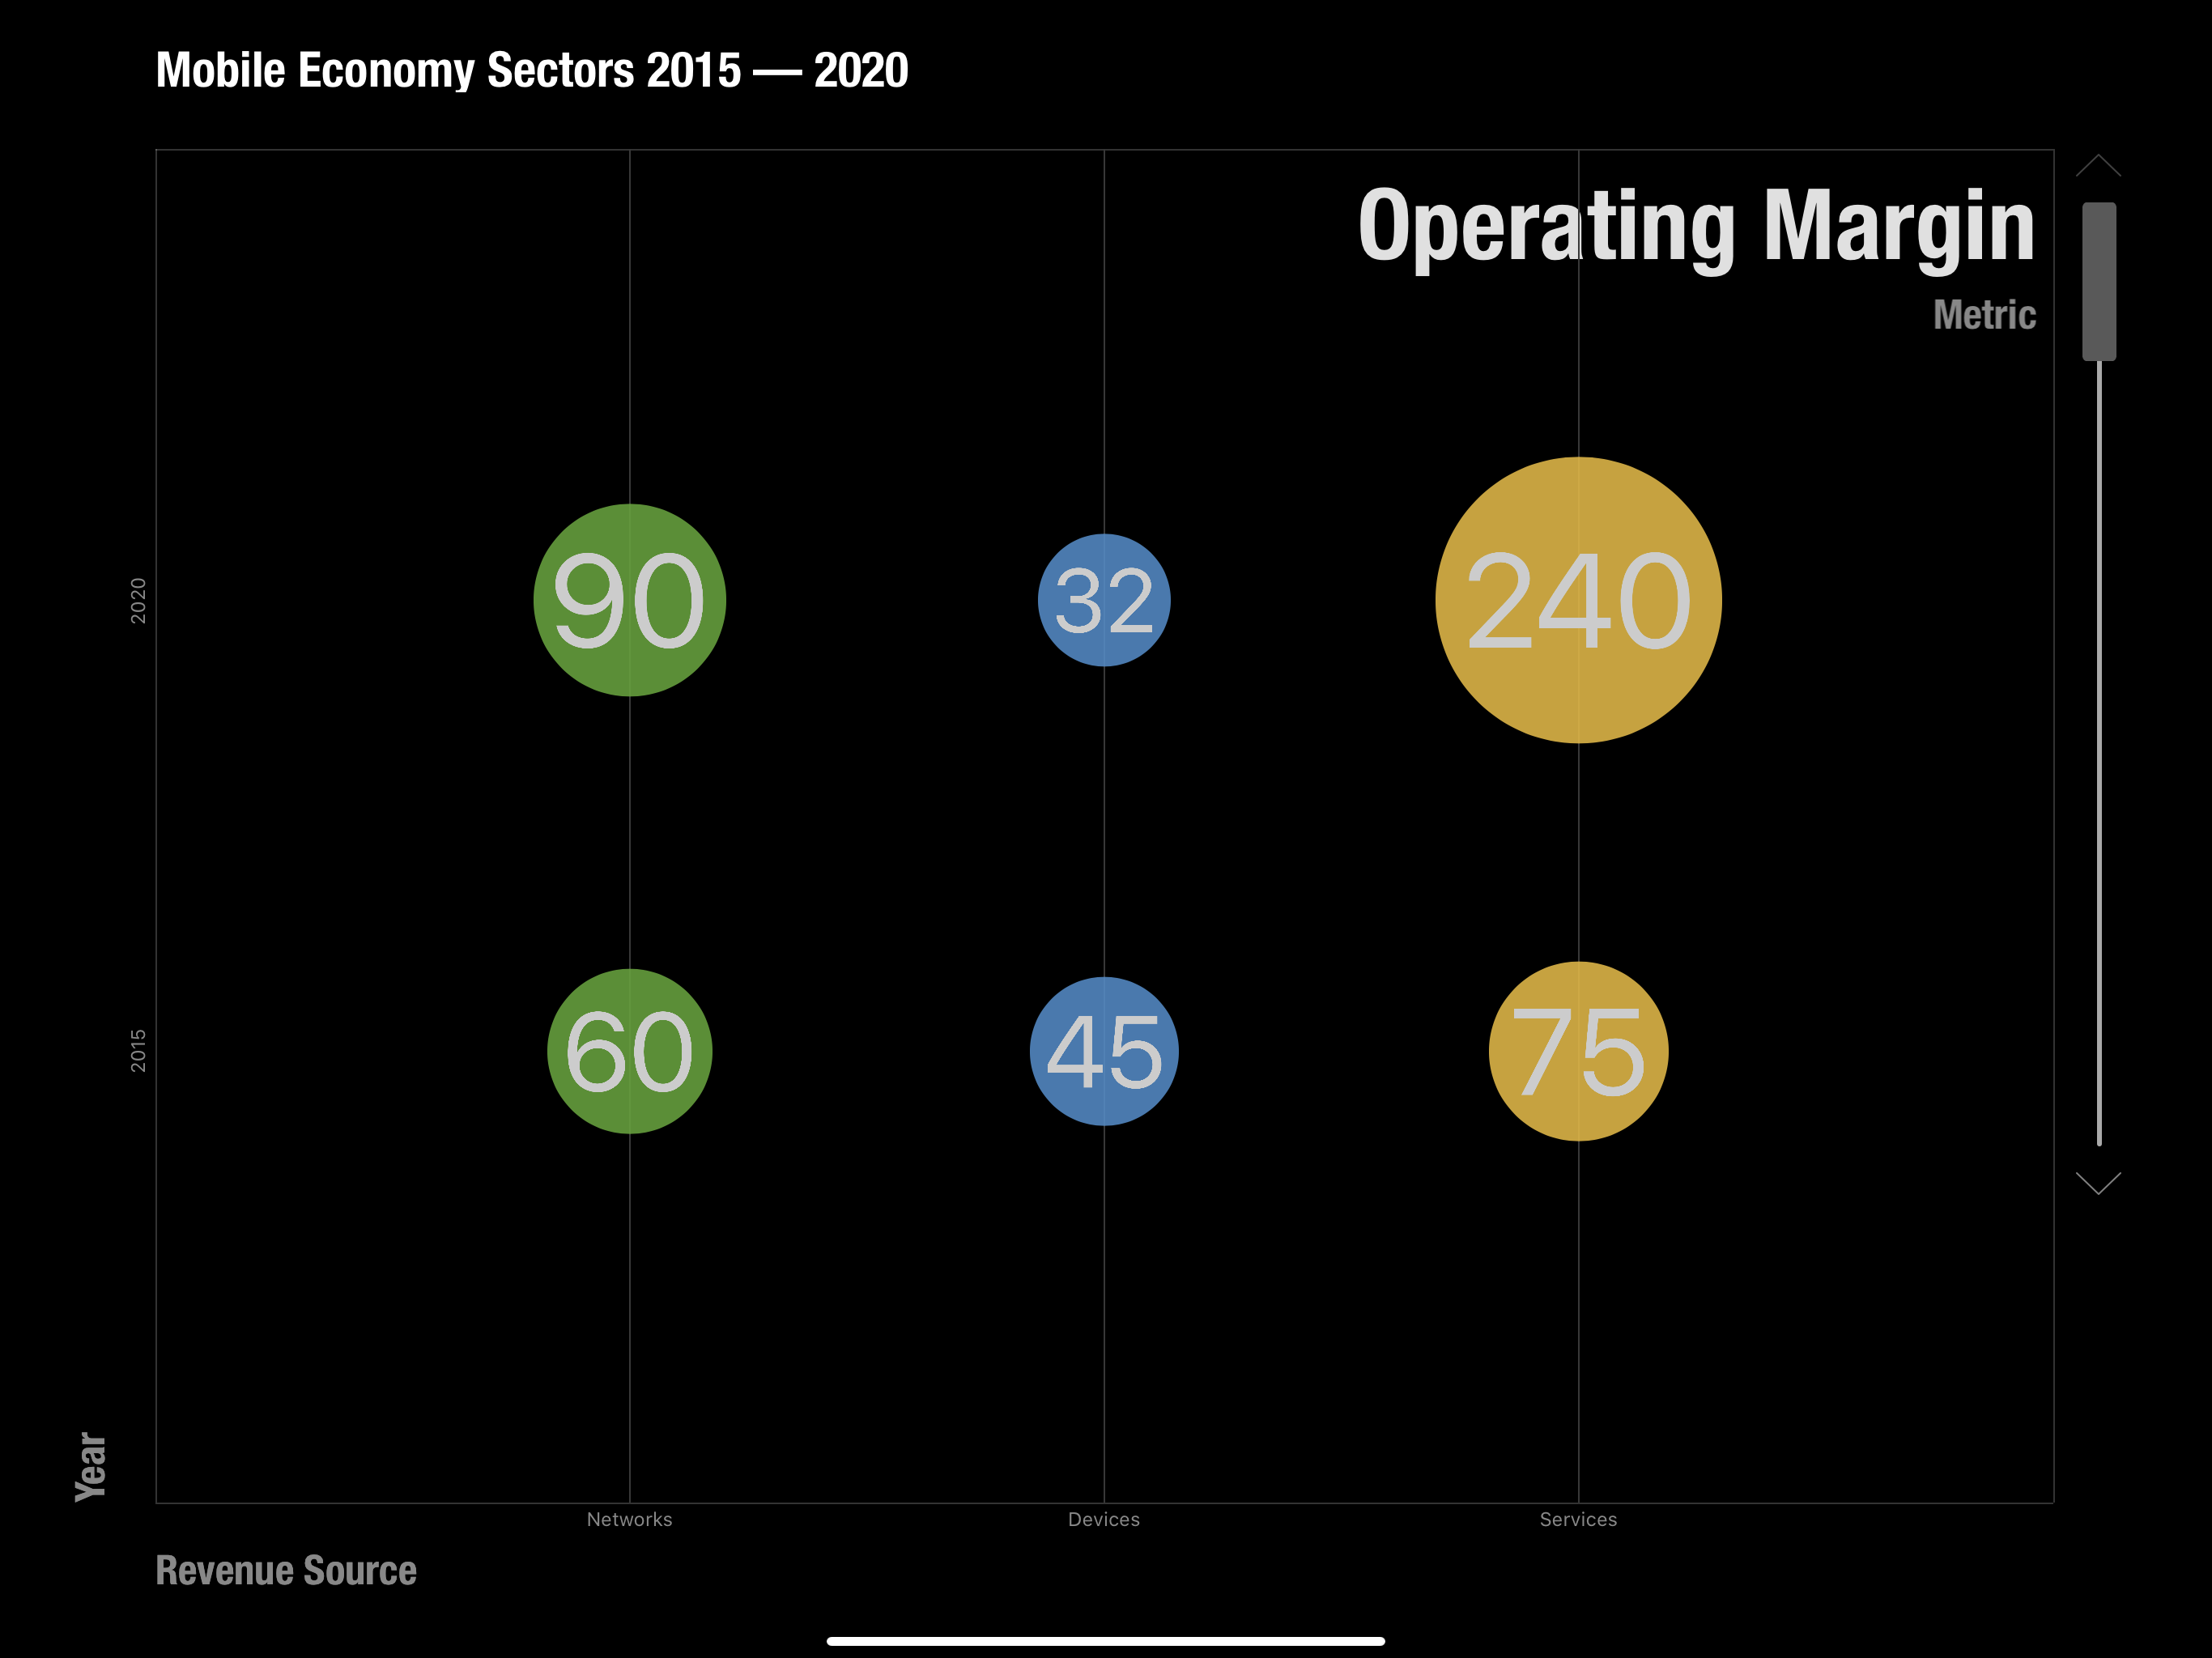
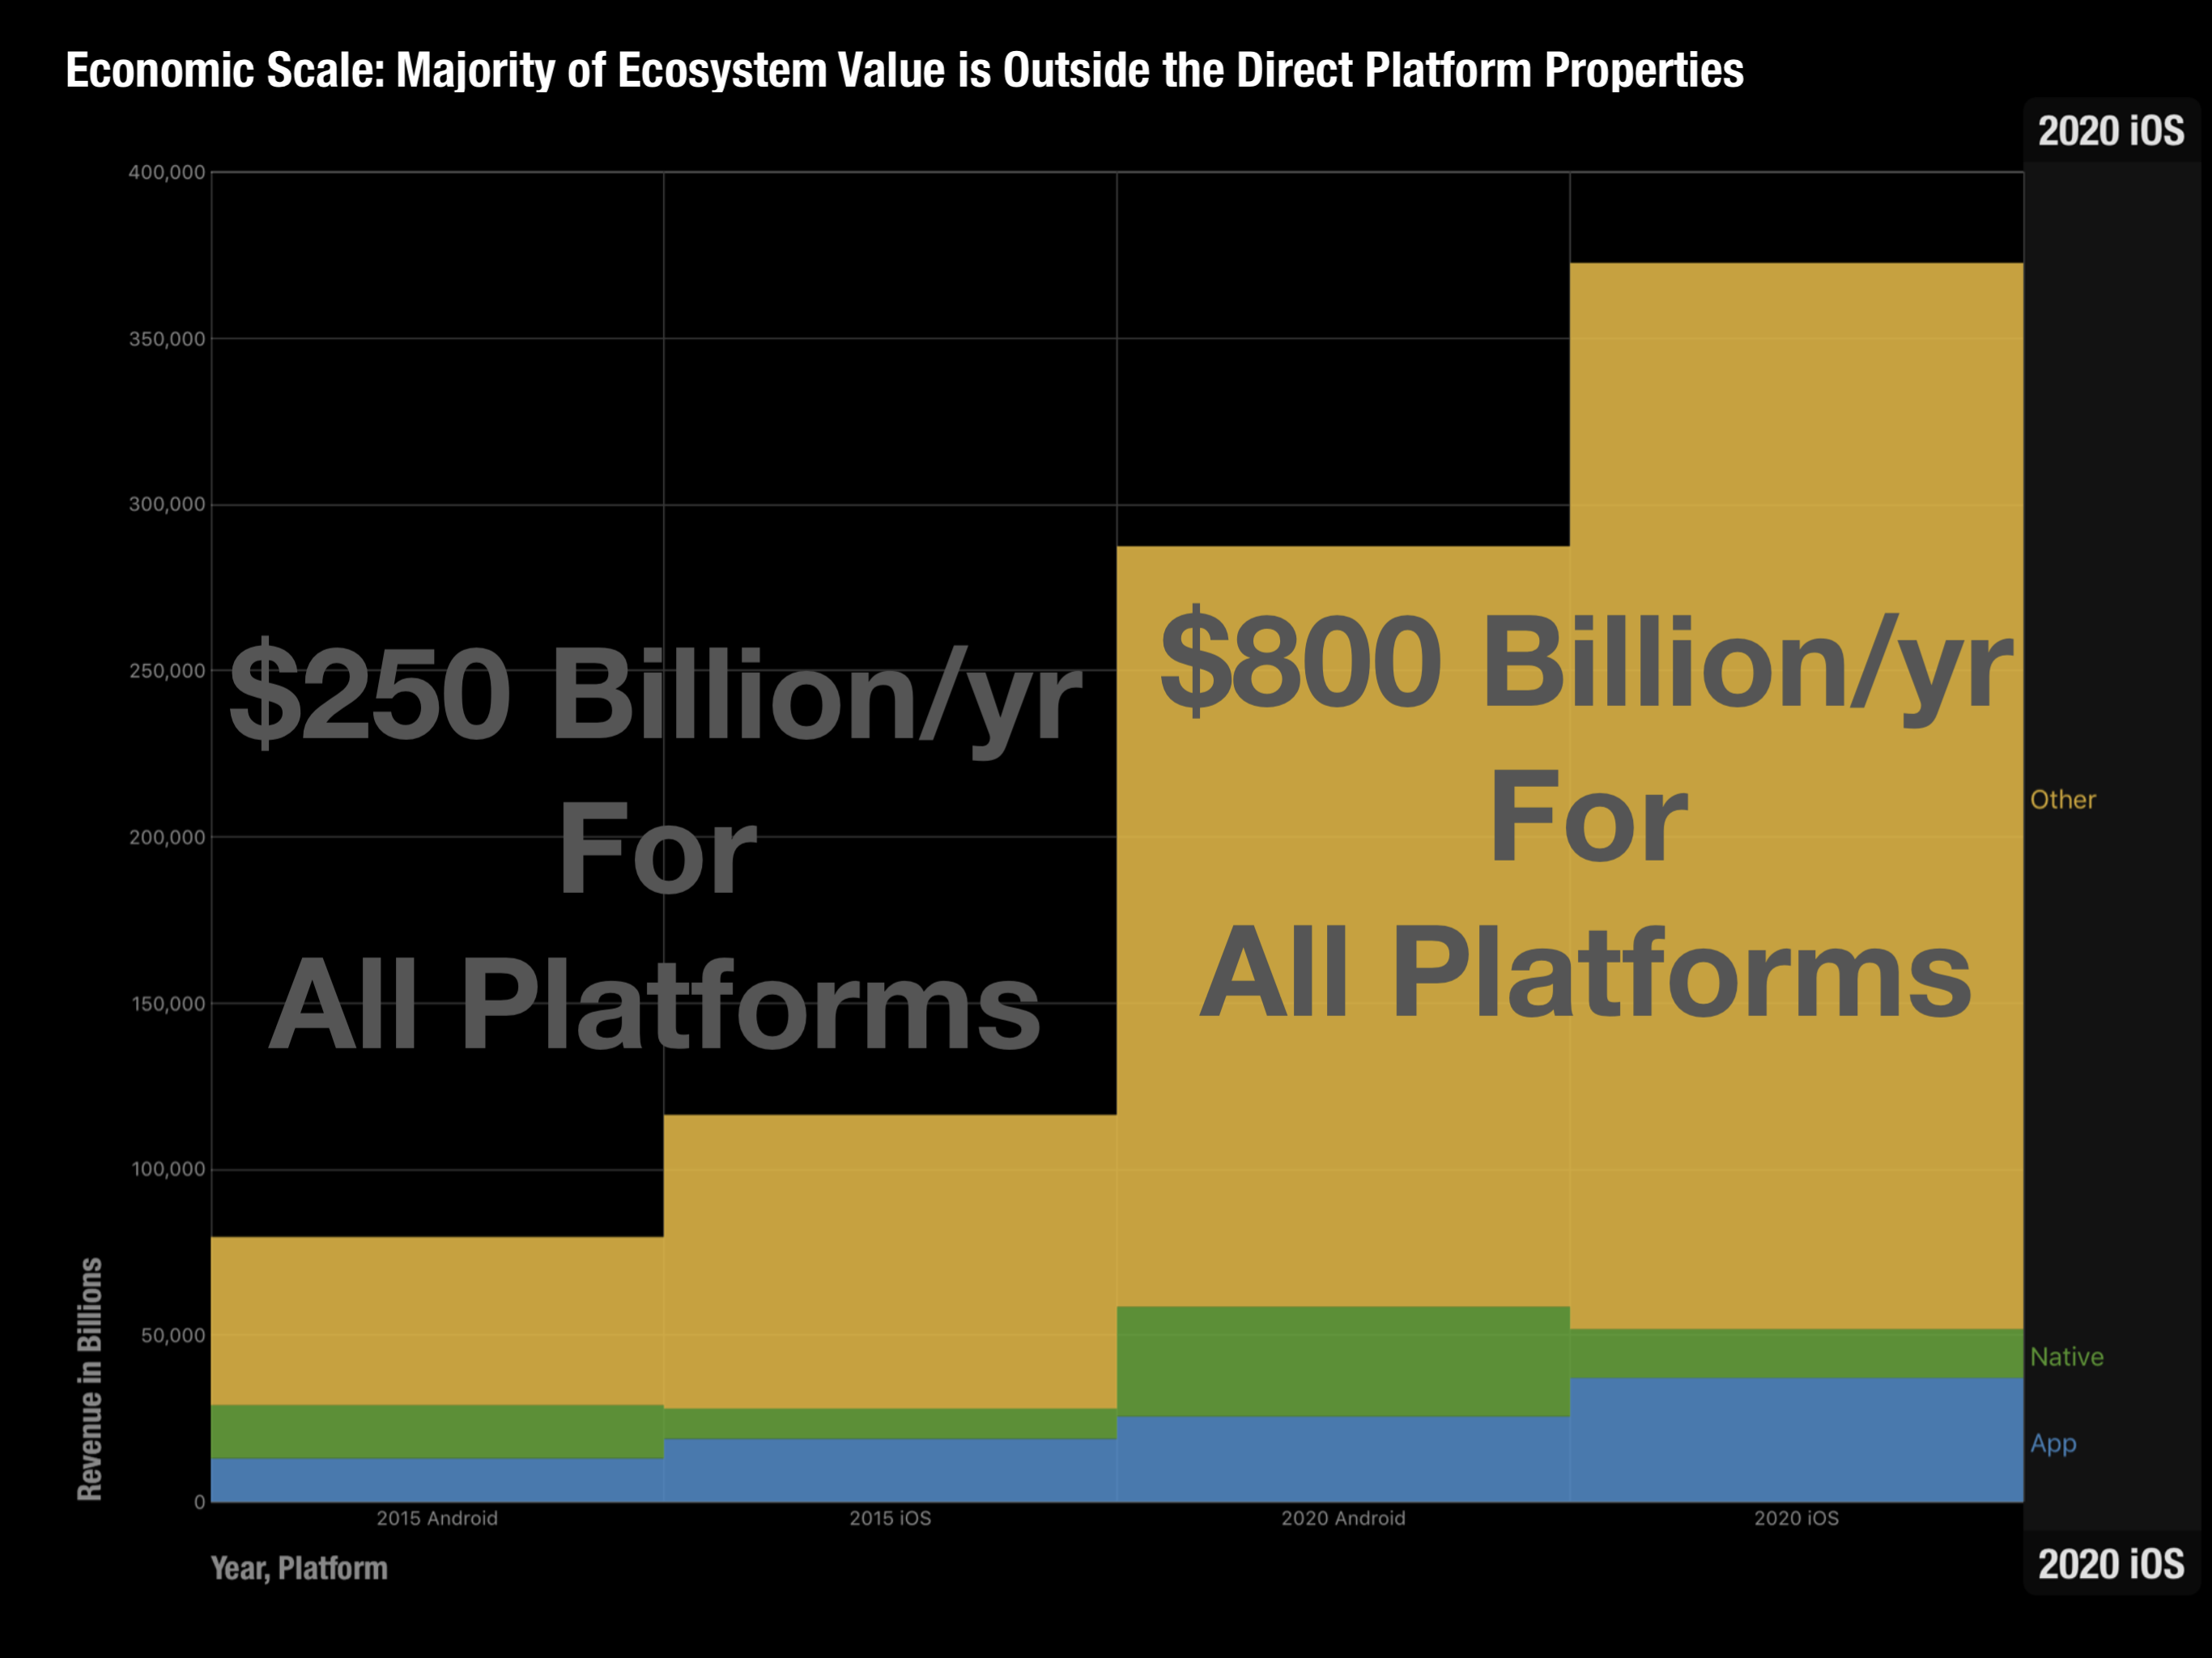
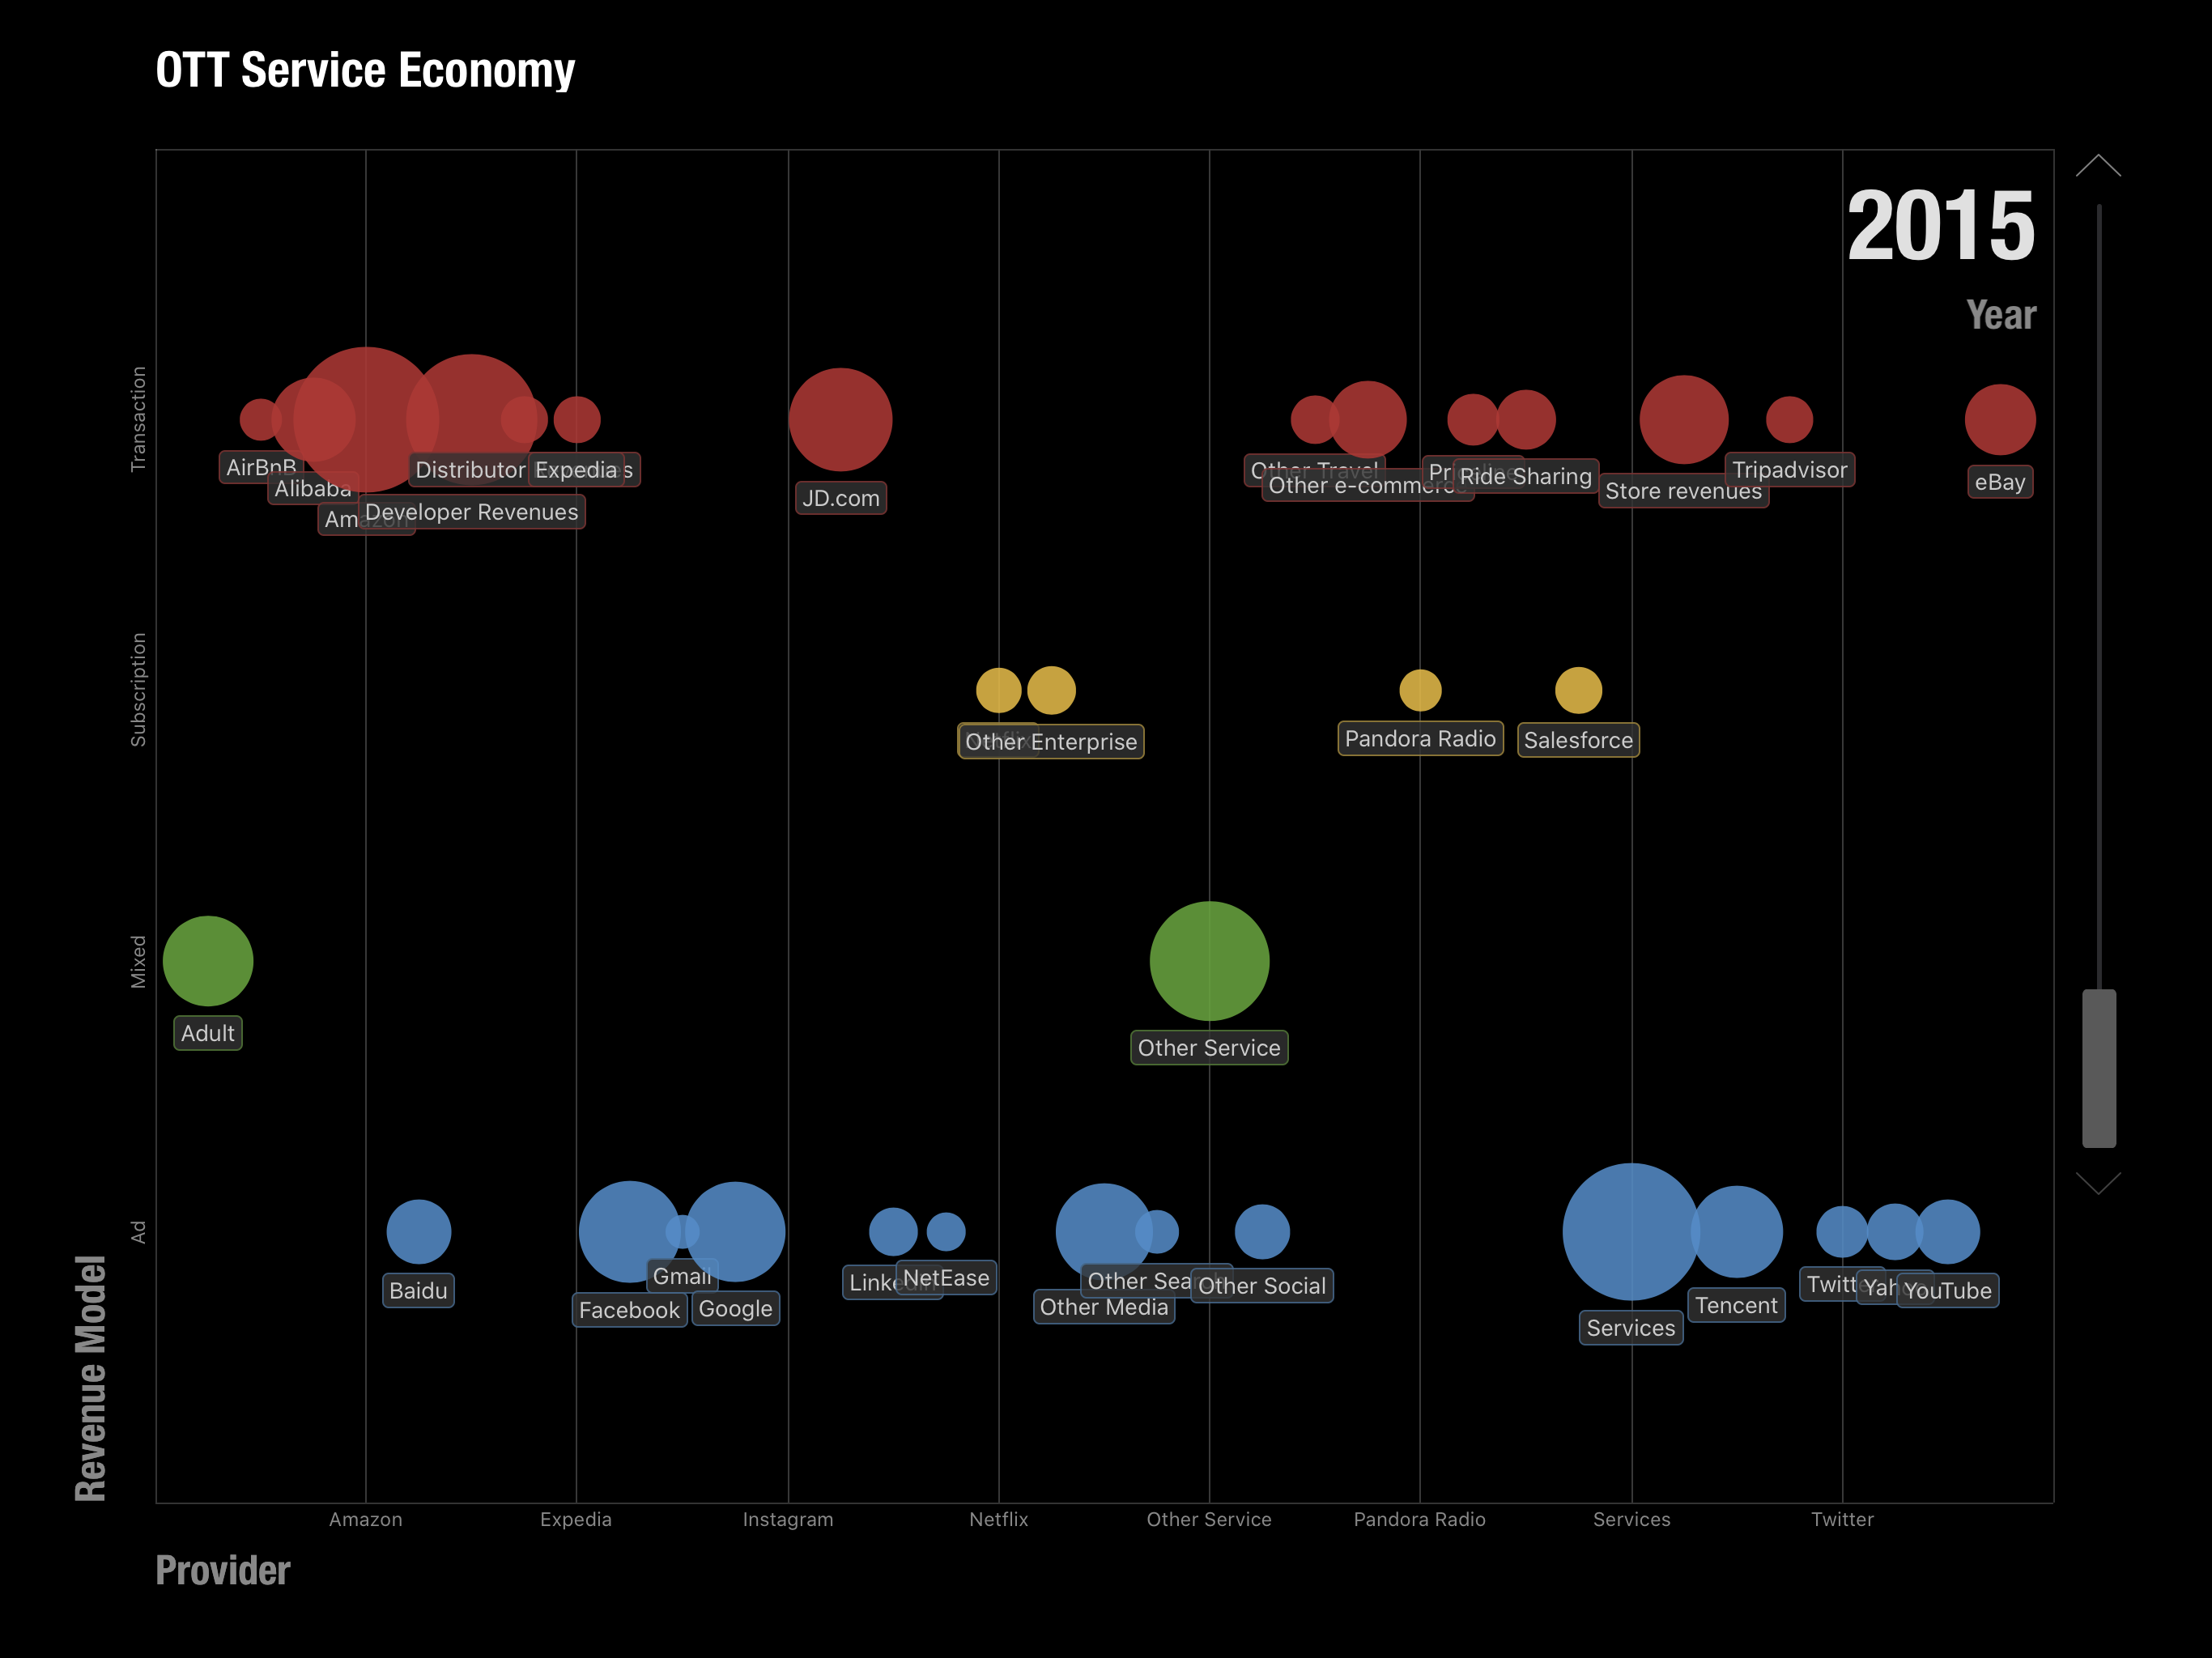
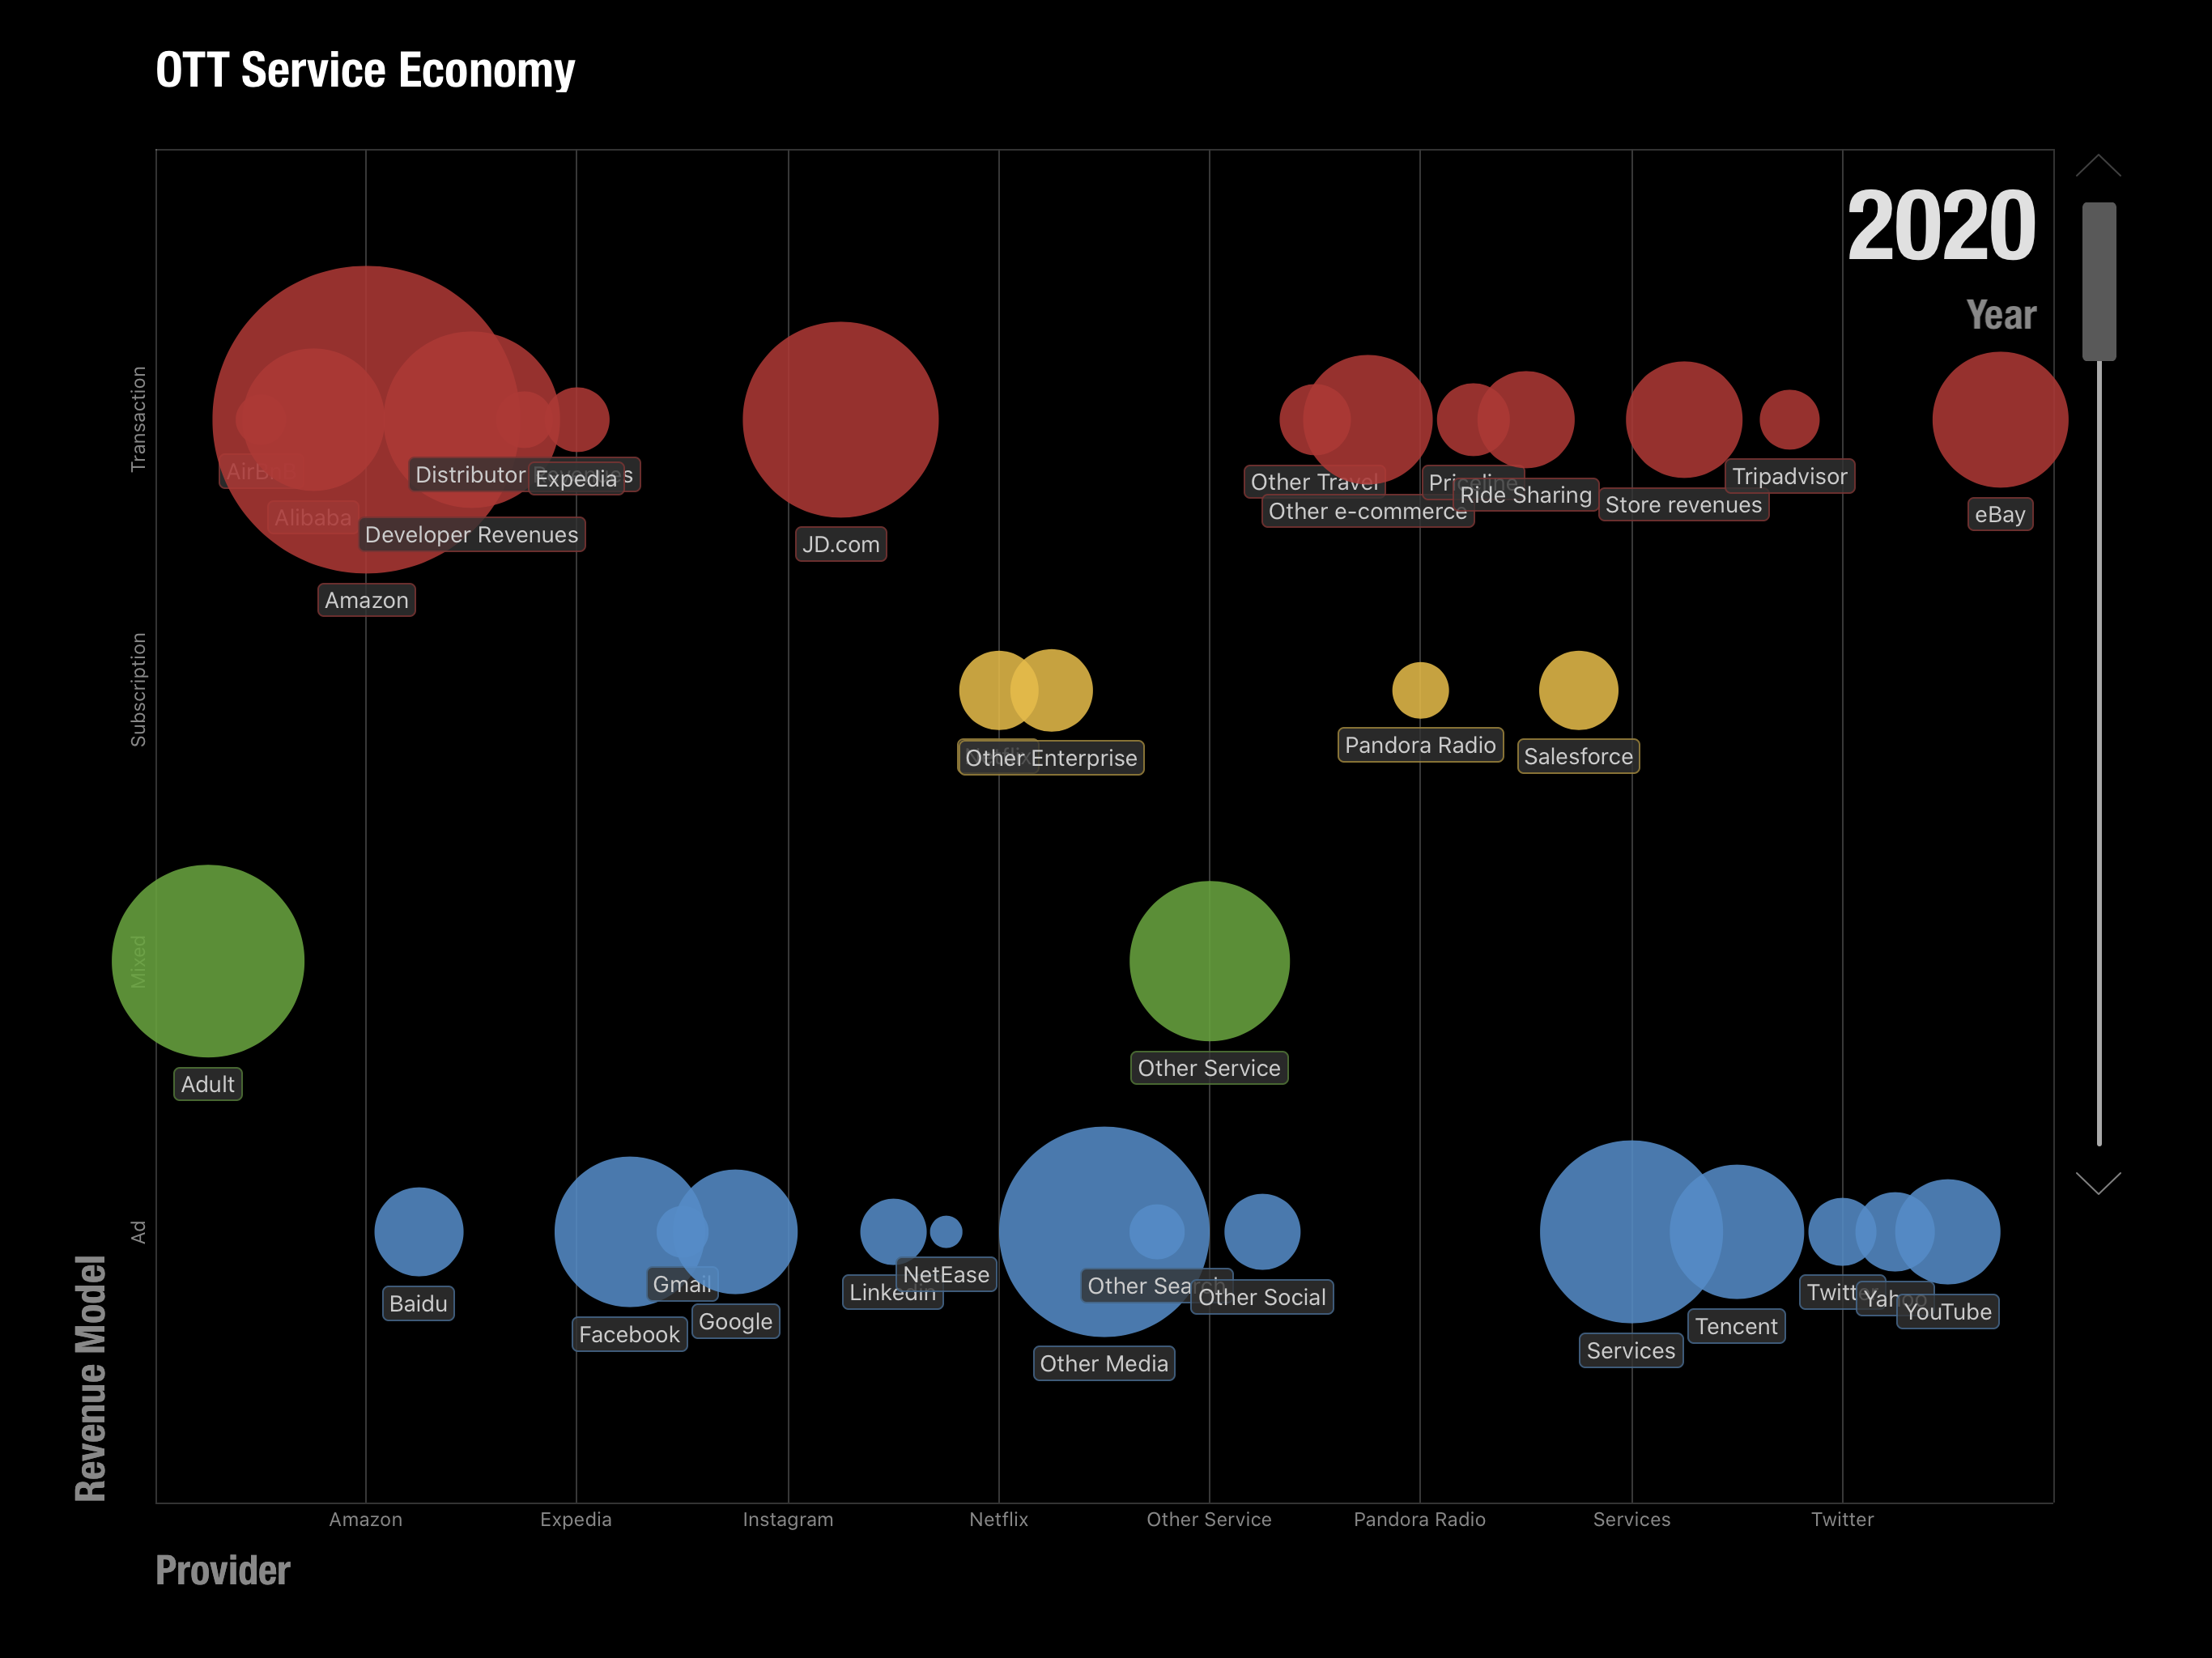
Revenues across Networks, Devices and Services 2015 to 2020 (estimated March 2016)Operating Income across Networks, Devices and Services 2015 to 2020 (estimated March 2016)Ecosystem composition (Third Party App, Native Apps, Other) 2015 to 2020, Android vs. iOS.Estimated mobile ecosystems total value by 2020 estimated in 2016.Over the top (OTT) service components by revenue model in 2015 estimated in 2016.Over the top (OTT) service components by revenue model in 2020 estimated in 2016.Allocation of OTT Revenues Across Service Types and Business Models and Platforms 2015 (estimated in 2016)Allocation of OTT Revenues Across Service Types and Business Models and Platforms 2019 (estimated in 2016)Composition of service revenues per user ($/year) for mobile platforms in 2015 (estimated in 2016)Composition of service revenues per user ($/year) for mobile platforms in 2020 (estimated in 2016)
Of course there are several potential errors in this methodology. The categories were not all inclusive. I used Social, Media, Search, Maps, email, Messaging, e-commerce, Travel, Enterprise, Storage, Transportation, Travel and Other as the top level categories. There are many products and services who would end up in Other. Moreover, these categories were anchored by the top companies in each category and the share of the top names was not always clear. Finally, the growth rates for these categories were based on historic trends which could change either way.
The online services ecosystem (all platforms) was thus estimated to be $450 billion in 2015, growing to $820 billion by 2019 and $914 billion by 2020.
The mobile split would vary by segment but would be roughly 75% by 2020 (25% would not be mobile). The final assumption was based on the split among the existing mobile platforms. I put a multiple of roughly 50% for iOS and 35% for Google Android and the rest for China Android.
Multiplying all these assumptions gave me a figure of $275 billion for the iOS portion of the global online services market in 2019. (Incidentally, Android was estimated at $207 billion and China Android $110 billion.) Note that this does not mean this was an expectation of Apple's revenues or that this was the opportunity of Apple obtaining any percentage of this revenue. It was simply the value of what would transact through iOS, a platform which would act as a commerce enabler. This was to be the size of the iOS "ecosystem" or co-dependency between Apple and the companies delivering through its platform.
Ecosystems are a powerful idea. As I recall, this term applied to mobile was coined by a Palm executive in the late 1990s when he referred to the value of all the apps built for the Palm Pilot. The biological term refers to the system of multiple species living in close proximity. It implies an equilibrium as each species benefits from the others and the environment. There might be predators and prey but biodiversity is the successful construct.
The idea of an ecosystem for a platform was also the core strength of Microsoft's Windows which created the network effects around it and it has been the goal of every platform since. The nature of computing and networking implies that these systems grow faster and are more resilient than the more traditional value networks of other businesses or industries.
Now this ecosystem was something we wished to highlight in 2016 as a core strength for Apple. It was not considered as such at the time and I thought putting a figure of $275 billion in 4 years' time was a way to highlight the potential. Time since has proven us right.
This week Apple highlighted the result of another research team who attempted to measure the iOS ecosystem. Their conclusion was that billings and sales facilitated by the Apple App Store Ecosystem in 2019 was $519 billion. More than twice the amount I had so optimistically forecast four years earlier.
The authors also emphasize that this is a conservative estimate and should serve as a baseline.
I feel partly vindicated about that figure as my attempt at a figure was intended to highlight the scope of the ecosystem and it is better to have underestimated it than overestimated it. The authors' methodology was also similar in being bottom-up summation of components by categories of services but the information available today is enhanced by the new data Apple made available on subs and Services revenues and install base.
Note that in the graph below the salient data points of subscribers (red triangles) had not begun until 2017 causing the acceleration in Services revenue (yellow line). Note also the additional square points representing install base.
This figure of more than half a trillion dollars of value transacted through iOS should give some pause. It it a very powerful figure that can be combined with the other data from Apple:
More than 1.5 billion active devices
More than 1 billion iPhone users
More than 500 million paid subscriptions
More than $1/day iPhone hardware revenues for Apple
The half-trillion per year on services implies between $335 and $520 in spending per user (likely closer to $500) per year. This would be in addition to the approximately $365/yr in hardware spending per user (which Apple books as hardware revenue). In the case of the iPhone there is yet more: the cellular network service which may average $350 per year.
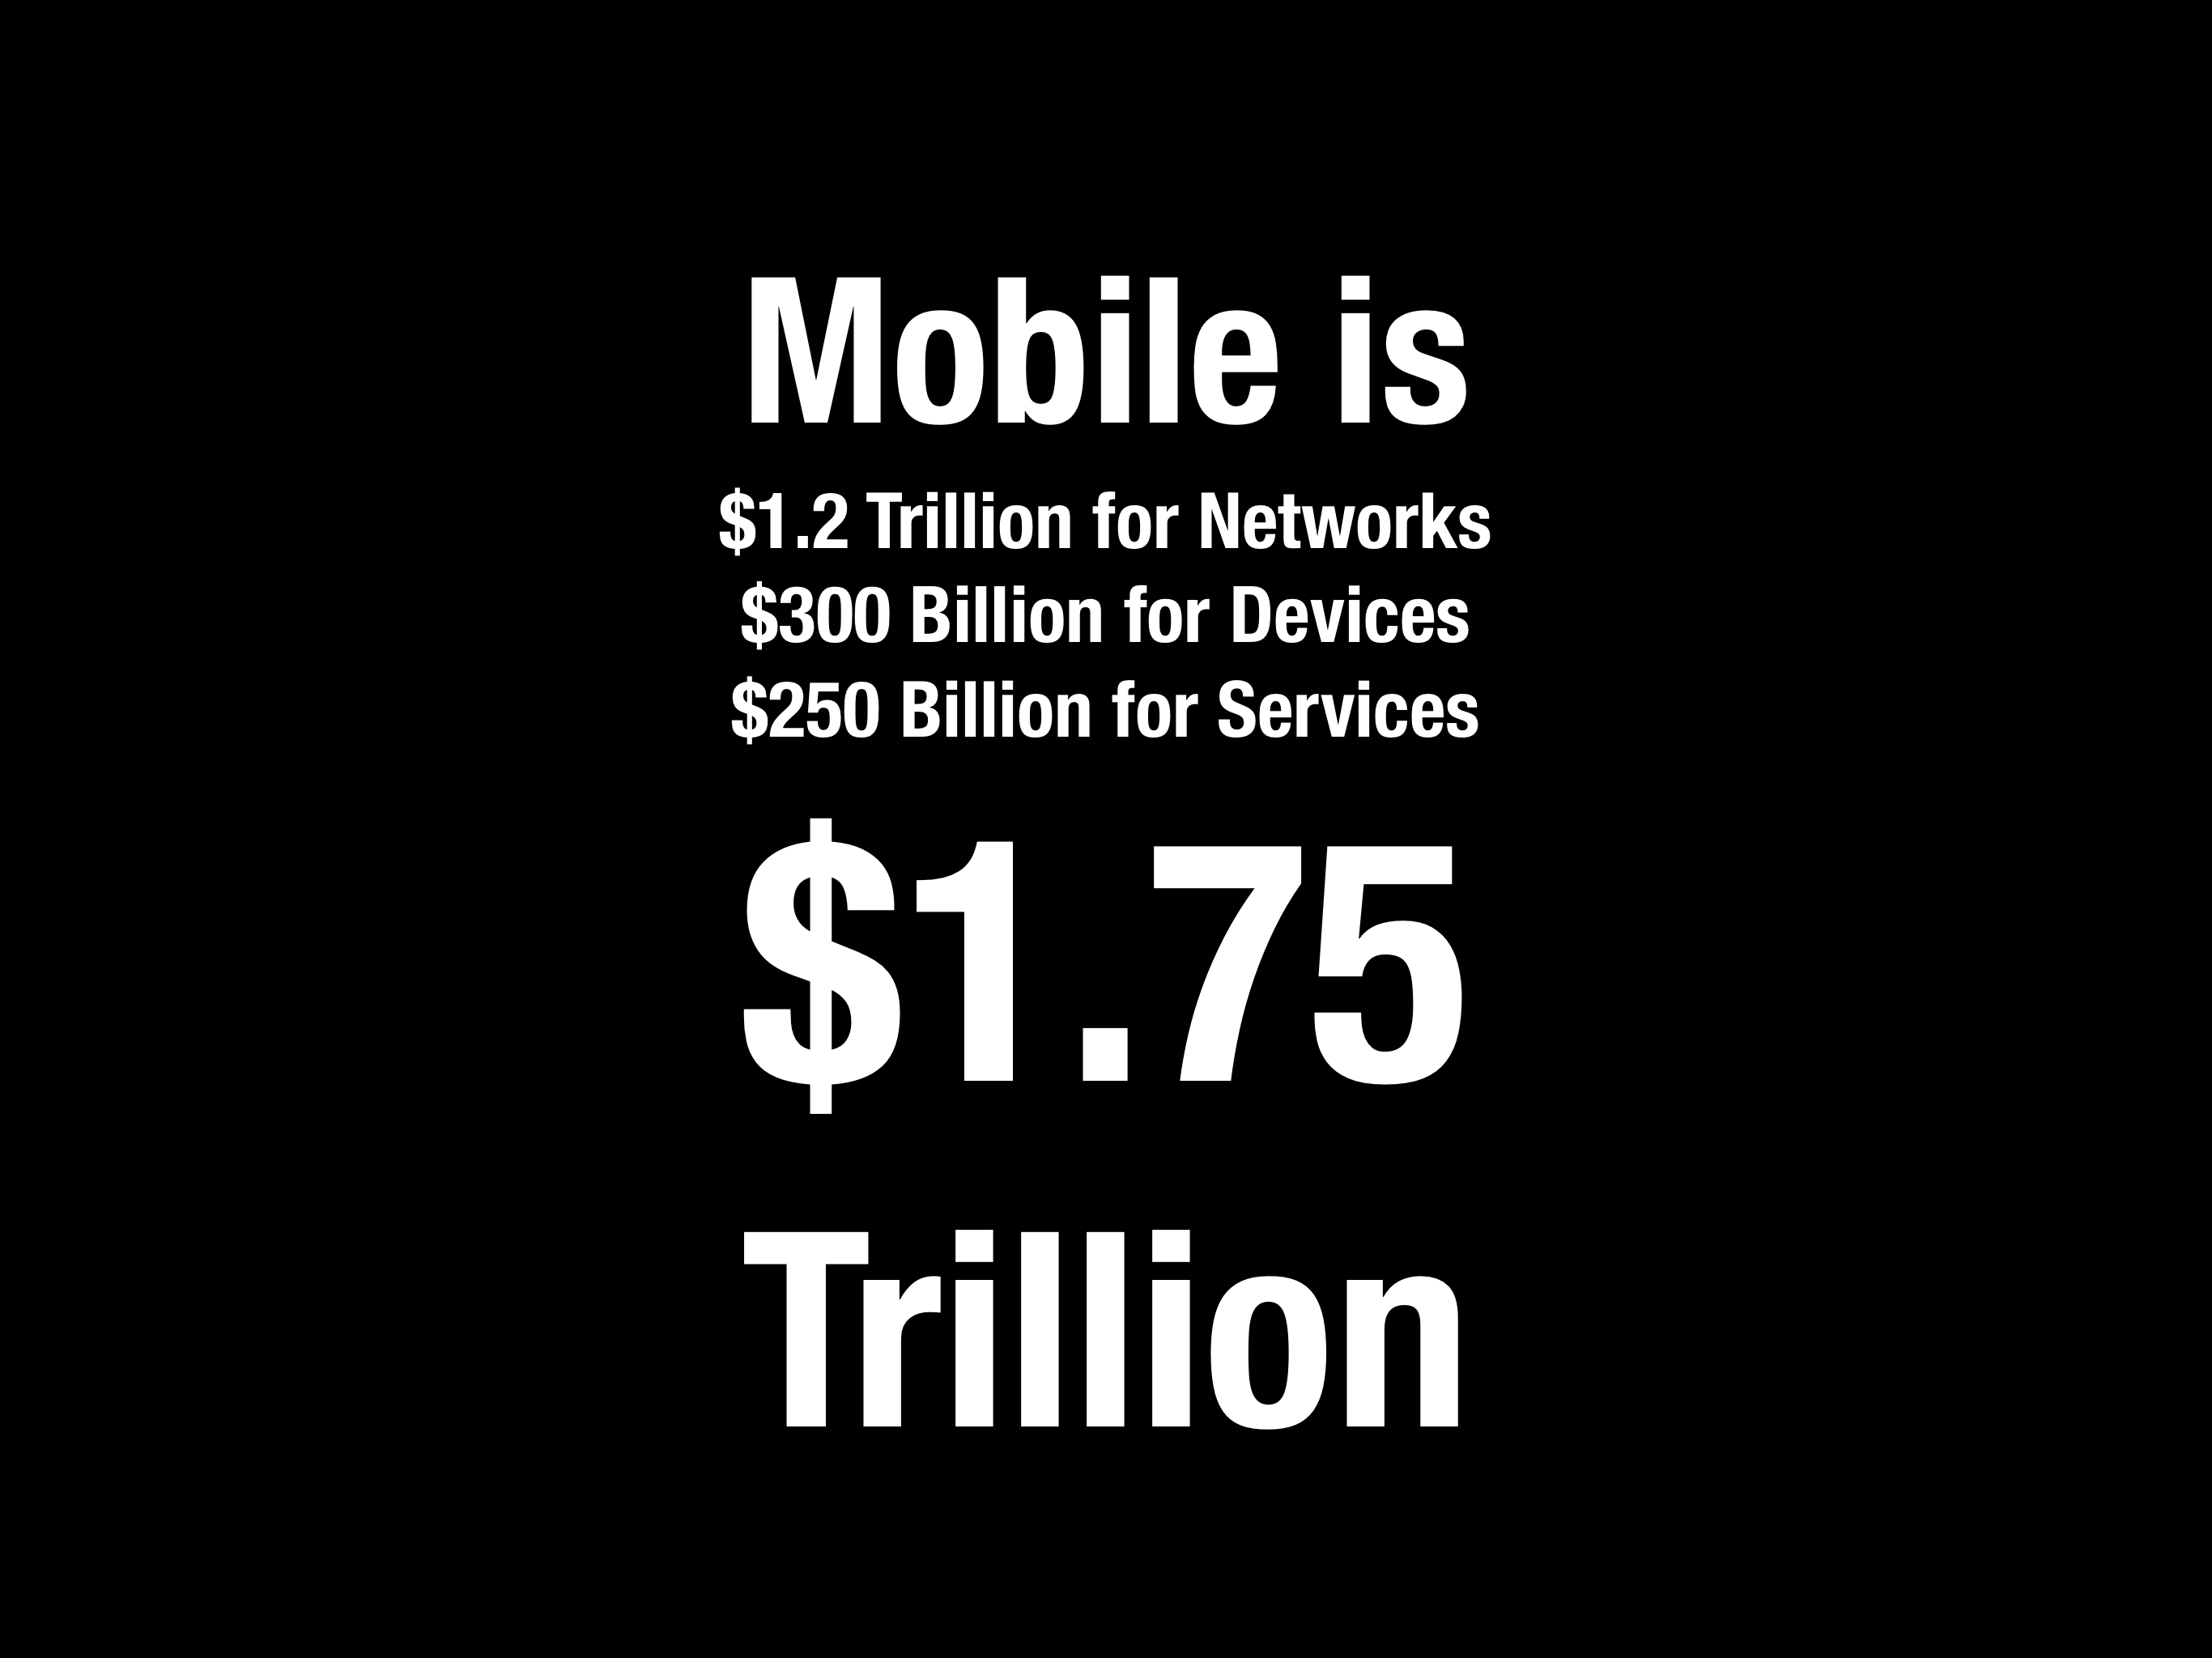
To simplify, the "average Apple user" spends $1/day for each device, $1/day for the network and $1.4/day on items bought through the device. Adding a margin of error, that's between $3.4 and $4 per day each user spends. Oh, and there are about a billion such users.
The total spending enabled by iOS thus is close to $1.4 trillion/yr.
That's a significant amount. It's bigger than many industries. There are only about 12 countries with higher GDP (Spain is about the same.)
How does Apple benefit from this?
Apple captures 30% of billings through its App Store. My estimate for these billings were $67.9 billion in 2019 which means App Store billings were 13% of the 2019 ecosystem. Apple's 30% cut of Billings amounts to 3.8% for the whole ecosystem. It's hardly an oppressive number.
If Apple only captures 3.8% what use is this to Apple?
The last decade has seen Apple emerge as the world's largest company in terms of market capitalization, and not doing so with a wild multiple of revenue or earnings, quite the opposite. It did this by creating the world's greatest customer base. Not in absolute scale. Android and Facebook have larger customer bases with multiple billions of users.
No, Apple's one billion users are simply the best billion users. They are the most likely to stick with Apple and they are the most likely to buy more from Apple and—this is crucial—they are the most likely to buy everything else. Those other companies whose sales come from Apple customers have been taking note. They know that Apple customers are desirable customers and choose to target Apple customers, as much as they can. Associating your company with Apple makes a lot of economic sense.
I will admit however that my argument that Apple created a customer base is contrived. The fact is that Apple creates productsand services and those products are the root of its power to attract the right customers. By choosing to create the best products it coincidentally chooses to create the best customers. The power flows from product not from pricing or positioning. This is a lesson lost for many.
Developers and regulators might feel Apple's massive power is perhaps too much. In the last decade, the narration around Apple has shifted from Apple being perpetually "doomed" to it being too dominant. Although I'm sure there are some who will try to conflate the two declaring that dominance will inevitably result in doom, most critics of Apple went from laughing (at it) to crying (about its practices).
The argument that Apple should change its practices developed to price as it does, distribute as it does or design as it does because it was too successful or is "unfair" is getting the causality wrong. Dominance won't be altered by a few points of percentage change (on a tiny fraction of ecosystem transactions). Fairness won't be altered when there are thousands of business models and many remain to be invented. Case in point is pornography which is not permitted on the App Store but which exists in abundance thorough other access methods.
The argument is that Apple should be more generous. That it should decrease the "cut" it takes for distribution. Or that it should not enforce revenue split for the customers it exposes to others.
But this is problematic on many levels. The playing field for all developers needs to be level. The customer must be respected and access to that customer should be constrained or certainly metered. Abuses must be policed and that requires leverage.
These practices are inter-dependent and the effect multiplicative, not additive. Apple has a monopoly on iOS and on MacOS and WatchOS and iPadOS. It does this to control the experience, security and safety of the user. It's that control which created the customer in the first place. It should naturally control access to its hard-earned customers.
It does not monetize the distribution of content or apps unless the developer/creator directly charges for the product or service. Distribution is not cost free and to offer it for free is a subsidy which would create additional market and innovation disincentives. The loyalty of Apple users is evidenced by the 600 million paid subscriptions (end of year estimate) that are booked through the App Store. Developers benefit directly as a result.
One could argue that the abundance of services which don't distribute through the App Store is evidence that the system works as intended. Apple's App store front is its property and it reflects its core values.
Being on the shelf in the App Store means you operate on the terms of the shelf owner. If the rules are not agreeable then the half trillion dollars of ecosystem activity is testament to the availability of alternatives.