To own Apple today, you need to believe its ecosystem can keep deepening even as growth expectations are already high and the stock trades on a premium multiple. The latest quarter’s US$143.76 billion in revenue and US$42.10 billion in net income, powered by iPhone 17 demand and a rebound in China, reinforce that story, while expanding AI features and services aim to make each device more valuable over time. The upcoming low cost MacBook fits neatly into this, extending macOS and Apple Intelligence to more price sensitive users without changing the core near term catalysts, which still sit around iPhone 17 uptake, AI rollouts and services momentum. Key risks feel more about execution and sentiment: memory cost pressures, high expectations baked into the price and any cooling of AI enthusiasm..
NB: Another money quote: "An interesting angle is how design-led appeal in China, such as the viral “Cosmic Orange” iPhone 17, combined with new AI features across devices is reinforcing Apple’s ecosystem pull for both consumers and developers."
I tried but failed to connect how Cosmic orange is reinforcing Apple's ecosystem pull for consumers and especially developers.
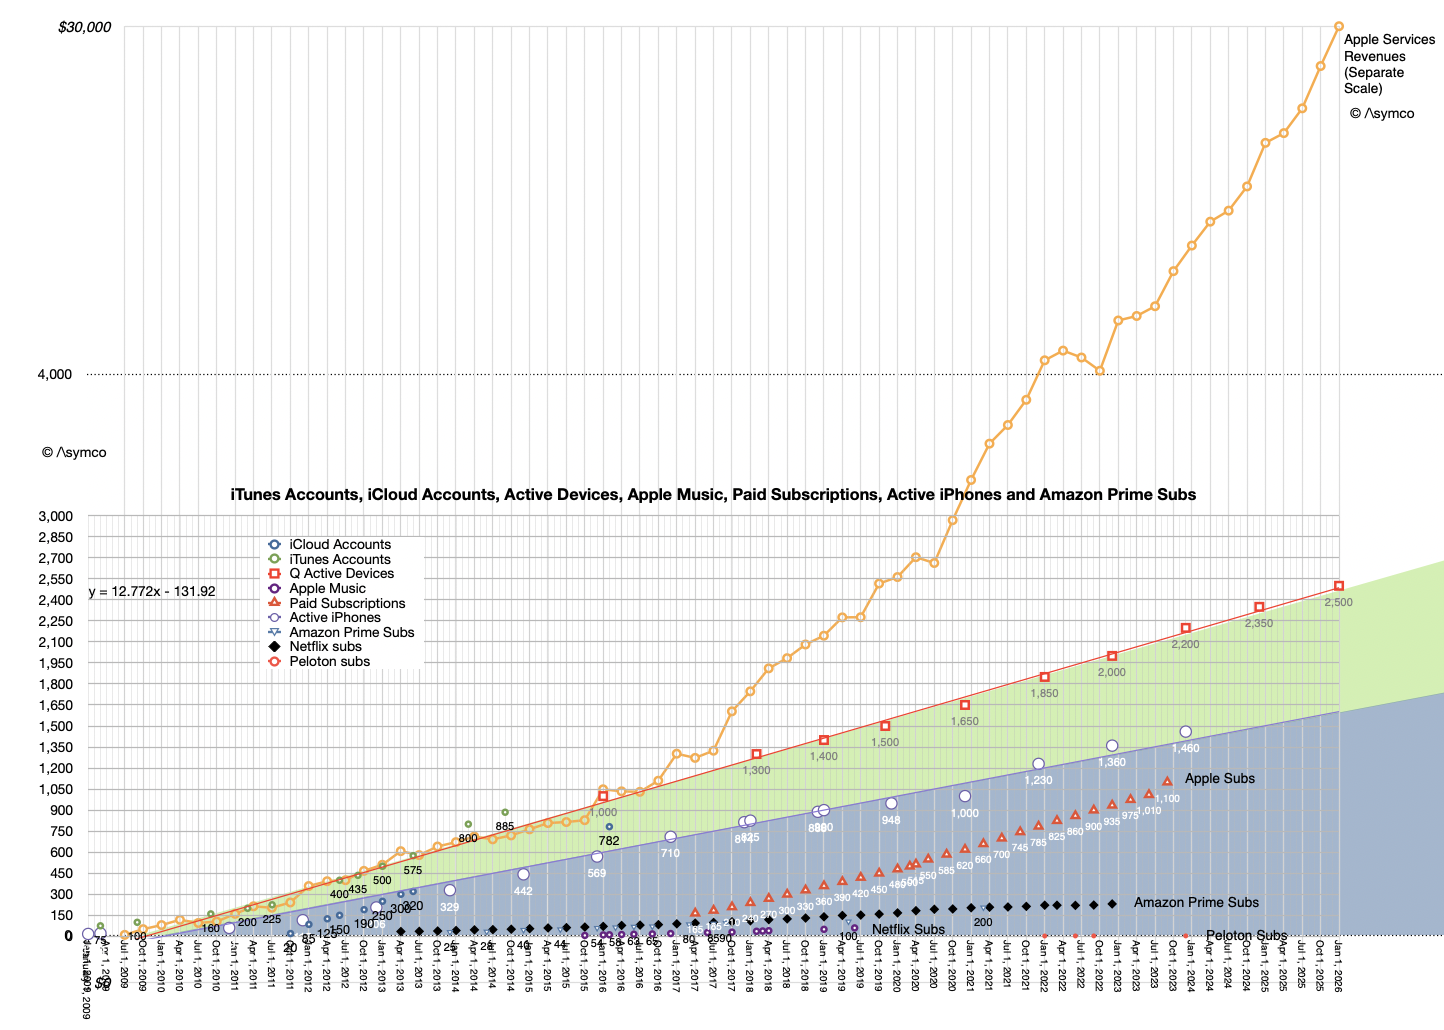
We are proud to report that we have a new record for our installed base with more than 2.5 billion active devices. -Tim Cook
2.5 billion active devices follows the announcement of 2.35 billion active devices a year ago, a growth of 150 million devices in one year. Let's examine some of the implications.
By my estimate, Apple sold about 250 million iPhones, 23 million Macs, 40 million Watches, 70 million iPads. Other devices including Apple TVs, Apple Vision Pro, Apple HomePods may add another 10 million units. Therefore the total number of "connected" devices sold is around 400 million/yr.
Adding 150 million to the active base in one year implies that 250 million devices are replacements, many surely are reused but also at least a third (37.5%) of units sold are expanding the base. This is reflected by management's occasional mention that "nearly (or, alternatively, over) half of customers who purchased a <product> being new to the product".
In the last quarter and for quite some time, <product> has been the Mac, the iPad and Apple Watch. If we use my estimates of units sold during the full year that means 17 million Macs, 20 million Watches and 35 million iPads were sold to new users. These add up to 72 non-iPhone new devices in use. That suggests about 78 million new iPhone users.
How does this compare to the following pattern:
The line to focus on is the red with square points. "Q Active Devices" is the history of what Apple calls "Quarterly Active" devices or those which ping an Apple server at least once a quarter. The data appears to be linear, or the growth is about 150 million per year at least since 2016. Historic data on the iPhone is also shown with a blue line. That is also consistent with about 100 million new iPhones in use every year. This is a bit higher than the 78 million bottom-up analysis of new users. I'd argue that Watch numbers may be a bit too high and perhaps iPad as well.
The mix is a matter of debate but overall this consistency allows for some confident forecasting.
The iPhone will reach 1.7 billion active users by this time next year.
There will be three billion active devices by early 2029.
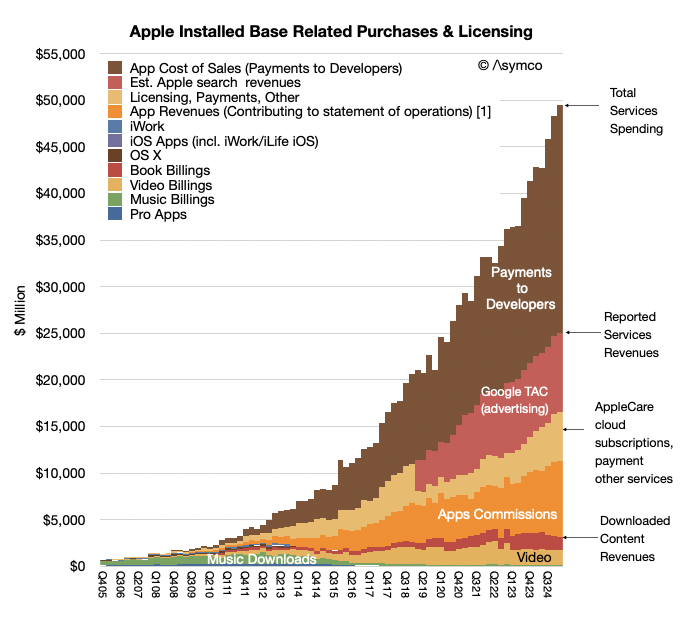
Services, which is shown in the second graph is clearly correlated to active device growth.
The consistency in active device growth is far more important than device sales in a particular period and determines the value of the company.
Knowing this, here are some additional observations:
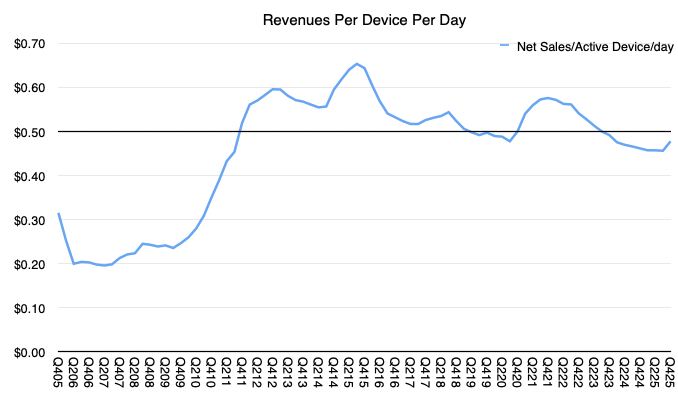
Yearly revenues per active device are $129, services revenues per active device are $45 for a total revenue per active device at $174/device/yr. That is equivalent to 48c/device/day. Data shows that daily revenues have been an average of 53c/device/day for 59 quarters. My rule of thumb is 50c/day per active device is a good estimate for Apple's revenues, and estimate that I have been holding for over 14 years.
There are additional implications. With a base of 1.65 billion iPhones, and knowledge of replacement vs. new-to-product/switcher growth what is their average lifespan and thus replacement rate and therefore what is the average selling price?
While the commentariat assumes the worst, Apple delivers the best.
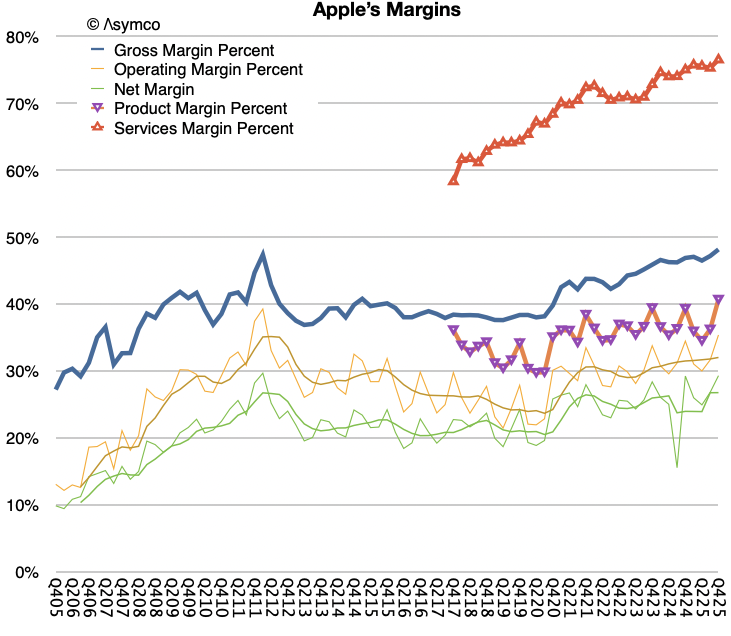
Last quarter Apple delivered a gross margin of 48.2%. This was above the high end of their guidance range and up 100 basis points sequentially. Management commented that this was "driven by favorable mix and leverage."
Further, products gross margin was 40.7%, up 450 basis points sequentially, driven by favorable mix and leverage. Services gross margin was 76.5%, up 120 basis points sequentially, driven by mix.
This performance is even more astonishing considering the history shown below. Apple is quite simply, delivering at the highest gross and net margins in its history.
Note that the graph actually projects forward one quarter because we have the following guidance: "We expect gross margin to be between 48-49%." The graph reflects the high end of this guidance range.
So what's going on? Especially as a drumbeat of constant doom is being broadcast by pundits. The conference call itself seemed to be dedicated to margins. It became what I call the Margin Call.
Amit Daryanani, the first questioning analyst, specifically kicked off with the following:
"there is a lot of focus on the impact of memory to host the companies, and I would love to kind of get your perspective when you are first guiding gross margins up into March. Talk about, a, your comfort in securing the bit that you need for shipment and b, how do we think about memory inflation flowing through Apple's model over time?"
Tim Cook answered:
We are currently constrained, and at this point, it is difficult to predict when supply and demand will balance. The constraints that we have are driven by the availability of the advanced nodes that our SoCs are produced on. And at this time, we are seeing less flexibility in the supply chain than normal, partly because of our increased demand that I just spoke about. From a memory point of view, to answer your question, memory had a minimal impact on Q1. So the December gross margin. We do expect it to be a bit more of an impact on the Q2 gross margin, and that was comprehended in the outlook of 48 to 49% that Kevin gave earlier.
what Apple is saying is that they are constrained by production of silicon but not of memory. They do see some impact in the future but that is included in a guidance of margin expansion.
Analysts still could not believe this, the following exchange soon followed:
Ben Reitzes: So the next question is on gross margin. I am pretty shocked I gotta hand it to you, Tim. I am, you know, that you are able to do 48 to 49. What is really going on there? How are you doing that with this memory, the NAND prices? Is it due to mix that there is a good less hardware and more services? Services and services margins are going up. How are you doing it to keep it at 48 to 49?
Kevan Parekh: Yeah, Ben. This is Kevin. [] Let me start maybe by just reflecting on the Q1 gross margin. I think we talked about the fact that we landed at 48.2%, so just above the high end of the range we provided, [], on the last call. [] if you look at that performance, [], we were up 100 basis points sequentially. We talked about the fact that we had favorable mix. [], as you know, when we have a good product cycle, strong price cycle we are seeing for iPhone, that does lend itself to a bit more favorable opportunity on the [] leverage side.
So we are having a strong iPhone cycle as Tim outlined. And so that also translates itself. So we talked about products sequentially went up by 450 basis points. So I think, in general, I think we are just seeing, [], favorable mix dynamics as well. [], service continues to contribute as well. That business is growing, [], double digits, so that also is a contributor. And I think that, [], if you looked at our guidance, [], we are providing a similar range to where we reported in December. There are going to be a few puts and takes. [], we do expect to see favorable mix in the services.
As you know, when we move from Q1 to Q2, that tends to be the case, and that is partly offset by a seasonal loss leverage. So there will be puts and takes, but again, we feel pretty good about the guide of 48 to 49%, which is similar to the range we reported in December.
Still not enough. Two more questions followed on margin. I will quote one here.
Aaron Rakers: Yep. And then as a quick follow-up, you know, kind of tied to memory, maybe not so much, but part of this current generation iPhone cycle is you clearly deepened some of your own internal silicon capabilities on the device. I am curious if that if we should think about that as a lever and maybe a supportive factor to gross margin that might be underappreciated and any thoughts on where we go from here as far as continual opportunities of internalizing your own silicon? Thank you.
Timothy D. Cook: Yeah. I will let Kevin talk about the gross margin. But in terms of the product, which is at the heart of what we think about in the user, Apple silicon has just been an incredible game changer for us. Starting with iPhone and then on iPad and, of course, the Mac as of a few years ago. And so we believe it is a game changer and a major advantage.
Kevan Parekh: Yeah. And as far as impact on gross margin, yeah, we have been, as you know, investing in core technologies like our own silicon and our own modem. And certainly, while those do provide opportunities for cost savings and can be plugged in margins, they also importantly provide, [], the differentiation that is really important for our products as well and us more control of our roadmap. So I think there is a lot of strategic value to it, but also we are seeing, [], investments in our core technologies impacting, [], gross margin in a positive way.
After all this, the financial commentariat continues to assume that Apple will be hit with margin pressure from memory and that has presumably been affecting the share price since the call.
Well, we've seen all this before. Before the great memory crisis Apple was going to be constrained by tariffs, by China, by developer dissatisfaction, by AI, by regulators, etc.
The feeling one gets is that Apple is always navigating through a minefield of pitfalls and gotchas. The opposite is true. It's highly likely that Apple has sufficient leverage which increases its access to supply and that everyone is keen to work with the company. Leverage comes from scale, from lead time, from vertical integration and from engineering. Management is saying as much. Indeed, the evidence of leverage across the supply chain and over the entire ecosystem and economy is evident in its margin expansion story told in the graph above.
Apple is set to report its strongest iPhone sales growth in four years on Thursday - and likely the company's best quarterly revenue to date…
Strong iPhone sales expected to power record Christmas quarter for Apple appeared first on MacDailyNews.
In China and developing markets, Apple drew customers with the refreshed camera design and higher storage capacity of the latest Pro devices.
The company led the global smartphone market last year with a 20% share, according to research firm Counterpoint, up from 18% in 2024.
Overall, Apple is expected to report that iPhone sales rose 13.8% in its October-December fiscal first quarter, according to analysts polled by LSEG. That would mark the strongest growth in more than four years.
Total revenue likely increased 11.4% to a record $138.43 billion, aided by a 14.1% jump in Apple’s the services business.
In Greater China, sales likely jumped about 15%, according to Visible Alpha data.
Some investors believe Apple can make money from AI without the massive infrastructure investments pledged by its Big Tech rivals.
“Apple can probably generate a positive return on very little AI investment, thanks to its distribution,” said Gerrit Smit, manager of the Stonehage Fleming Global Best Ideas Equity fund, which holds Apple stock.
As we approach the earnings release for the first fiscal/fourth calendar quarter for Apple, it's time to look back three months at what the company delivered and guided in the previous quarter.
The summary for results for fourth (fiscal) quarter of FY2025:
Revenue up 8% year-over-year, a new September quarter record.
EPS was up 13% year-over-year.
Product revenue was up 5% year-over-year driven by growth across iPhone and Mac.
iPhone revenue was up 6% year-over-year, and set a September quarter record despite supply constraints faced on several iPhone 16 and iPhone 17 models.
The iPhone active installed base grew to a new all-time high and had a quarterly record for upgraders. Also, Apple reached a new all-time high for installed base of active devices.
Mac revenue was up 13% year-over-year, driven by MacBook Air. Apple grew in every geographic segment, with strong double-digit growth in emerging markets. Mac installed base reached another all-time high, with nearly half of customers who purchased a Mac being new-to the product.
iPad was down 3% revenue and but over half of the customers who purchased iPad this quarter were new-to the product. iPad also had a September quarter record for upgraders.
Wearables, Home & Accessories Revenue for the category was flat y/y. Apple saw a September quarter record for upgraders to Apple Watch, and over half of Apple Watch buyers were new-to the product.Both the Apple Watch and AirPods installed bases reached new all-time highs.
Services again set a new all-time revenue record up 15% year-over-year. Apple saw double-digit growth in both developed and emerging markets. Apple saw a sequential acceleration across the majority of the categories and set new all-time records across Advertising, App Store, Cloud Services, Music, Payment Services, and Video. Apple saw a double digit growth in Apple Pay.
Guidance was provided as follows:
We expect iPhone revenue to grow double digits year-over-year, which would be our best iPhone quarter ever. On Mac, keep in mind, we expect to face a very difficult compare against the M4 MacBook Pro, Mac Mini and iMac launches in the year ago quarter. We expect Services revenue to grow at a year-over-year rate similar to what we reported in the fiscal year 2025.
We expect gross margin to be between 47% and 48%, which includes an estimated impact of $1.4 billion of tariff-related costs. And so for the December quarter, we expect operating expenses to be between $18.1 billion and $18.5 billion. We expect OI&E to be around $150 million, excluding any potential impact from the mark to market of minority investments and our tax rate to be around 17%.
Based on these forecasts my estimates for the top, bottom and middle lines are as follows:
Revenues: $140 Billion (+12%)
EPS: $2.70 (+12.5%)
iPhone: $78.9 Billion (+12%)
Mac: $9.4 Billion (+4%)
iPad: $8.5 Billion (+5%)
Wearables: $12.9 Billion (+10%)
Services: $30 Billion (+14%)
If there is an error in the above I would guess it's in iPhone being too low and the iPad/Mac and Wearables being too high. Nevertheless, I think this will be Apple's biggest quarter ever with significant growth acceleration on the top and bottom lines. [Notable will also be a rapid acceleration in R&D spending (+25%) as suggested by guidance.]
As we head into this blockbuster quarter, Apple shares are trading at a P/E ratio of 32 to 33, a significant drop from above 35 during previous few quarters. During the last three months, the share price has declined about 15% as Mr. Market looked at the money mountain above and decided he wanted none of it.
According to JP Morgan analyst Samik Chatterjee, citing Sensor Tower, Apple's App Store revenue for May 2025, increased by 4.9% month-over-month (which compares to an average sequential increase of 2.3%) and an acceleration of year-over-year revenue to 13.0% in May versus up 11.8% in April. On a year-over-year basis, the App Store downloads increased by 3.1% in May (versus +5.8% in April) according to Chatterjee.
This analysis is based on app download sampling and may be indicative of the activities of consumers on the App Store. Services revenue in the first calendar quarter was $26.6 billion, up 12% year-over-year and at an all-time revenue record. Services gross margin was 75.7%, up 70 basis points sequentially, also an all-time record.
The world however seems to be having a problem with Apple Services. After years of skepticism of its relevance, now that it has achieved a run level above $100 billion/yr., it's being criticized for being harmful to competition.
The comments that it's unfair to developers or that it deters innovation are uninformed to say the least. What is missing from that analysis is that the App Store is only a small fraction of the entire ecosystem around Apple's platforms and that the economic activity the platforms enable is immense.
Let's learn.
Over the last year Apple reported a bit more than $102 billion in revenues for Services at a very high margin. The reason it was such a high margin was partly due to the fact the Services does book all payments from customers through the App store as revenues. In other words it does not include payments to developers as either revenue or costs. Those payments pass through but they are certainly part of the economic activity on the store. It would be indeed unusual for a physical store not to report what it pays for what it sells as part of revenues. But this is the basis Apple chose (or was obligated to choose) as the way to report App Store revenues.
Thus considering the payments to developers, the economic activity directly related to the App Store amounts to $120 billion/yr which includes commissions of about $30 billion/yr (last 12 months) and payments to developers of about $90 billion/yr (implying about 25% blended average commission rate.)
So including payments to developers the Services business grosses $186 billion/yr. of which 102 billion is reported as revenue, with the 75% gross margin and $90 billion is paid to developers "off the books".
But that $102 billion in revenues is only about 30% App Store commissions. The rest includes many types of income: It includes:
Advertising which consists of Apple's own advertising services and third-party licensing arrangements notably the distribution fees for Google search (accounting for most of Googles "TAC" or traffic acquisition costs.
AppleCare, Apple's own extended warranty service.
Cloud Services which provide content synchronization.
Digital Content which not only includes the App Store but also stores for books, music, video, games and podcasts. Apple also offers digital content through subscription-based services, frequently bundled, including Apple Arcade, essentially a game subscription service; Apple Fitness, a personalized fitness service; Apple Music, which offers music streaming and on-demand radio stations; Apple News, a subscription news and magazine service; and Apple TV, which offers exclusive original content produced by Apple and live sports access licensed sometimes exclusively by Apple.
Payment Services which offers Apple Card, a co-branded credit card, and Apple Pay, a cashless payment service.
The quarterly view is summarized in the graph above. So a fixation on the commission is only a view into 16% of Services as an economic foundation (the orange area in the graph above).
But that's still only a sliver of the whole picture.
A report written by Jessica Burley, Analysis Group and Professor Andrey Fradkin, Boston University Questrom School of Business has estimated that the global App Store ecosystem facilitated $1.3 trillion in developer billings and sales in 2024. As the report writers say: "For more than 90% of the billings and sales facilitated by the App Store ecosystem, developers did not pay any commission to Apple."
How is this not visible? The reason is that this economic activity is distributed over the millions of purchases Apple users make through its iOS Apps every day. This includes traditional App Store "Billings" including paid downloads and in-app purchases, including subscriptions, that use Apple’s in-app purchase system and “Sales” which includes money spent by customers purchasing goods and services in general using any iOS and iPad OS apps. Apps developed by Apple such as Apple Music, Safari or browser apps such as Chrome are excluded from this analysis.
The economic activity unleashed by the App Store now reaches well over $1.3 trillion/yr. As the authors further explain,
While the present analysis captures the major app monetization strategies available to developers, the full economic impact of the App Store ecosystem extends beyond the estimates provided in this report, as the current methodology does not capture all of the ways in which the App Store ecosystem facilitates sales, or all of the benefits created by apps. For example, the App Store supports “companion apps” that raise the value of a company’s goods and services, including smart home apps and health apps. In addition, many apps now use different monetization strategies. As such, this analysis does not account for all the ways in which the App Store ecosystem creates value.
Furthermore the report breaks down the categories as Digital Goods and Services, Physical Goods and Services, M-Commerce (General Retail, Travel, Food Delivery and Pickup, Grocery, Ride Hailing), Digital Payment and In-App Advertising.
In addition the report estimates these categories from 2019 as well as 2024 providing a growth perspective: Over the past five years, the App Store ecosystem has more than doubled in size, increasing from $514 billion in 2019 to nearly $1.3 trillion in 2024.
It also identifies regional dynamics between the US, China, Europe (with select countries) and Rest of World (with select Asian countries).
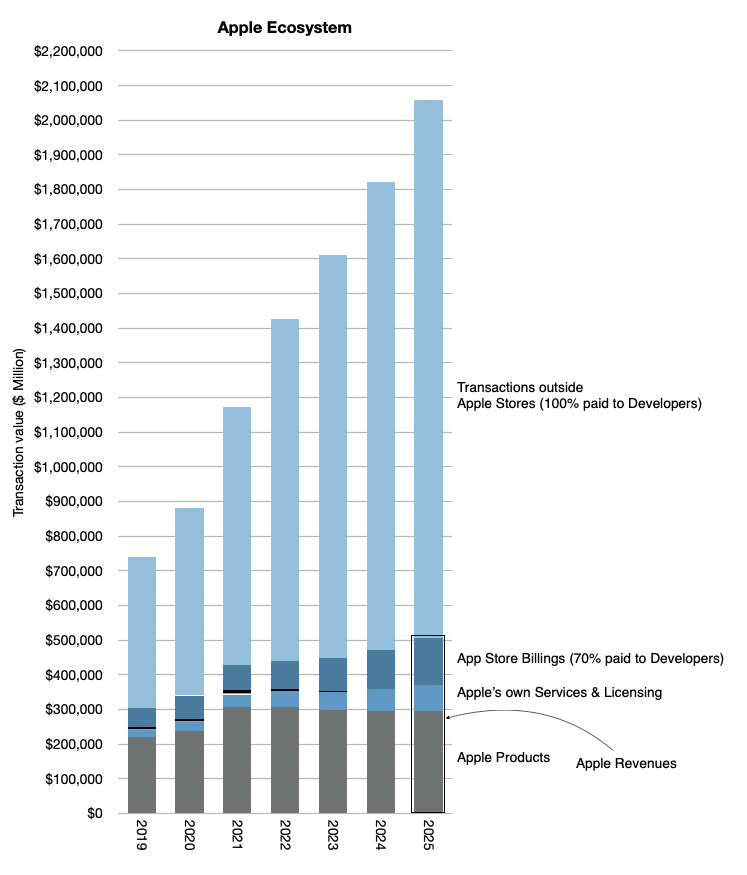
I've been keeping my own analysis of what I called the Apple Economy and it includes these transactions outside the App Store and Apple's own products and services. If I were to subtract Apple's own revenues from the total, for 2024 I was getting about 1.4 trillion (out of a total of over 1.8 trillion).
My point was always to estimate the economic impact of Apple beyond its own sales. This gave us perspective to assume that in 2025 the total would reach over $2 trillion. The graph below gives the perspective which also implies a doubling since 2020 to 2024.
The new report from Burley and Fradkin is a detailed, bottom-up analysis which quantifies what was perceived as the economic value of Apple being far more than what the financial data records.
Bill Gates once stated in reference to Zuckerberg's assertion that Meta was developing a "platform" that it's not a platform unless the economic value of everybody that uses it exceeds the value of the company that creates it.
Apple captures about $30 billion as sales but delivers over $1.3 trillion in sales, a multiple of 43! I would call that generous. In addition it doubles the market in 4 to 5 years. I'd call that market expanding not constraining. Finally, it's a market that Apple created out of nothing. I'd call that market creation not destruction.
If judged on the question of creation and satisfaction of the customer, i.e. the ultimate purpose of the firm, the App Store and Services in general has satisfied 1.4 billion people. That they are spending over $1.3 trillion and doubling in 4 years is nothing short of astonishing.
We'll discuss this topic and other topics related to Apple at ACTIVE: The Apple Investor Conference, which takes place on next Tuesday, June 10th, the day after the WWDC25 keynote.
It’s Labor Day in the US (and Canada, though not anywhere else where it’s celebrated on May 1st.) This would be a good time to discuss Apple’s primary challenge.
Writers whose unfortunate job is to cover Apple inevitably put forward lists of “challenges” faced by the company. It really is not possible to write or speak about Apple without manufacturing one’s own list of problems, obstacles, difficulties, rising competition, inevitable transitions, strategic failures, and the lack of innovation.
For instance, as recently as a week ago, in an article announcing the change in CFO, a pundit noted that “[the new CFO] Parekh's main challenge will be navigating ongoing antitrust lawsuits. ‘These are challenging times for Apple on multiple fronts’, citing increased regulation, EU scrutiny, and growing competition in China.” Challenging times for Apple. Surely not like previous times which were not challenging at all.
I Googled “challenges facing Apple” and top hit was a list from CNN dated January 25, 2024. The tag line "It’s only a few weeks into 2024, and Apple’s year ahead is paved with trouble.” A discussion of its doom in China is followed by an Apple Watch ban challenging Apple “reputation”. Surprisingly, being behind on genAI and the existential crisis AI will bring only showed up third. Then came “revenue concerns” because of reasons and finally, being a regulatory target around the world rounded out the top five.
Clearly, repeating this exercise every few weeks would allow an entirely new list to be created with a completely fresh dose of dread. As the previous list fades in memory a reminder on your iPhone should get the list generation started on time. [AI only makes this easier.]
But what none of these lists seem to include is what I consider to be Apple’s primary worry. I believe this is the one thing that keeps Tim Cook awake at night. This being the preservation of employee morale.
As evidenced by what I get as questions and what is enumerated endlessly, what most people don’t understand is that Apple is exceptional because of the combination of culture and talent and not the particular circumstances it finds itself in. Listicles of circumstances are easy to generate but a good management system is resilient to circumstances and indeed anticipates them or makes their own. The thing that Steve Jobs built was a mechanism that converts the talent and dedication of great people into product that is genuinely adored by the people who use it. That mechanism is beyond a set of rules. It’s culture.
“Build” culture sounds far too vague and simplistic, but the reality in almost all other (large) organizations is that almost all talent is wasted. That primary asset, its employees, is perhaps less than 10% applied to the benefit of users. Much of it is wasted in politics, frictions, pointless disagreements, burning out, and what I call “creative inefficiency”. If Apple could just waste only 60% of its employees’ contributions it would be four times better than average and probably be the most effective company in the world.
Culture is what makes the application of talent effective and efficient. It is the magic sauce. And losing that culture would be the greatest existential threat to the company.
So on Labor Day our reflection should be on how to keep what is now a very, very large organization meaningful to each and every employee. The CEO’s efforts should be prioritized on customers first but employees second (and shareholders at best, third). This means inducing employees to be creative and productive and keeping them in that state of “flow" for the duration of their employment. For top management it’s even necessary to keep their loyalty and dedication *after* their employment ends.
The methods vary and are some of the most secretive aspects of Apple. As I said many years ago, many want to copy Apple’s products but few want to copy being Apple. That is mostly because few even know what Apple is and how it works. Having said that, I would like to put forward some observations on “the Apple way” of management.
1. Provide incentives for employees to stay in the same functions as long as they continue to improve their skills. This means focusing on becoming better at their craft rather than “grooming” them for climbing the corporate ladder.
2. Preserve a functional organization. Obviously this means avoiding market-driven or matrix org structures.
3. Tap individuals to become managers only if they exhibit management skill. This is far harder than it seems. Few highly talented individuals in a particular area of expertise want to give up practicing in order to become a general manager.
4. Avoid political in-fighting by maintaining separations between functions and deciding budget allocations through a centralized process. This avoids “empire building” (and its corollary of back-stabbing) through budget and headcount accumulation.
5. Top management should be deeply aware of all aspects of the business. This means keeping the business fairly narrow, with a short list of products and services. Narrow focus needs to be coupled with a wide base of applications. In other words, pick products and services which have broad appeal but keep their number low.
If you read this correctly, you will note how diametrically opposed this is to the modus operandi of corporate entities. It really is asymmetrical to how management is practiced and that leads to an outsized competitive advantage for Apple.
I’m thrilled to announce the next Apple investor event, September 19, 2024. Henceforth the events will be called the Apple Worldwide Investor Conference (WWIC). WWIC will examine Apple’s business in-depth using the latest data. In addition to financial review, we will also cover technology, externalities, company culture, brand and competitive stance.
Focus: Apple Intelligence.
State of the Union
Products & Services: Financial performance and market overview
Valuation: Measuring customer creation and retention
Growth: Opportunities in Products, Services, and Geographies
Externalities
Legal and Regulatory Review
Competition
Macro
China
Big Picture: Adoption Rates, Sustaining and Disruptive roadmaps
Wild Card: Reading the Buffett portfolio decision
We’re maintaining the intimate atmosphere of last year: same venue in Boston and limited in-person seating allowing for seamless interaction and enquiry. In addition, we would like to address a wider, global audience. So, for the first time, we will also be offering remote participation where you can watch the livestream, ask questions, and discuss topics live.
Tickets are available now. Asymco followers can get an additional discount using code asc24.
In Google and Apple: The Beginning, we looked at the history of the relationship and the situation which emerged when Mobile Computing rose to such a level of ubiquity that it determined the fate of both companies. Apple today holds firmly in its grasp about 27% of all smartphone users (1.3 billion out of about 4.8 billion). That audience consists of the top quartile of users in terms of income, access to credit, consumption and loyalty. I performed a deep dive on newly available data which confirms that App Store users individually spend more than 7 times Play Store users.
Apple has over 1 billion customers but also they're the best billion.
For this reason, Google has needed to ensure that it maintains access to Apple users for its main business: search. Just like any developer looking at iOS and Android ecosystems, Google knows that Apple's customers are highly desirable, profitable and loyal. Apple had to remain a distribution partner for Google.
How to do that? Google distributors are incentivized with what Google calls TAC or traffic acquisition costs. This is how Google describes TAC in its 10Q filings:
TAC includes: ◦ Amounts paid to our distribution partners who make available our search access points and services. Our distribution partners include browser providers, mobile carriers, original equipment manufacturers, and software developers. ◦ Amounts paid to Google Network partners primarily for ads displayed on their properties.
Apple belongs to the first category, a distribution partner that is both a browser provider and OEM. These costs are part of Google's "Cost of revenues" or Cost of Sales. These are costs that are proportional to sales and are usually measured as a percent of sales. The higher the sales, the higher the costs.
So the question that has been hovering over both companies for a long time is just how much is the portion of TAC allocated to Apple? Consequently, how much does Apple receive in such payments? This is a relevant figure as it affects the degree of co-dependency but also of relative profitability of each business. Apple gaining highly profitable commissions for access to its customers and Google getting highly profitable search terms from those same customers.
Here's what we know: Google reports its overall TAC total as part of its cost of revenues and Apple reports its overall Services revenues and margins as a separate segment. Google also reports TAC as a cost against its Advertising segment revenues.
In the last quarter TAC was $12.6 billion, a 21.2% cost against an Advertising total of about $59.4 billion. Apple reports Services top line only without sub-segments so we don't know how much of that TAC it receives. Services for Apple includes many elements including licensing, AppleCare, cloud subscriptions, digital content, third party subscriptions, apps, payment, advertising and other services. Some of these elements can be estimated as we have some historic data. Apps in particular can be teased out as we have developer payment data.
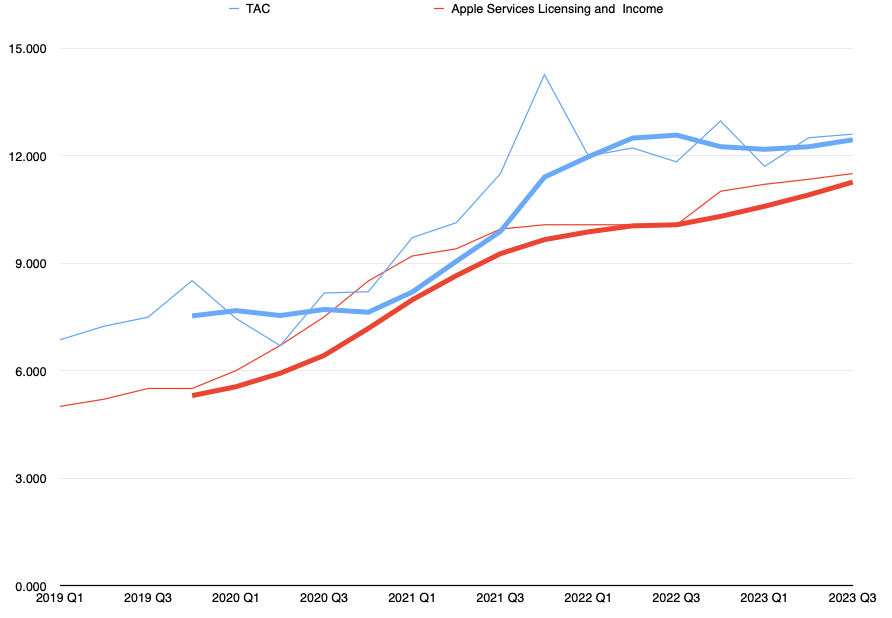
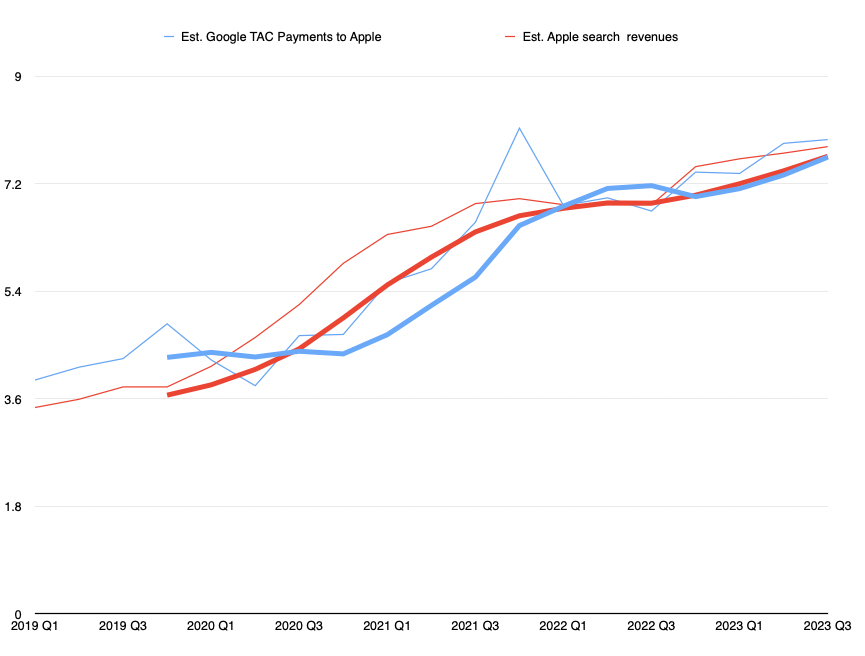
I've been estimating what would be Apple's TAC+cloud+payments as a bundle over the years. Looking at this figure vs. what Google reports as TAC yields this graph:
The thin lines are the actual data and the thick lines are 4 period averages. Apple is red, Google is Blue.
What this shows is that Google TAC is fairly well correlated to what Apple receives and that there is a gap of some degree. What is needed is an estimate of the percent of TAC that goes to Apple and a percent of Apple Services that matches it. Two variables but one equation.
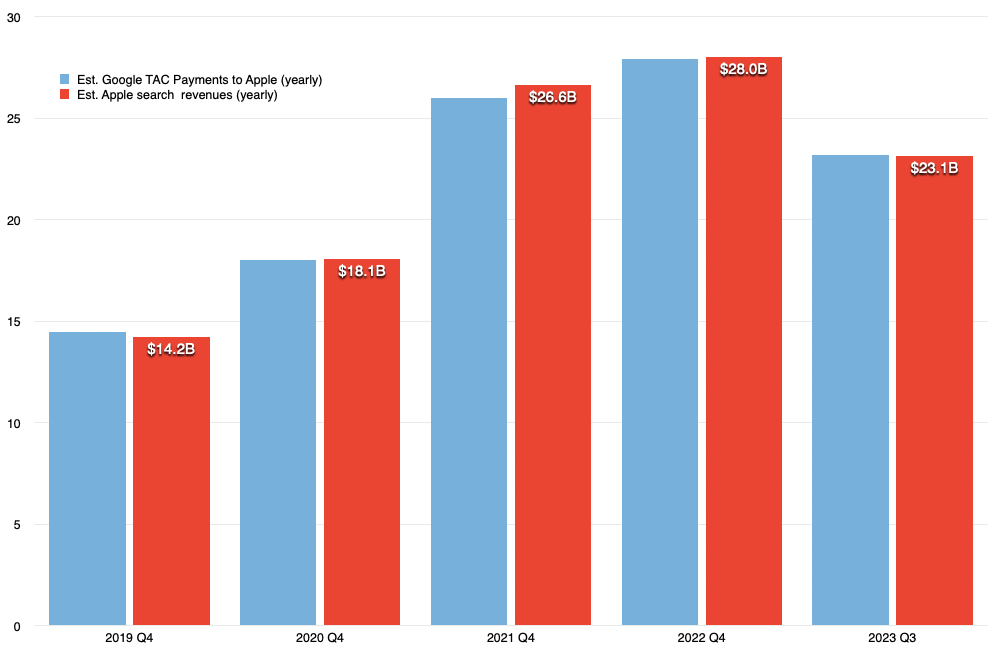
After some iteration through some constraints (which would be laborious to explicate but I can reveal at the next live event) I built the following estimate:
Though not matching identically, the yearly totals are pretty close to each other. The resulting yearly payments are
2019: $14.2 billion
2020: $18 billion
2021: $26 billion
2022: $28 billion
2023 (first 3 quarters): $23 billion
I would say this might be an upper bound for the estimate but not too far from reality. Most estimates to date have been far lower and I don't think they are accurate.
To stress test this I ran several sanity tests including comparing the revenue per user for Apple users and for non-Apple users and checking the sensitivity of services gross margins to TAC total.
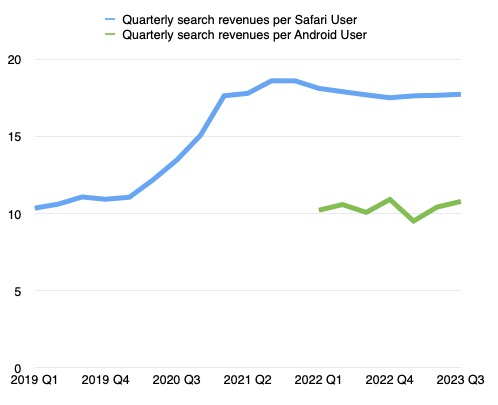
I'll just expand a bit on the revenue per user implications. We can calculate the revenues per user since we know that, according to Google's CEO, Apple receives 36% commission on search. Having the figures above, we can estimate the search income attributed to Apple and, by subtraction, the same for non-Apple. Then we can divide by the install base of each.
This shows that the deal could very well be indexed on the number of users with a specific value attached to each per quarter/month/day as these figures are fairly stable. The figure at this time shows that Apple users are valued at about $17.7/quarter or 19c/day while non-Apple users are around $10/quarter or 11c/day.
It also shows that Apple got "a raise" during 2021, increasing the amount it gets paid per user by about 60%.
It also suggests that Apple users generate about 37% of all of Google's advertising revenue, disproportionately as it's from a 27% user base market share.
None of these conclusions should seem surprising or extraordinary. If anything, they suggest that Apple is providing Google with bargain access to its customers. I suspect that Apple users are more valuable than a ratio of 2:1 in search. The app (and content and device ASP) economics are far more lopsided.
Apple is most certainly also very well aware of this and yet has maintained relatively modest pressure on Google in terms of pricing for access. There might be good reasons of which we are not aware of but as the antitrust pressure grows, so might Apple's interest in getting a better deal.
In the next installment of this series we will look into just how much better this deal can get.
Are Apple and Google competitors or are they partners?
Prior to the launch of the Android operating system, Apple and Google collaborated on many projects. Google Search was predominant on Apple products including the (at the time) new iPhone. The iPhone also launched with support for Gmail and had native Google Maps and even YouTube. Google was a cornerstone supplier for the new smartphone.
After the launch of Android only a year later, the relationship changed. The two companies came to be viewed as mortal enemies. The perception that Android was disruptive to Apple—insofar as it undercut the pricing power of the new touch-based user experience—was universal. The "zero price" of Android and its licensing by all other phone makers suggested a competitive collapse was imminent for the fledgling iPhone. Android phones were far cheaper and "good enough." If not immediately, then with the resources of all phone makers and Google itself, Android would surely soon overtake the iPhone in performance along all dimensions. It took a great deal of courage to argue otherwise.
But, over time, the notion that the iPhone would continue to exist became more widely held. Holding on to a "premium" positioning, iPhone seemed to be have pulled a rabbit out of a hat, perhaps because of Steve Jobs' reality distortion field or because of magical marketing. Nonetheless, doubts over long-term growth persisted.
Having survived Android, Apple was still seen as vulnerable to a multitude of Google initiatives including Chrome and Chromebooks, a range of Google Pixel phones (enabled by the acquisition of Motorola and HTC.) The entry of Google wearables (enabled by the acquisition of Fitbit), Glasses, the Play Store, YouTube content, Google productivity apps, Google cloud, Google TV, Nest, Google Assistant and numerous other services were all cited as nails in the iPhone coffin. This is all before the age of Crypto a new generation of AIs came into fashion.
Throughout this period the iPhone continued to increase its audience, growing its base of users not only from smartphone non-users but also from so-called "switchers", that is, those who moved from Android to iOS. Apple has benefitted from this net positive switching for at least five years now as most of its addressable market has already adopted the smartphone. There are about 1.2 billion iPhone users and it's far more likely that a new iPhone user today arrives from the 3.5 billion Android users than from the 3.2 billion people who don't yet have any smartphone. That is because those who don't yet have a smartphone today are also likely to not yet have access to electricity, cellular networks or money.
Indeed, it is Android that seems to be in a precarious position. The ecosystem is bleeding not just high-end users but also from fragmentation. Chinese OEMs in particular deliver their own experiences and code bases, eschewing Google services altogether. Large OEMs such as Samsung are seeking to differentiate with their own experiences and ecosystems and accessories and chafe against Google's hardware offerings. Upgrade rates to new Android versions are poor. Support of hardware beyond a few years is lacking. But, most fundamentally, Google has not developed a business model that directly fuels development of Android.
Put simply, Android is not a profitable product. It's not designed to create revenues. It's designed to reduce costs.
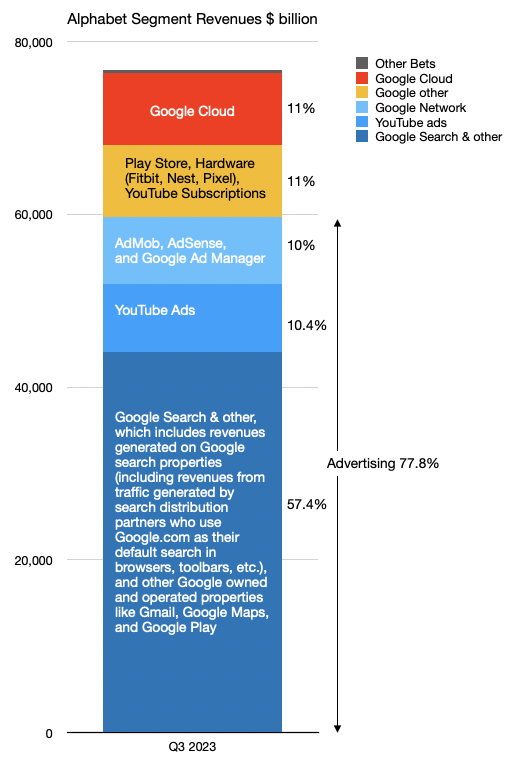
To understand this, we have to understand Google's business. It's not very complicated. Google's revenues in the last quarter are segmented as follows:
The colors above indicate the major categories. Blues are Advertising, yellow is "Other" and red is Google Cloud. Other Bets, consisting of research projects, is a 0.4% rounding error. Apart from Search which is about 60%, each major category is about 10%. Advertising as a business model is about 78%.
To Alphabet's credit, Advertising as a business model has been reduced from 94% a few years ago. Much of that credit goes to Cloud which is a B2B business and has completely different resources, processes and priorities than Search. The "one trick pony" label is less applicable to Google today.
Search however, and the ancillary properties, are still, by far, the largest sources of revenues and profit. Note that Android itself is missing from this mix apart from Play Store which is a direct Android extension. Play does contribute somewhat as part of "Other" but the OS itself is an enabler across all these categories.
While not directly producing revenues, what Android does is perhaps even more important. It helps reduce the amount Google has to pay to access its customers. Think of Search as a system which takes queries in and puts results out. These results are what advertisers pay for and the queries are what Google pays for. The output depends on the input. That input is harvested from many users. Access to those users is not free. The cost can be paid by building access directly (Android) or by paying for access to someone else's property (Apple, Windows, or Firefox). In old-school business terminology this is called distribution.
Distribution is often ignored or considered a superfluous "middleman" to be bypassed. But distribution is foundational to any business. It is, effectively, other people, outside your company, helping you sell your product because they have access to the customers. They get paid for that access, often with a percent of sales. Stores are distribution. Wholesalers are distribution. Resellers are distribution. Without distribution scale cannot happen. Distributors help both producers and consumers by creating access.
Access is also provided by what we call infrastructure. Just like you can't travel by car from your house to your destination without roads, all access to products and services is effectively infrastructure. If you own the infrastructure then you have to pay to build it and maintain it. If you don't own it you have to pay to use it. All infrastructure has value and all infrastructure has costs.
This all makes more sense when recalling the historic birth of Android. At the time (2006 to 2008) the worry for Google was that Microsoft's mobile operating system (Windows Mobile née Windows CE) would be licensed as was Windows. That is to say that all phone OEMs would take a license for a nominal fee and build Windows Mobile phones. Microsoft would thus dominate the mobile computing market the way it dominated the PC market (with market share above 95%). Microsoft would then ensure that Bing search was the default on all devices running Windows and Windows Mobile, thus blocking access to what was expected to be the next 3 billion users while capturing all search ad dollars ad infinitum.
If Windows Mobile were to dominate, Google would be denied distribution, at any price. It would thus be relegated to, at best, 10% market share of mobile search. This would be an existential crisis.
In this setting, Apple was an ally for Google. Apple was not a search engine provider and was very welcoming of Google search on a nascent Safari browser. Whereas Explorer would block Google search, Safari would offer default placement. Not for free, but for a reasonable cost. Google was a "go-to-market" partner for Apple and it was a symbiotic relationship.
However, the expectation of Google at the time was that Apple would be no more successful with iPhone than it was with the Mac: A fringe of "creative" or "fanboy" quirky oddballs. This was not just Google's expectation. It was everyone's expectation.
Android was built to counter a Microsoft mobile OS monopoly with a "zero cost" option vs. Microsoft's end-user-license model. Microsoft made money selling software. Both system software (Windows) and application software (Office.) Google would give away system software (Android) and services (Gmail and Docs) but make money on advertising.
A genius move. Phone OEMs would much rather pay zero of the OS on their phones than for the non-zero Windows Mobile license. [On a $200 retail cost phone (and thus $90 bill of materials) a $8 OS license is a huge cost.] Google's Android did indeed block Windows Mobile from getting a foothold in the post-PC era.
But it did so by taking some short cuts. Android itself was an acquisition in 2005 (for $50 million, with a keyboard interface) and, in response to the iPhone, a new touch user interface was developed. It so happened that this interface copied as closely iOS as Windows had copied the original Mac. This perceived theft was such an affront to Steve Jobs that he declared war on Google.
It was important to ask (as few did) why did Google need to develop an OS, only to give it away. Was its business that robust if it needed to expend enormous energy and capital to build an enabler? The answer is, of course, distribution.
Google was initially not paying for distribution as most people just typed "google.com" into their browsers. As the URL field became a search field, Google could still expect PC users to make Google.com their search bookmark, one click away.
But on mobile devices, the friction of the constrained interface meant that defaults mattered. Mobile was going to require new distribution economics. Devices were going to be in the hands of many more people, who, since they did not have full-size keyboards, would type less and who would interact in new (and very succinct) ways. One click away was one click too far.
With Android (and Chrome) Google set defaults for its services across the platform. If Android was the OS then Chrome would be the default. If Chrome was the default, then Google Search would be the default. For these Android-sourced queries, Google would not pay for distribution. Or, more precisely, would only pay to build and keep Android. Thus the more Android there was, the cheaper it was to obtain search queries for Google. Google had built its own highways: it owned the infrastructure that connected users to its services. These roads were for Android users. And what about iOS users?
Over a 15 year period the smartphone went from essentially zero to 5 billion users. It became so important to those 5 billion people that they keep it with them every waking moment, use it 100 times for a total of 5 hours each day. That adds up to 182,500,000,000,000 interactions a year and, as a result, it has changed behavior, politics and humanity itself.
Throughout this period, the relationship between Google and Apple changed. From being allies, to mortal enemies to, as we shall see, partners. We have to understand this new relationship that has emerged and its consequences.
The next post will explore the relationship in detail using the lens of the deal structure that exists. A deal which is not public and largely unexamined.
While preparing for the 2023 Apple Investor Event, I looked at my presentations from the last such event. This was called the Apple Summit NYC and took place in August 2018, about 5 years ago.
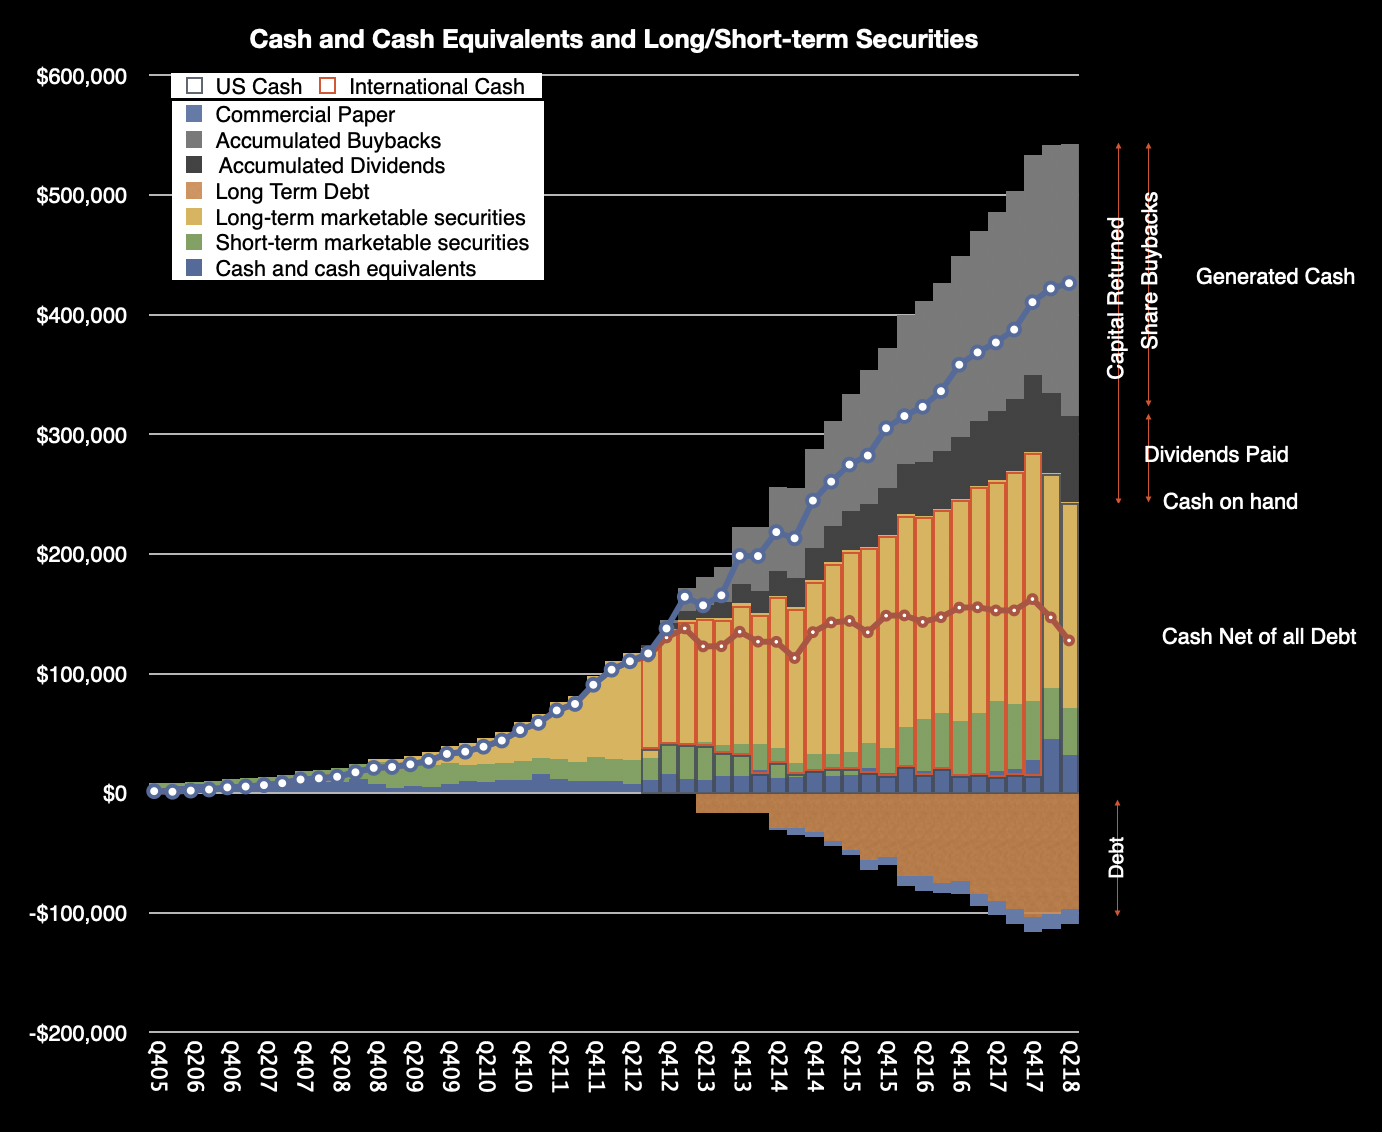
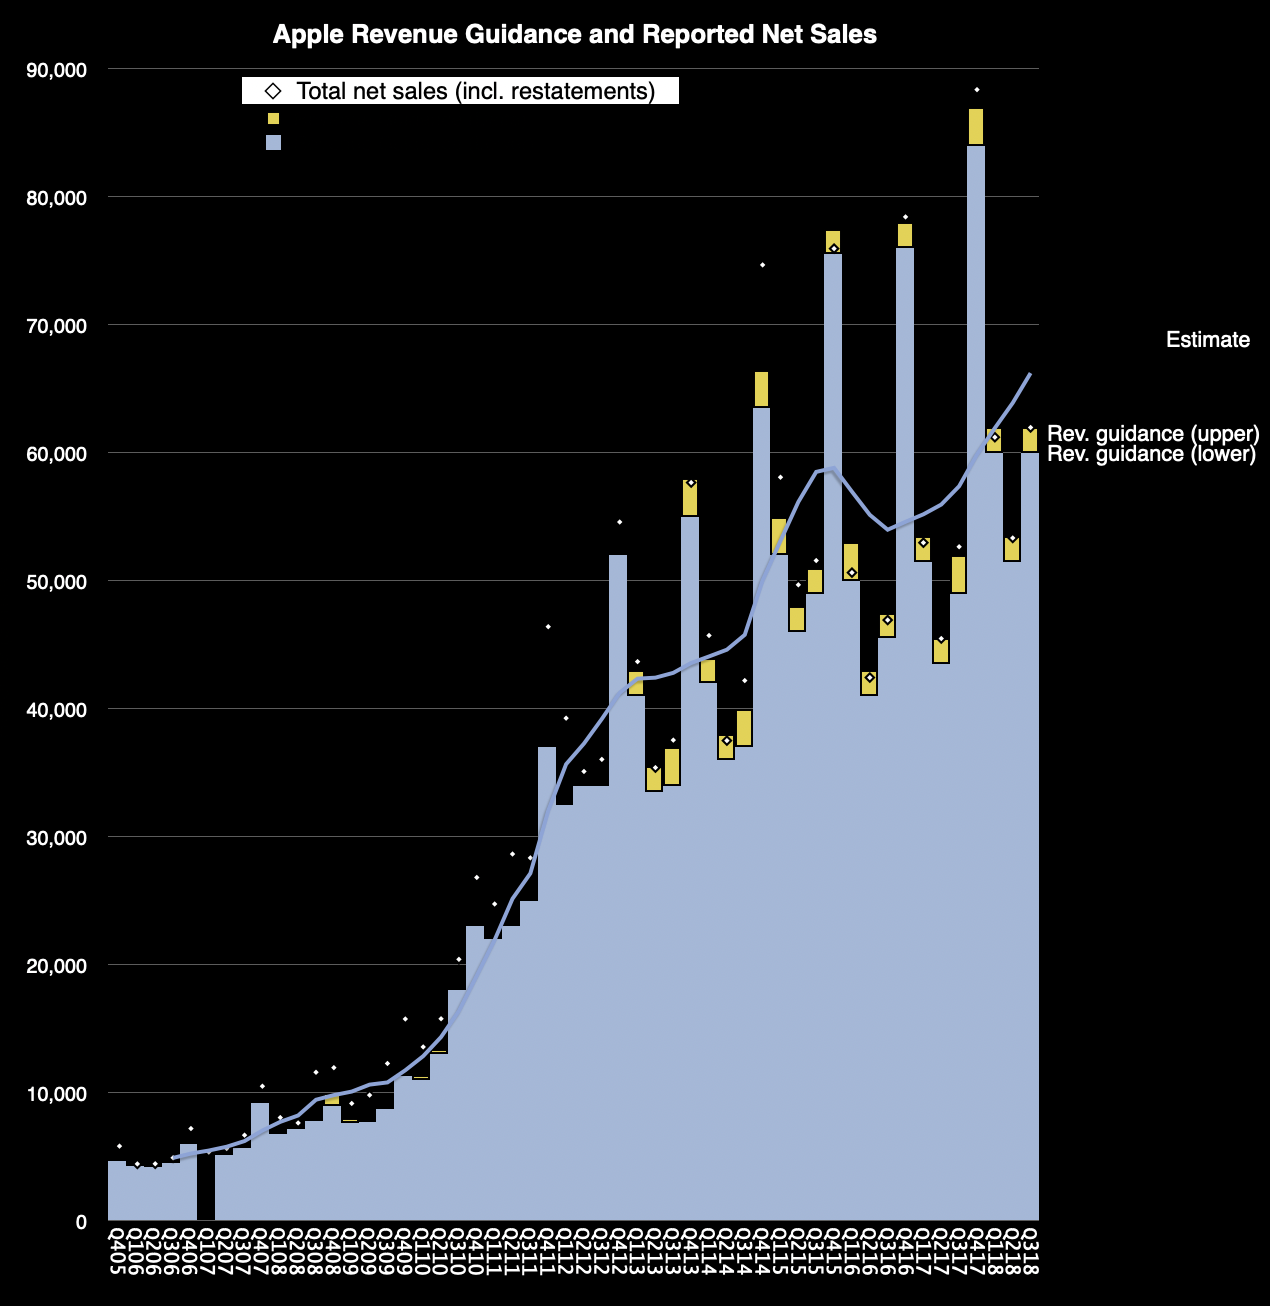
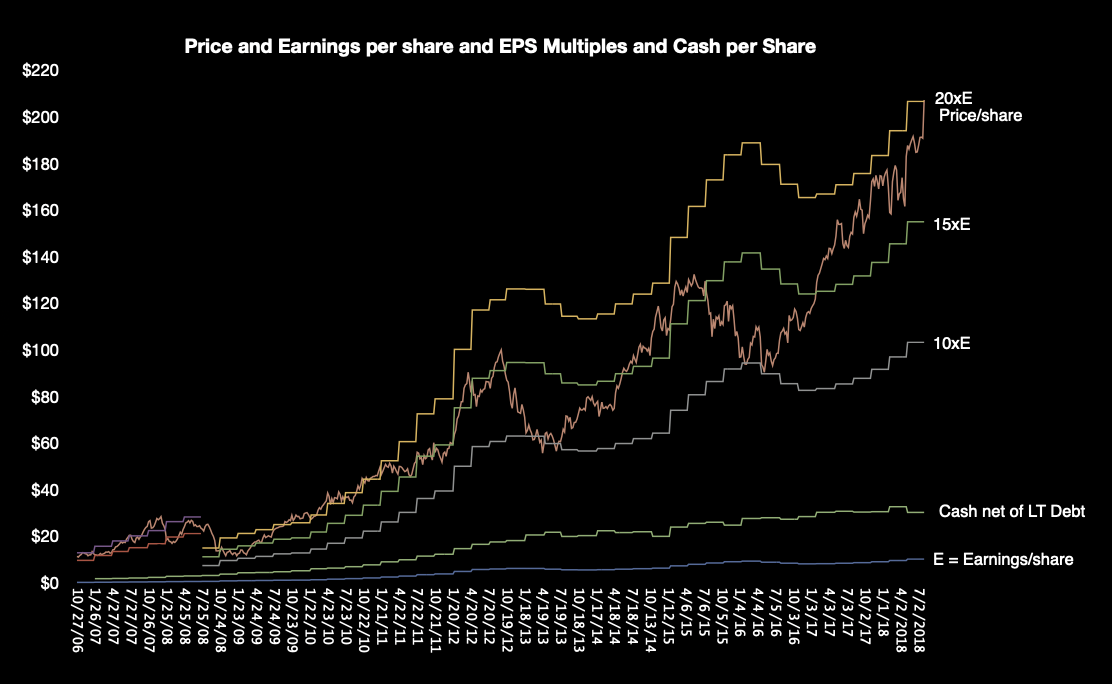
We will review these graphs at the next event but I would like to post them here to get the conversation started. Keep in mind that the conversation at the time was very much oriented around whether Apple's growth could continue.
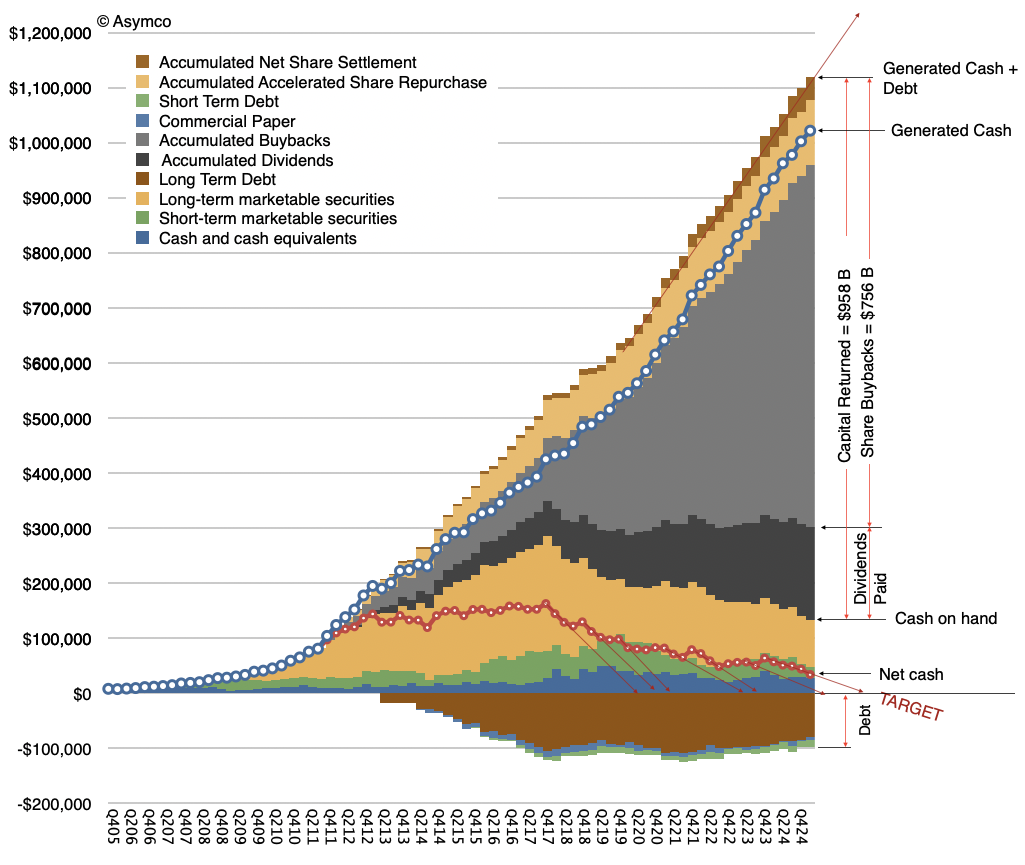
The cash and cash equivalents showing generated cash had just topped $400 billion.
Apple was still providing guidance and their accuracy with those estimates was reviewed. Also, the growth and cyclicality due product launches and major upgrades.
Share price and EPS multiples.
Can you, off the top of your head, visualize these graphs today?
Join us at the Boston event to look back so we can look forward.
Apple Investor Event Program
Start
End
Activity
9:00
10:00
Welcome, Coffee, Donuts
10:00
11:00
Product & Services Review
11:00
12:00
Valuation Review (State of the Golden Goose)
12:00
12:30
Lunch (on-site)
12:30
13:00
Growth Potential (new products, services and business models)