Apple's share price has recently hit a new all-time high, over $400 per share. As often happens there was no specific new information from the company to justify this increase. On the other hand there is usually no news to justify share price drops in Apple. In fact, the stock is up on what would be considered counter-indicative news: the resignation of a very important CEO.
But readers may recall that there is a measure of performance for Apple we can turn to that seems to show strong correlation to its stock price. It's not income and it's not growth in income but it's the strength of the balance sheet.
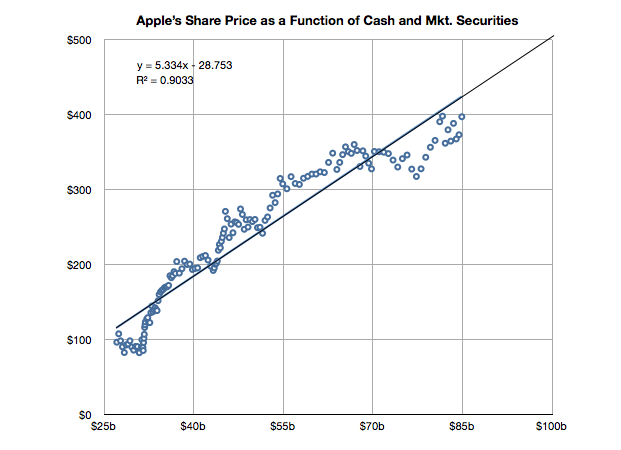
It's time to look at the data again to see if the relationship still holds. I added the data for Q2 and made some estimate about the cash position since July 25th (we will know this data with more accuracy when Q3 data is reported in a few weeks).
The slope of the line above has decreased slightly but a strong correlation can still be observed. The old r-squared was 0.94 and it is now 0.90. I included the formula for the y variable (share price) as a function of x (cash).
If you plug in $100 for x you get about $500 for y. So if this relationship continues[1], the answer to the question in the title would be "When the cash and cash equivalents reach $100 billion."
----
Note:
Note that whether the relationship holds (which it very well may not) depends on a strong correlation and "strong" is not well defined. The correlation has weakened slightly in the last six months.
[Updated with new charts including data from StatCounter and not NetMarketshare]
Generally speaking there is an equivalence drawn between iOS and Android as technologies and even as user experiences. However, as I've pointed out on several occasions there is a very clear nonequivalence in business models and thus the "fuel" which keeps each platform running. But does this difference in models lead to some difference in the way the products are "hired" to do what they do. Does it imply anything about how the products are likely to evolve?
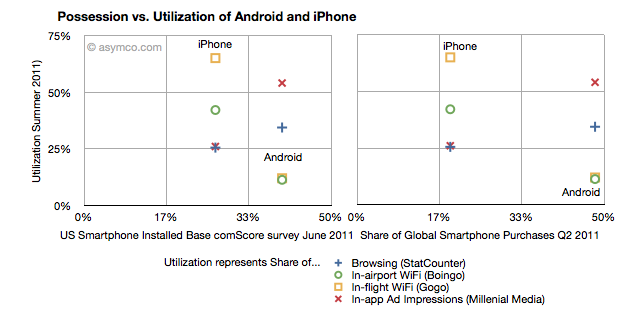
I collected into one place all the data I could find about utilization (how much of a service and how often it's used) and possession (both in terms of current ownership and new acquisitions) of iOS and Android.
Possession data comes from comScore survey data of share of US installed base of smartphones by platform at the end of June 2011 (first chart) and share of Global Smartphone Purchases as of Q2 2011 sourced from company reports and IDC (second chart).
Utilization data (vertical axes) comes from August 2011 shares of mobile browsers (from StatCounter June 2011), in-airport WiFi associations from Boingo in June 2011 (iPhone vs. Android), in-flight Wifi associations from Gogo in June 2011, and In-app Ad impressions from Millenial Media also in June.
The charts are divided into nine sections corresponding roughly to "low", "medium" and "high" utilization vs. possession.
The first chart compares a US-only population for possession vs. a mixture of global and US-only populations for utilization. The second chart compares a global population to the mix of US and global metrics.
What I found interesting is that if we take ad impressions (red X) and browsing (blue +) data out, the two platforms are indeed quite distinct. iPhone has a medium level of possession with a high level of utilization of data services while Android has a high level of possession with a low level of utilization. The data is also nicely clustered.
If we take just the ad impression or browser data then the platforms are quite similar: medium utilization for medium possession and high utilization for high possession. If the two platforms were to swap places in possession (i.e. market share) then they would probably also swap places in utilization (i.e. impressions).
What the data seems to suggest therefore is that for data services the iPhone is a far more popular tool than Android. But for in-app ad impressions and browsing the products are used in a similar manner.
The big difference is however that the services where iPhone utilization is high are those where users have to pay something. Most (if not all) of the ad impressions in apps are for free apps. So ad consumption scales with possession. But non-free services don't. This data seems to support the hypothesis that Android users are disproportionately less willing to spend money (note that the data does not say that users don't have money, but simply that they are not spending it). The other data which backs this hypothesis is that paid app sales on Android trail quite far behind the rate of purchase on iPhone. That could be due to payment problems in the Android marketplace but this data shows that there is some other effect as well.
Why is this important?
We can argue that Android is a low end product and that it disrupts and that this is consistent with that positioning. However it also indicates that the value is not in that ecosystem. And ecosystems are what sustain a platform in the long term. This debate will continue but I am reminded of other platforms which had similar patterns.
Both the Blackberry and Symbian had high possession (in terms of share) with very low utilization. There were lots of surveys which showed that browsing, app downloads and "monetization" of services after the sale of the handset were low. Much was written about it being due to poor experiences. But learned observers today insist that the experience on Android is as good as on the iPhone.
So why is there less economic participation from Android users? It's not just about these proxy services, but all manner of activities which enrich an ecosystem. Possession without utilization implies a product that does not do its job. Its features are not being absorbed. Why would that be?
RIM shipped 10.6 million Blackberries and 200,000 PlayBooks in the last quarter. Management noted that their sell-through was significantly higher for Blackberry (13.7 million) but seems to be very weak for PlayBook as the prior quarter saw 500k units shipped. Additional PlayBook units this quarter probably mostly went into new channels in Asia and there were no additional sales into North America or Europe.
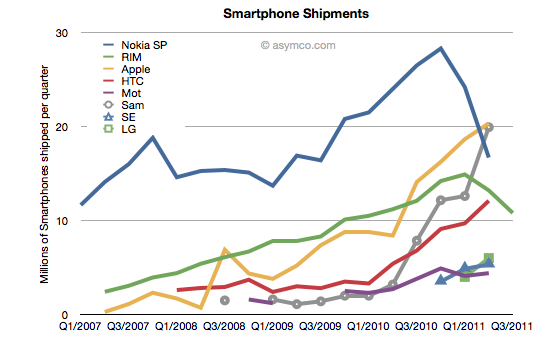
The figures for units are very poor. How poor depends on the frame of reference. Consider the shipment chart below:
In terms of the competition, 10.6 million units is less than half what Apple or Samsung sold in its prior quarter. It's also less than what HTC sold. RIM's volume rank will likely go to fifth place as a smartphone vendor.
In terms of its performance relative to its own history, the Blackberry volume dropped by 11% year-on-year and 18% sequentially. This is the second quarter that shipments shrank.
In terms of market share, we'll have to wait for the competitor data over the next six weeks but the market has been growing at an average of 77% for four quarters so any continuation of this trend would imply RIM's share dropping to single digits.
Finally, the biggest shock has been the decline in profitability. It seems that operating margin dropped from 21% to 13%. The company did incur some one-time charges for recent layoffs, but even without that charge, the margins would be around 16%. This is most alarming. The reason for such drops is that as volumes decrease fixed costs don't decrease as rapidly or at all. The company still needs to keep sales, administration and engineering staff around and they become a larger part of the operating expenses (vs. the component costs which vary with volume of goods sold).
This effect is well understood by financial analysts and the stock price shows it with a huge drop.
But stepping back to look at the picture above, there is a clear turning point in the company. You can see the elbow in the curve for volumes whose effect is felt so deeply. What's curious is why the pivot occurred when it did. We can point the finger to competition as the cause. But why was there no effect in the company's fortunes when the competition actually emerged. It's been years since the iPhone and even Android entered the market. Yet we see an impact on Nokia and RIM individually at apparently arbitrary points of time.
This is the lament of the analyst: you can clearly and accurately state what will happen but when remains a mystery. It's the elasticity between obvious causes and their effects that makes this an inexact science or not a science at all. In retrospect, you can say that Nokia's pivot was triggered by its public execution of Symbian, but that assumes that it was preventable--which we know is not the case. But what caused RIM's change of growth, exactly? Why did it happen this past spring? Why didn't the company volumes begin to decline as iPhone and Android boomed in 2009 or 2010? For quite some time RIM seemed immune to competitive pressure. We all were made fools as we called its imminent demise. Then, as Steve Jobs would say, boom!
---
Footnote:
Piecing together RIM's performance is becoming more difficult each quarter. The data being presented is increasingly obfuscated by irrelevant detail while major information is omitted. This last management presentation was full of holes, namely:
We have no idea of device pricing. Valiant efforts have to be made to piece together that aspect of the business. Matt Richman does a good job but it still requires some guesswork regarding PlayBook pricing to back out Blackberry pricing.
Management detailed where Blackberries were selling-out but only detailed sell-in for the PlayBook. Obvious spin.
They are cherry picking the data they present and each quarter it's a different story making pattern recognition impossible.
This leads to an erosion of trust. Observers are faced with the problem of increasingly guessing what is happening each quarter. For instance, regarding pricing I prefer to include service revenues in the analysis of device sales because device+service is what is being bought by the user and vendors which can offer services as part of the device get a justifiably higher value for the product--value that I think needs to be considered as advantageous. Nokia and Apple also account for services (though not apps) as part of device sales and it makes it more convenient to compare these businesses.
Given RIM's smokescreen, this quarter I decided to stop trying to guess Blackberry pricing and used Operating Income/Units sold as the average selling price.
In yesterday's post about the "biggest mobile loser" I covered the exodus of users from non-smart devices in the US and EU5. I also said that what happens in those regions tends to happen in other regions with a time shift. In some regions it happens quicker but in most it happens more slowly.
But can we be sure that there isn't vast non-smartphone growth in other regions? Well, no, we can't be sure. At least not without access to reliable data.
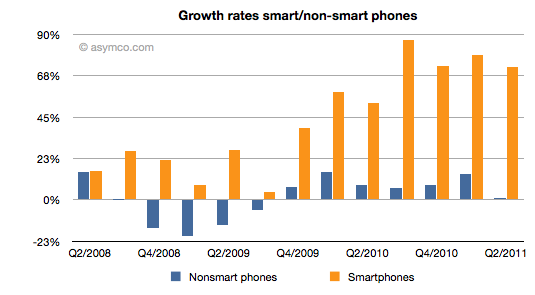
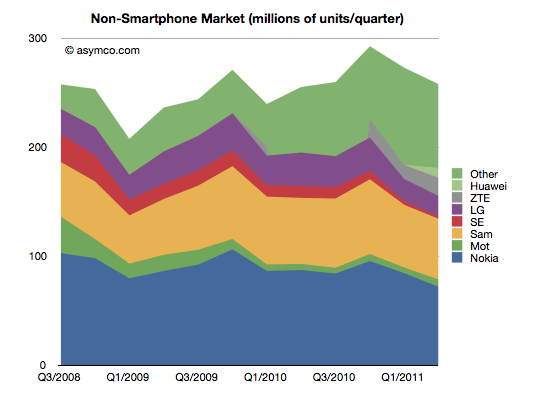
But what we can track is the overall non-smart phone market and compare it to the smartphone market. Here are the growth rates of the two sub-markets:
The difference is plain to see. We can also note that the non-smart market may be heading into a contraction--something noted by some analysts close to the market--but no real sign of that happening in smartphones.
Beside growth, we can also see actuals and the split of various vendors' volumes in the market.
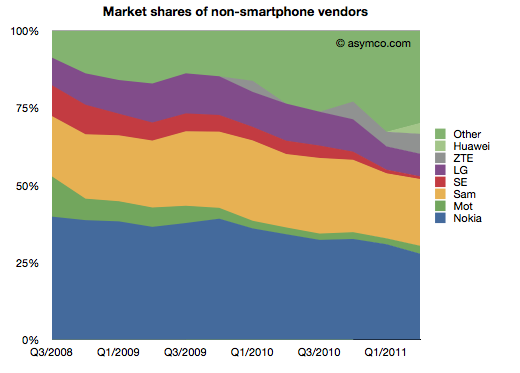
It's also clear that the top line has not moved much in the last few years. Next, the shares of the vendors.
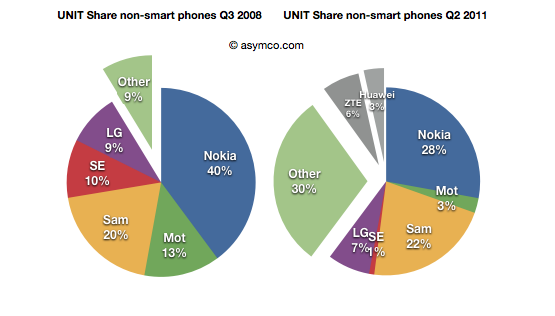
Finally, the before-and-after share pies.
We can see that the growth story, if there is one, is coming from low-end entrants. In late 2008 the main brands had 90% share. They now have about 60% (in a flat market.) The growth is all from "Other".
What seems to be happening is that buyers in mature markets are swapping (or upgrading) from non-smart to smart and adopting new smartphone brands. At the same time, new users in emerging markets are increasingly adopting new non-smartphone brands.
So the question for the incumbent vendors is extremely important: Facing them are low-end and smartphone entrants engaged in a pincer movement, with obvious success; can the old brands survive?
The answer, as always, depends on whether the competition is symmetric or not. Low end competitors are usually structured around low cost structures. High-end competitors are exploiting new markets and new business models. For an incumbent to survive and fight on both fronts they'd have to adopt both of these models for themselves, simultaneously and quickly.
We can see that Sony-Ericsson and Motorola (Google) have thrown in the towel on the low end. The question of dual-front strategy is mainly relevant only for Nokia, Samsung and LG. LG is on the ropes and may actually be ready to exit the market so that really means Nokia and Samsung. Nokia has signaled continuing interest in the non-smart market (citing "the next billion users"). Samsung also seems to be hanging in there. Can they do it?
I cannot stress how difficult this is or how rarely it has been achieved. The two approaches are if not opposites then at least orthogonal. It's like Mission Impossible. You can't be a low cost global vendor while investing in R&D for differentiated platform-based devices. These are shaping up to be businesses requiring completely different skill sets. Few have the ability to host these skills inside one company. I can think only of one example.
Yesterday comScore published survey results for EU5 (France, Germany, Italy, Spain, UK) on smartphone use and installed base. The headline is very similar to what would be written about the US: Android had phenomenal growth over the last twelve months. I also noted that the apparent growth of Google (16.2% share change) seemed to be matched by an apparent decline of Symbian (-16.1% share change.) However the reading of the data is not so simple.
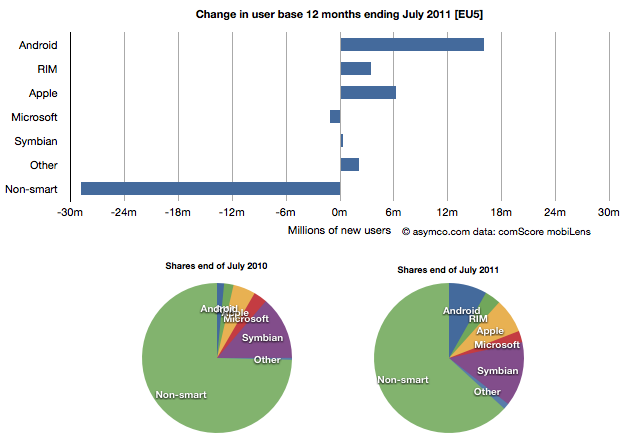
In order to understand what has happened to usage, it's much more valuable to look at consumption and the actual number of users rather than change in share of a subset of the market. Consider the following charts:
The bar chart shows that three platforms gained users in the last year (ending July) and that there were negligible losses in users by others. Negligible except for non-smart phones. A remarkable 29 million users moved from non-smart phones to smartphones. Those switchers switched into Android (16 million), iPhones (6.3 million) and RIM (3.4 million). Symbian even gained about 330k users. Microsoft lost about 1 million but its platform has not been actively promoted in that time.
When seen as a pie chart, you can see how the usage shifted from non-smart to smart even more clearly. It does not appear that Android took share from Symbian at all. Android took share from non-smartphones. The table in the link from comScore leads one to conclude otherwise.
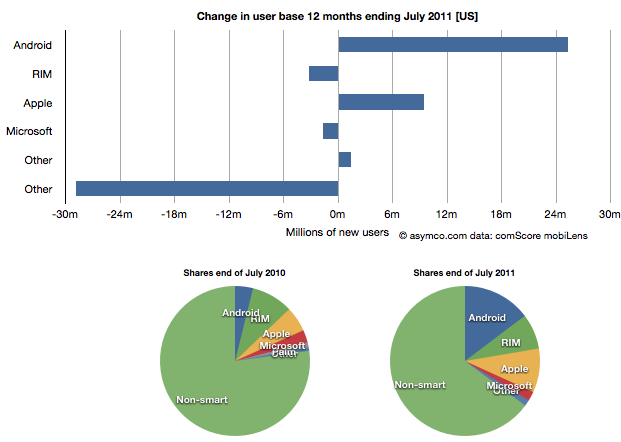
I took the same approach to look at the US data (also from comScore). It shows a similar pattern.
In the US, RIM was a net usage loser but its losses also paled to the losses of non-smart devices. In comparing with EU5 the pattern is very similar.
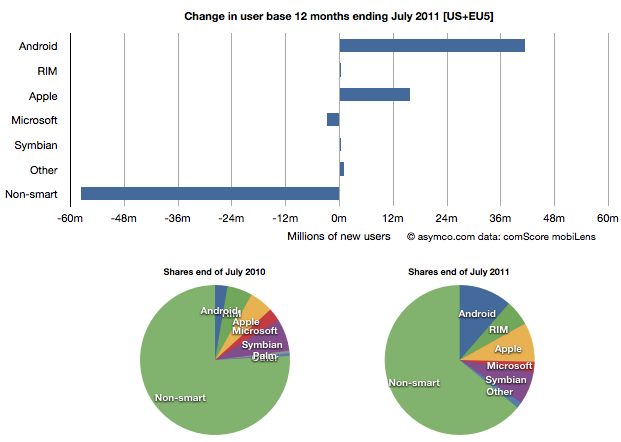
I then combined the EU5 and US data and provided a view into the combined markets (note scale change from previous two charts.)
This shows the change in platform phones more or less being from non-smart to Android and iPhones. The total population is 470 million people--not insignificant. The total number of non-smart devices abandoned is nearly 60 million in one year, which equals the total number of new smartphone users. That's 12% of most of the developed world switching in one year. If this keeps up, the "tipping point" when smartphones will outnumber non-smart phones in use in these large markets will be in another year.
In terms of sales rate, the tipping point has already happened. Sales of smartphones crossed over in the US and Europe several quarters ago (November 2010 in EU5) and the trend is accelerating. Furthermore, if patterns of mobile technology adoption repeat as they have for the last two decades, emerging markets will follow in two to three years.
This tipping point observation has been repeated on this site a number of times when reflecting on the data in the US. Now it's becoming clear that the same pattern has been underway in Europe as well.
The big picture from the survey data is just how vast the demand for smartphones is. Some platforms are benefiting more than others in terms of share of growth, but the biggest mobile loser is clearly the non-smart phone. Not only is it an unprofitable product for almost every vendor, it is also being increasingly shunned by buyers.
At the same time, at 450 million users we're still only looking at less than 10% of the market. As this pattern spreads globally the platform install bases will be measured in the billions of users.
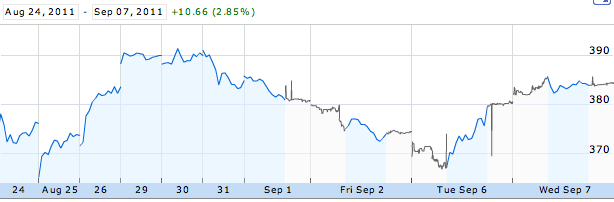
CEO resignations often cause share prices to rise. Witness the effect of the latest CEO departure on Yahoo!. This typically happens because CEO replacements are not necessary when companies are successful. In times of crisis, the market sees management change as a hopeful sign. But Apple is doing well. So it was commonly believed that if Steve Jobs were to leave the helm at Apple the stock would fall. However, as the chart below shows, the stock price has since risen.
Apple's share price rise of 3% even out-performed the Dow Jones index, and this phenomenon is not for the short term only. The Jobs resignation sent Apple puts to one-year lows.
So how do we reconcile this? How can such a valuable person be priced as a liability?
First, I should mention that not everyone shared the opinion that the departure of Steve Jobs would cause a decline in the price. Over a year ago, in August 2010 Horace wrote in a comment:
Since I've shown repeatedly that Apple is trading at a discount to its growth and to its historic value and to its peer group, and since the health of their CEO is an uncertainty which must be discounted, the possibility exists that the depressed value assigned to Apple is due to Steve Jobs's continuing presence in the company. If that is true then his departure should increase the stock price.
His argument of why the departure of Steve Jobs would cause an increase in the stock price was based on the fact that the market would have discounted it and the only question would be when it would happen. Since that uncertainty of when was unresolved, it would weigh on the shares until the uncertainty would be lifted and the price would resume its value based on other factors.
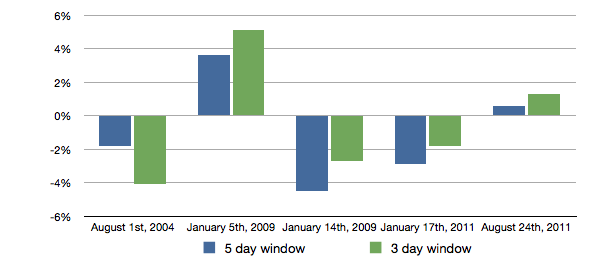
To demonstrate that effect, we can turn to data. The discounting was visible in the reactions of the stock in previous events when the tenure of the CEO came into question. Those reactions are shown in the following chart:
Each of the bars above shows the cumulative abnormal returns after all the events when tenure issues cropped up in the news.
If we excluded the first time we learned about Steve Jobs’ health issues, we can see that the stock market likes certainty (January 5th, 2009: health issue but remains CEO; August 24th, 2011: definite resignation as CEO) and rejects uncertainty manifested in medical leave announcements on January 14th, 2009 and on January 17th, 2011 leaving the top organization in a temporary form. We can also see that Apple investors are becoming more comfortable with Tim Cook running the company as the negative cumulative abnormal returns diminish and turn into positives ones when he is appointed CEO.
We can conclude that Steve Jobs’ resignation as CEO, as sad as it may be, has reduced unsystematic risk from the stock and therefore “boosted” the share price performance.
As the market continues to exhibit signs of instability, an interesting paper[1] identified a correlation between the U.S. stock market and an index of the U.S. Financial Conditions. This index measures the assessment of the probability of a crisis.
The conclusion is that an imminent crisis mentality pervades equities markets today and implies that pricing is largely disconnected from fundamentals. On this blog we've discussed the topic of fundamentals and marveled at how pricing seems to be largely exclusive of it.
The case is made by the following chart:
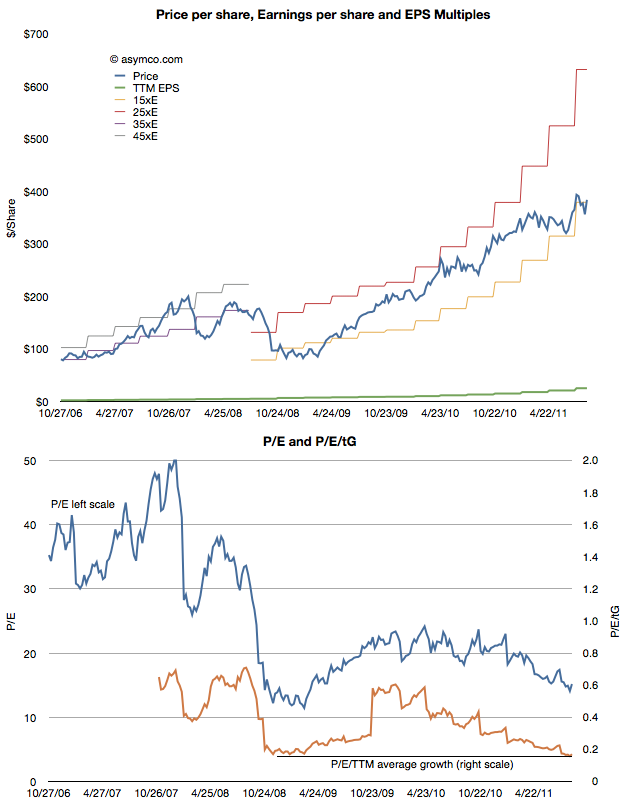
The first chart shows the share price (blue) and the earnings per share (EPS in green) as well as several multiples of EPS. During the period of 2006 through 2008 the stock ranged between a P/E of 35 and 45. beginning with the collapse in confidence due to the banking crisis, the share price fell to within a range of 15 and 25. Now, with Apple's growth accelerating above 100%, the stock price seems to be sliding below the 15 P/E bottom.
In the second chart I show the P/E in blue and the P/E/trailing Growth. Adjusted for earnings growth the equity is cheaper now than at the bottom of the last recession. You can also observe the trend or slope of the decline in the P/E/tG. It might be alarming to see the decline but it also might be comforting to know that the P/E/tG cannot go to zero. Either Price has to go to zero or earnings or growth have to go to infinity. The closer P/E/tG goes to zero however (it's at 0.17) the more undervalued Apple appears to be.
Naturally these metrics of P/E are arbitrary and the price is simply what the buyers are willing to pay for the equity. But the value of any metric is the trend. The value can be compared to a different time or to a different equity. The trend here is that Apple, at least, is being discounted at a time when it's growing more robustly than ever.
Which is why finding an explanation is so important. This is where the paper sheds some potential clues. The author concludes that there is a pervasive crisis phobia which affects multiples. Paulsen writes:
If cultural mentalities were less crisis-phobic today, what would the PE multiple be on the stock market coming off a 12.8 percent profit quarter with a 2.2 percent Treasury yield and only about a 1.6 percent core consumer price inflation rate? Certainly, much higher than 12 times earnings! 16 times earnings? 17 times? This simply illustrates just how much the crisis-centric mindset is depressing investment potential and it also suggest how much opportunity there is to increase stock valuations just by improving the cultural mindset. Long term, the real investment opportunity is not a dramatic improvement in economic or profit growth (although either or both could occur), but rather is just a slow but steady decay in “crisis-fears” similar to what we experienced during the last recovery.
Apple's valuation has been discussedseveraltimes on Asymco. Apple’s relative valuation in terms of P/E ratio has not improved since the recession despite an acceleration in financial performance. As Apple seems to be getting punished for growth, we have to also ask if it is the only one.
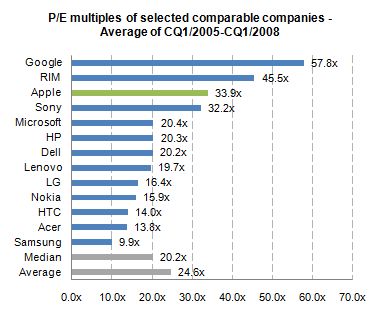
When looking at valuation from an institutional investor or financial analyst point of view, the most common methodologies are discounted cash flow (DCF) as well as comparable company multiples. Most often, a DCF valuation is performed and cross-checked with comparable multiples. The justification for using comparable companies is the exposure to the same market dynamics including, for instance, market growth and profitability. So to understand this perspective, let us focus on a peer group valuation by looking at the average P/E multiples[1] for the calendar quarters 1/2005 to 1/2008[2].
We can see that before the financial crisis Apple has been valued above the peer group average with a P/E ratio of 33.9x.
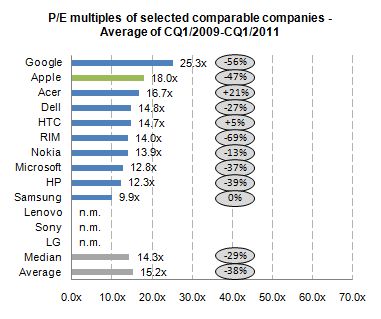
During the financial crisis stock prices declined across industries. For the selected companies share prices declined on average more than 80%. One would assume that with the improved industry outlook and worldwide recovery since 2009, peer group multiples should return to pre-crisis levels. By looking at the average P/E multiples for the calendar quarters 1/2009 to 1/2011, we can derive the change in relative valuation levels.
The data shows that, on average, all companies are continuously trading almost 40% lower for a two year period after the financial crisis. Despite Apple’s higher-than-average discount of 47% to pre-crisis valuation level, Apple is valued above the peer group average and on top of the mobile phone and PC vendor group.
By using the comparable company valuation approach, we are able to see how institutional investors analyze and value Apple. The analysis points to a valuation paradigm shift affecting not only Apple, but many comparable companies post financial crisis. In addition, there was a premium on Apple’s valuation before crisis and there is a premium after the crisis.
The notion that Apple has been single-handedly punished by the market does not hold in the context of comparable companies.
The next step will be to determine if the P/E premium for Apple is consistent with its growth premium.
---
Notes:
Share prices as of end of quarter, earnings include last twelve months
Charts excluding negative multiples and outliers (turn-around multiples)
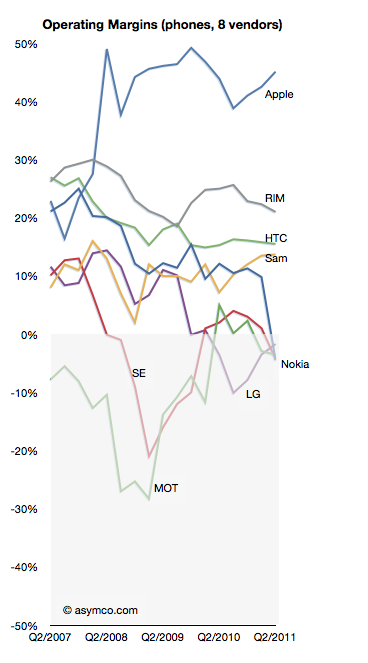
LG lost profitability in Q3 2009 and has not recovered it yet nor can it say when it might.
In a recent article on analyst reactions the prospect of LG's exit from handset sales is raised:
LG's handset division is the company's biggest capital sinkhole and the shares have more than halved this year, making it the worst performer even when compared to HTC and Nokia.
"Selling the loss-making business is probably what investors want," said Harrison Cho, an analyst at KB Investment & Securities. "But even with that option, LG wouldn't get much from the sale. They should have sold it long ago before the overall landscape got tougher."
"They simply missed the boat," said Cho.
The dire business outlook had already pushed LG shares below their book value to a record-low multiple of 0.9 times its book value, much cheaper than Research In Motion's 1.6 times, Nokia's 1.1 and HTC's 8.2.
That's a huge discount for a company that is also a global brand in television and home appliances.
As I like to point out it's unlikely that management failure is the sole cause for this problem LG finds itself in. If it were, then why did Nokia, Sony Ericsson and Motorola find themselves in trouble at the same time?
But putting aside the causes, the prospect of another tier one vendor becoming a victim in a booming market speaks volumes. Only Samsung remains largely unscathed, though I believe they are not immune. The shift in profit capture that I have been documenting is plain proof that the industry is undergoing permanent structural changes.
As the chart to the left illustrates, the plunge into negative margins is difficult to reverse. The only advice for LG today (besides breaking itself up) is:
"What LG can do at this point is keep doing what it can do best; keep upgrading its hardware offering, differentiate them and then diversify away from Android to Microsoft's Windows phones," said Jung Kyun-sik, a fund manager at Eugene Asset Management in Seoul.
I suspect however that diversifying into multiple platforms will not be particularly differentiating as every other vendor will do the same.
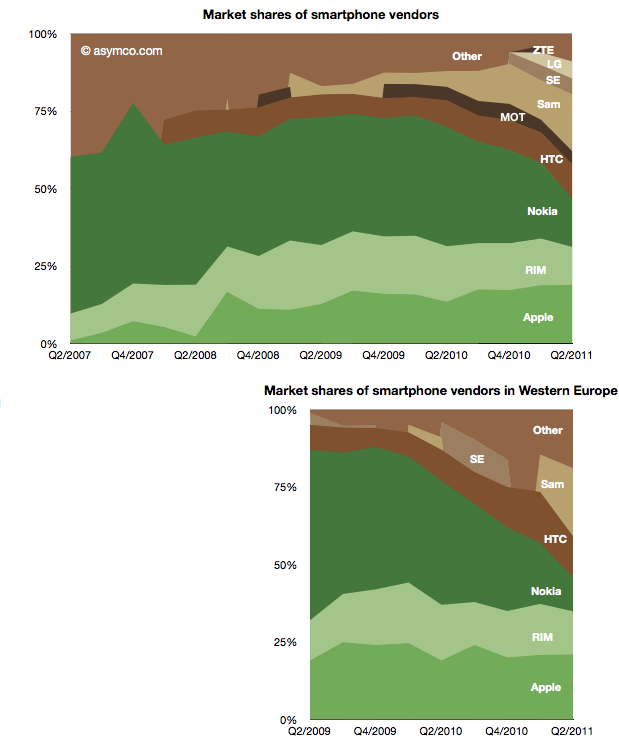
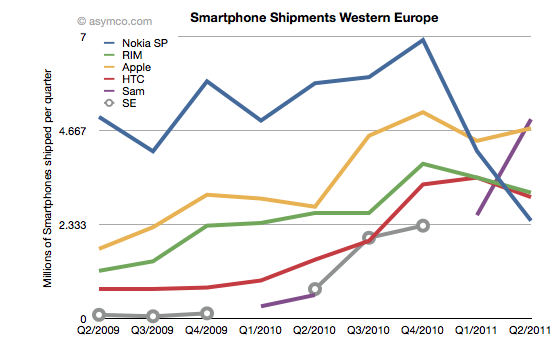
Two years ago Nokia sold 30% of its smartphones in Western Europe. Today it sells 15% in that market. Its unit shipments went from 5 million to about half that and its market share went from 55% to 11%. Its rank in the market went from first to fifth.
The fall is exceptional and dramatic. The two charts below show smartphone market shares. The top chart shows global share and the second shows Western European smartphone shares (European share data sourced from IDC).
The other perspective is shown the the following chart which shows actual units shipped.
One striking thing is how volumes collapsed into Q1 and Q2 this year, coinciding with the public decision in February to deprecate Symbian. The other interpretation I would make is that within the two year time frame Nokia's share has been completely absorbed by Android, not Apple. Whereas most commentary shows Nokia suffering at the mercy of Apple, it's Android that took share in Europe.
Can a Windows Phone portfolio turn Nokia's fortunes around? The first problem is that such a portfolio will not be available until next year. The second problem is that the competition will not be standing still. The third problem is that the market itself may not be growing as fast as expected.
It's becoming increasingly difficult to see how Nokia can weather this turbulence and odds are against it.
Google's acquisition of Motorola is clearly designed to be an acquisition of Intellectual Property rather than an entry of Google into the phone business, but the impact on the business will be felt in many ways.
It is surely going to send some Android vendors scrambling. The situation is not without precedent however. The history of governance and ownership of Symbian shows how the licensing of platforms by licensor competitors leads to unintended consequences.
Symbian was formed to be governed in a way very similar to the original Android via the Open Handset Alliance. The company was owned by a consortium of phone vendors.[1] The shares were not equally distributed however with Nokia holding a larger share (though not a majority).
Although nominally involved in decision making, the smaller shareholders never felt entirely comfortable with the arrangement and over time some sold their shares and left the group even though they continued to license the OS.
Eventually Nokia ended up acquiring the company outright and open sourced the code. However, by then the product was obsolete and the only licensee was Nokia itself.
The lesson (and warning) was that a licensor that is also a licensee makes other licensees uncomfortable. The supplier is also a competitor. This is classic channel conflict and never ends well.
Open or not, with or without equity, these arrangements are always unworkable.
So Google's promise that
"This acquisition will not change our commitment to run Android as an open platform. Motorola will remain a licensee of Android and Android will remain open. We will run Motorola as a separate business. Many hardware partners have contributed to Android’s success and we look forward to continuing to work with all of them to deliver outstanding user experiences."
seems naive at best.
--
Notes:
Before its outright purchase by Nokia in December 2008, Symbian Ltd. was owned by Nokia (56.3%), Ericsson (15.6%), Sony Ericsson (13.1%), Matsushita (10.5%), and Samsung (4.5%). The company's founder shareholders were Psion, Nokia, Ericsson, Panasonic/ Matsushita and Motorola. Motorola sold its stake in the company to Psion and Nokia in September 2003. Psion's stake was bought by Nokia, Matsushita, Siemens AG and Sony Ericsson in July 2004.