Asymco

Asymmetric Intelligence

software

  1. Preview of the holiday quarter

    Research · 6 comments

    Every October, at the end of its fiscal year, Apple files its Form 10K or annual report. In this report the company includes a section titled "Capital Assets" which details expenditures for capital equipment. This is last year's entry:

    The Company’s capital expenditures were $14.9 billion during 2017. The Company anticipates utilizing approximately $16.0 billion for capital expenditures during 2018, which includes product tooling and manufacturing process equipment; data centers; corporate facilities and infrastructure, including information systems hardware, software and enhancements; and retail store facilities.

    Note that there are categories of spending detailed and that their order might indicate the degree of such spending, suggesting that product tooling and manufacturing equipment is likely to be the costliest category.

    After this report, during subsequent quarters the company may update this forecast of spending. In the last (third fiscal) quarter the entry was as follows:

    The Company’s capital expenditures were $11.1 billion during the first nine months of 2018 . The Company anticipates utilizing approximately $17.0 billion for capital expenditures during 2018, which includes product tooling and manufacturing process equipment; data centers; corporate facilities and infrastructure, including information systems hardware, software and enhancements; and retail store facilities.

    Note that the forecast of $16.0 billion was updated to $17.0 billion and the first 9 months' expenditures were $11.1. Since there is only one quarter remaining ((and since at the time the quarterly report is filed, only about 2 months remain in the quarter)) it's reasonable to assume that the company's forecasts are more likely to be precise and that therefore the difference between total expected spending and already spent, i.e.f $5.9 billion remains to be spent.

    The actual spending is not recorded quarterly but an approximate value is reported in the Cash Flow statement as "Payments for acquisition of property, plant and equipment". That can be tracked but it does not equal exactly the capital expenditure. For example, the quote above says expenditures were $11.1 billion through first 9 months but the total of all payments for acquisition of PP&E is $10.272 billion.

    Minor ((To the extent that $1 billion can be considered minor)) differences, aside, this forecast and actual spending and payments data is significant because it is highly correlated to Apple's overall business. Assuming that the spending on manufacturing equipment and information systems hardware (i.e. data centers) is in support of the iOS device sales and services we can try to show how sales correspond to spending with the following graph:
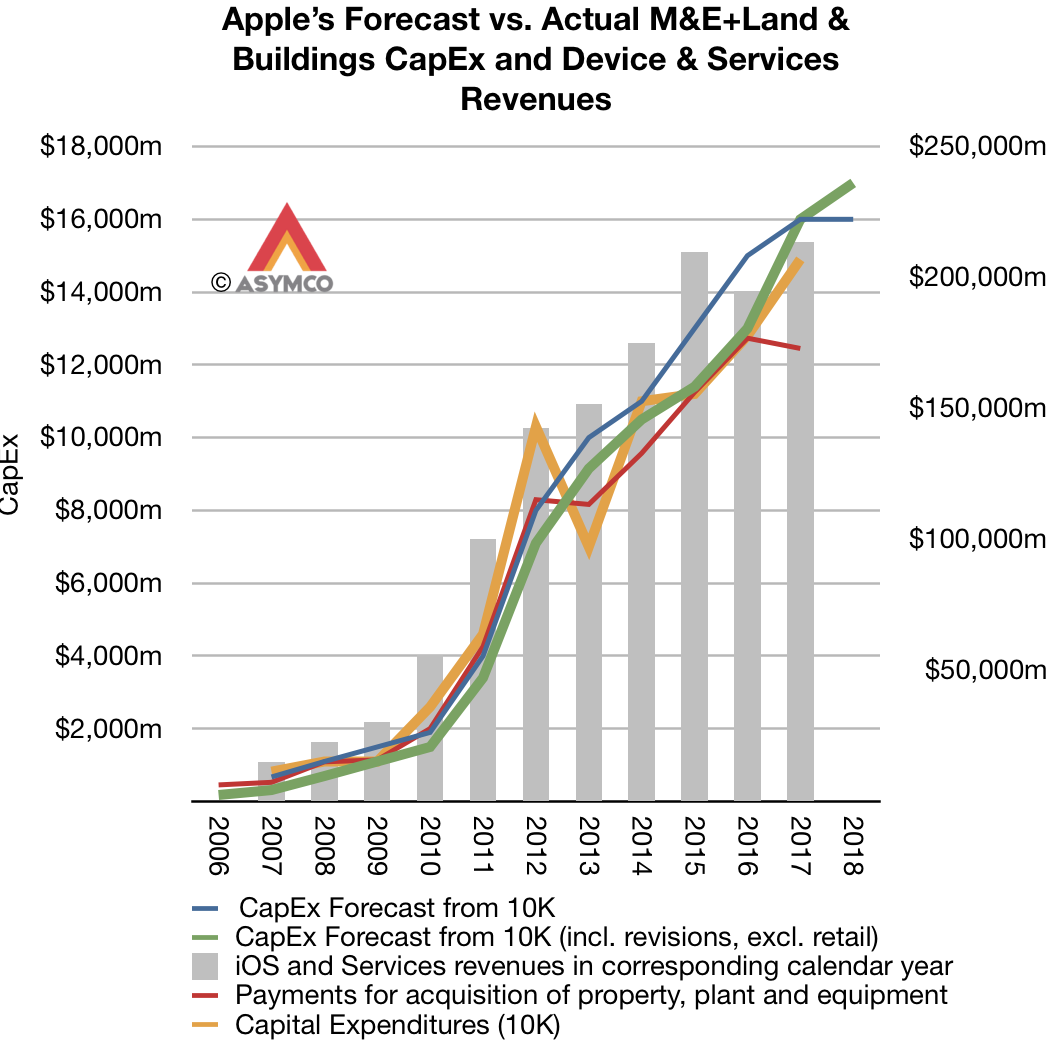
    Here sales are shown as a bar graph and the various spending forecasts and actual payments are shown as lines. Also note that the spending and sales are offset by one quarter. The fiscal year is used for spending and the calendar year for sales. The reason is that spending is presumed to lead sales by approximately one quarter.

    There are some notable discrepancies, especially with the 2012/2013 period when spending was brought forward a quarter thus showing a surplus to forecast in 2012 and a deficit in 2013. But apart from that, there is a broad correlation between spending and sales.

    This means that the CapEx forecast in October is a good indicator of sales in the following year.

    In fact, the relationship is can be shown with four scatter plots, one for each of the published figure:
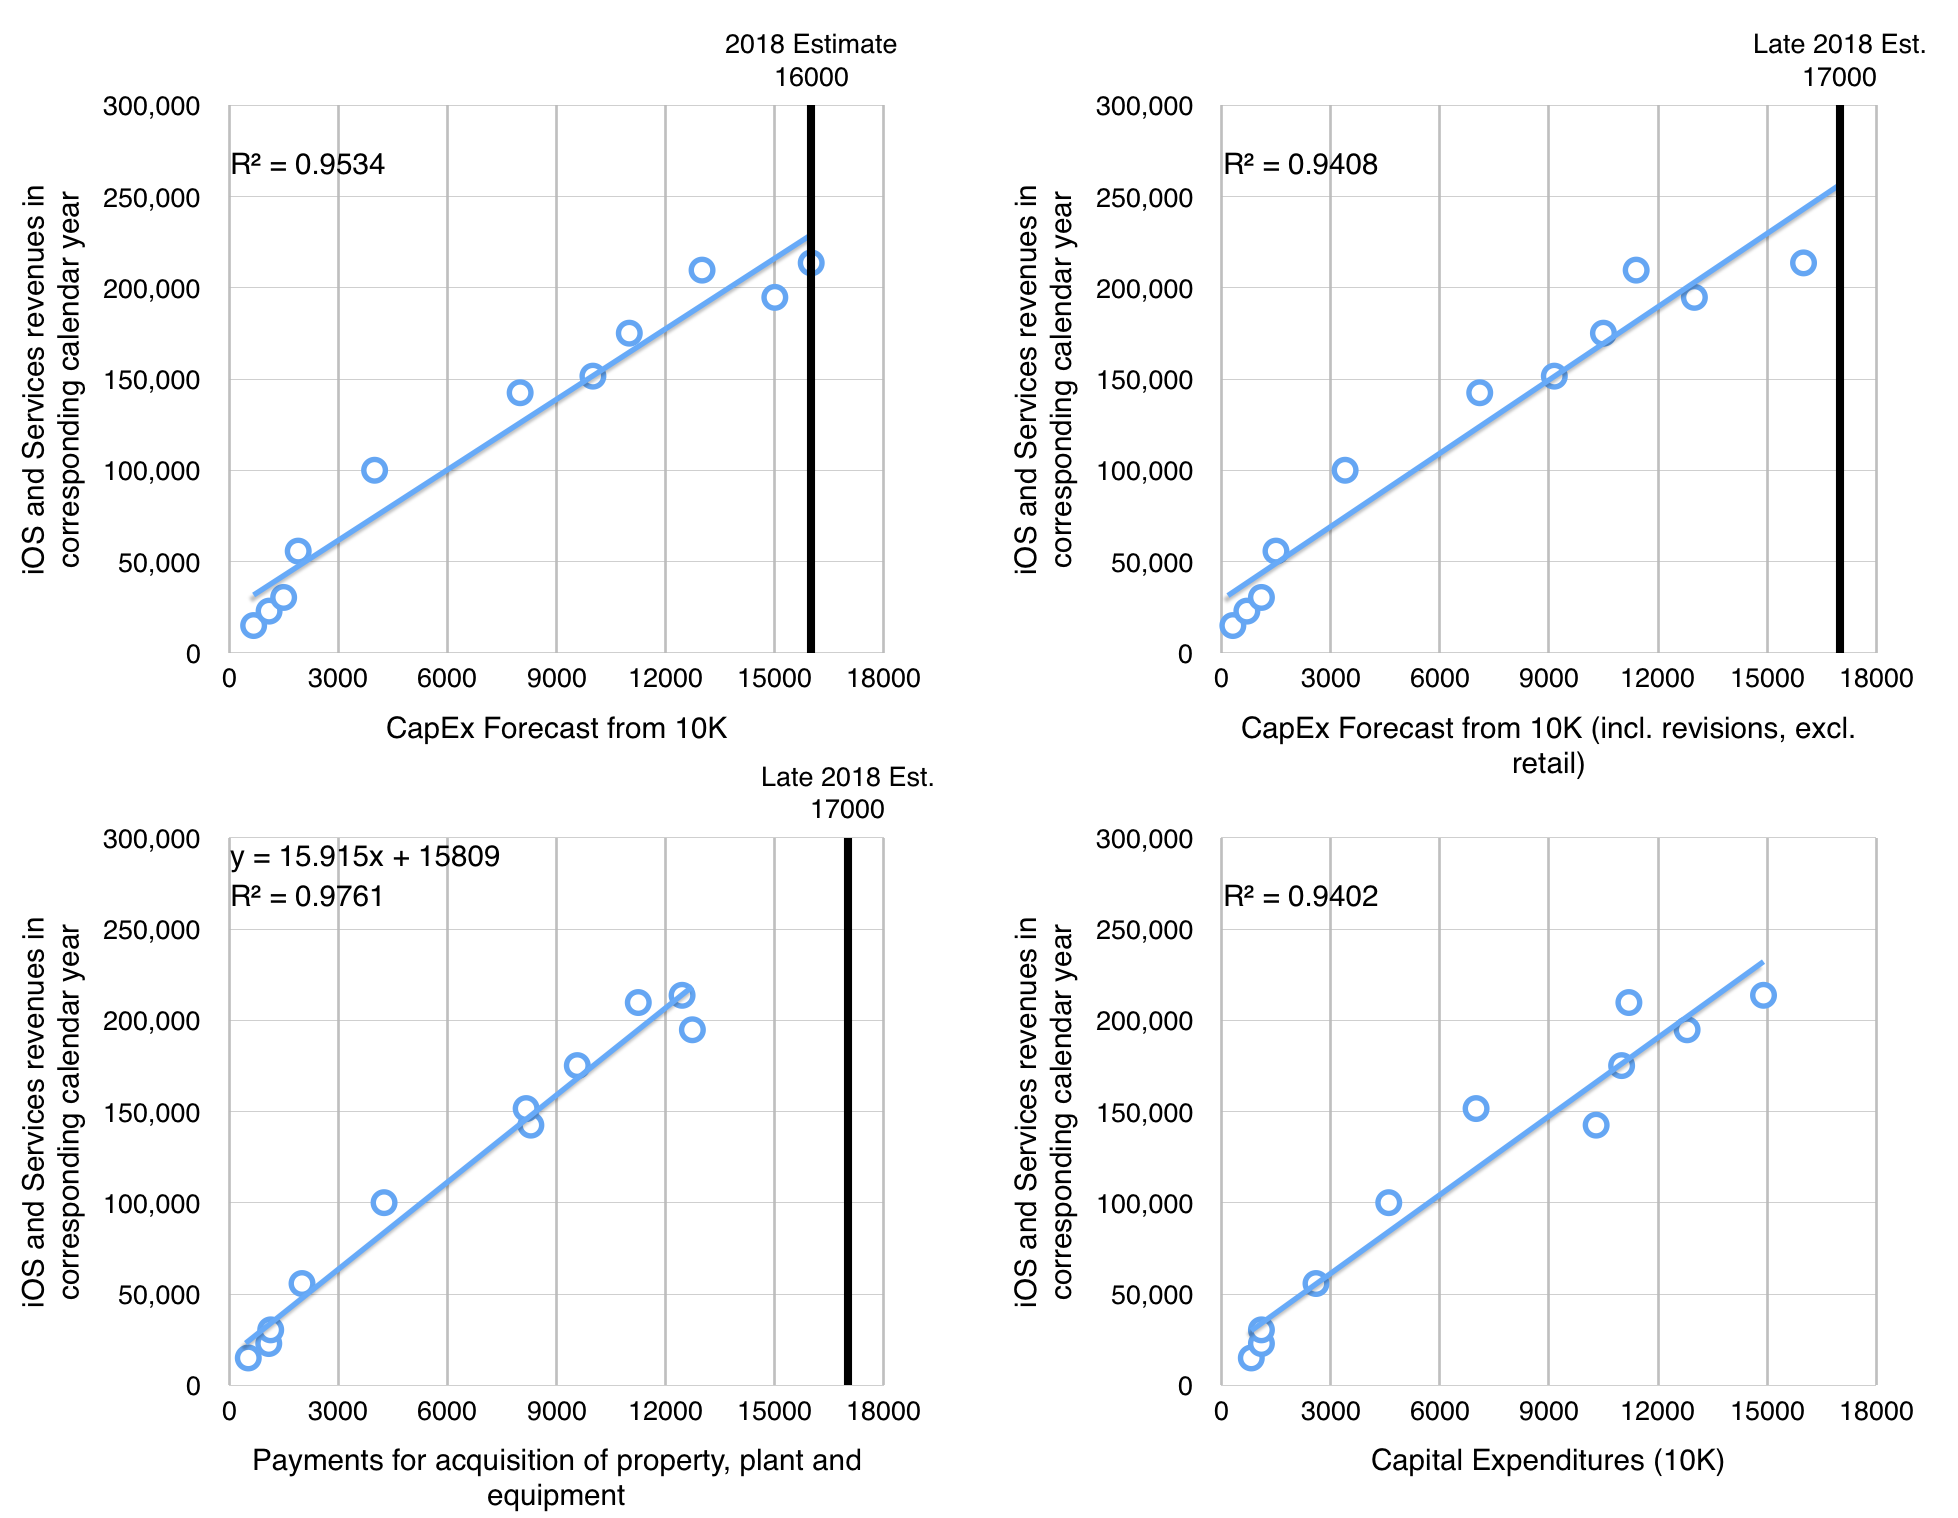
    I caution that this is a yearly forecast and it is revised through the year on a quarterly basis, sometimes up, sometimes down. It's therefore not a perfect indicator and of course the relationship between sales and spending is not perfectly predictable. Note that there are four types of spending that can be measured, two are forecasts (one year and revised) and two are actuals (cash flow payments and reported total expenditures)

    We can measure the best variable that fits the sales data through the coefficient of determination or R-squared. The best fit seems to be with Payments for acquisition of property, plant and equipment (R-squared of 0.976).

    This gives the formula for yearly sales as 15.915x + 15809 where x is the expected total spending. That spending to date has been $10.272 billion and it's probably going to exceed $16 billion for the year.

    Using $16 billion spending total, we can calculate iOS products and services for calendar 2018 of $270.45 billion.

    iOS and Services sales to date have been $103.2 billion with an estimate for next quarter of about 54.3 billion (based on guidance) and thus a total through Q3 of $157.5 billion. Subtracting this from the $270.45 billion expectation from the calculation above gives a fourth calendar quarter iOS revenue of $113 billion.

    Adding $7 billion for the Mac results in a total net sales of 120billion. This therefore is what I'd put forward as a reasonable target for CQ4.

    Note that this is equivalent to a growth of 36% from the 2017 fourth quarter.

    [UPDATE: Original version used total sales rather than iOS related products and services (i.e. excluding Mac). The text has been edited to reflect the correct figures.]
  2. App Story

    Research · 21 comments

    The App Store is almost 9 years old. In that time it has generated about $100 billion in revenues, of which about $70 billion has been passed on to developers and $30 billion was kept by Apple. It's very likely that running the App Store for 9 years did not cost $30 billion so, if it were an independent "business unit" it would probably have been and still be quite profitable.

    But Apple does not run "business units" with separate Profit and Loss statements. The App Store is a part of Services which is an amalgamation of non-hardware sources of revenues but that does not mean it's a business. The purpose of Services isn't to turn a profit or define its value through some metric of financial performance.

    The purpose of Services is to make the experience for the Apple user better. The combination of good experiences allows Apple to be perceived as a valuable brand and that allows it to obtain consistently above-average profitability through pricing power. I like to emphasize that the iPhone at over $600 in average price is more than twice the average price of all the other smartphones and captures over 90% of all available profits.

    This is something that remains after a decade and indeed the price is rising in the face of overall price erosion, all without a decrease in volumes. The sustainability of this exceptionalism is due to no one single thing. It's due to the persistence across all the things Apple does: product, stores, software and services and many other details too numerous to count.

    The result is a large and expanding base of satisfied customers and a large and expanding base of partners both in hardware and software and services. The WWDC event this year showed how the ecosystem of Apple is booming with over 3 million new developers and Keynote screenfuls of partnerships. All this makes for a complex picture but it's a real picture.

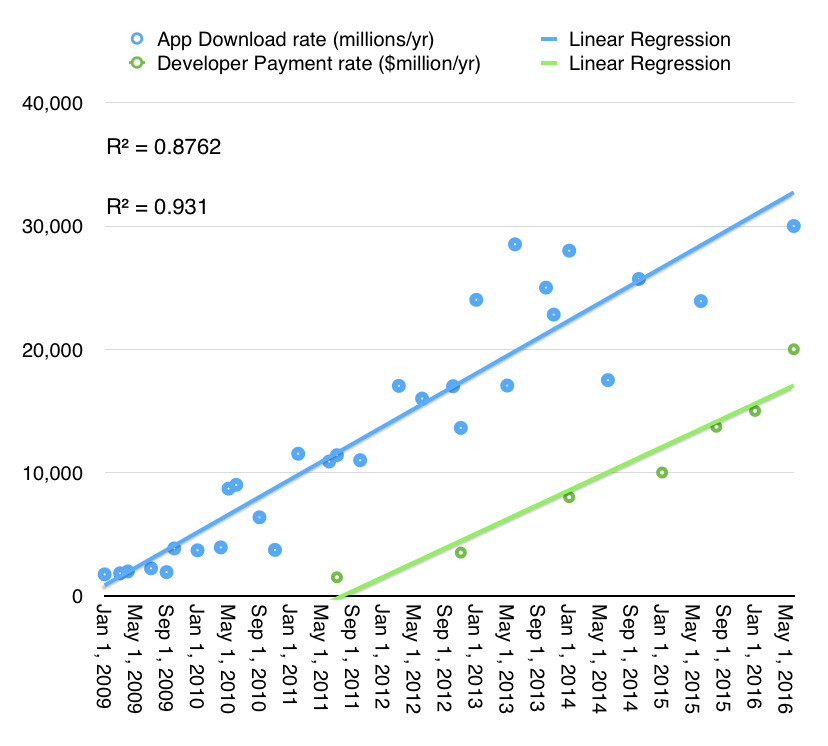
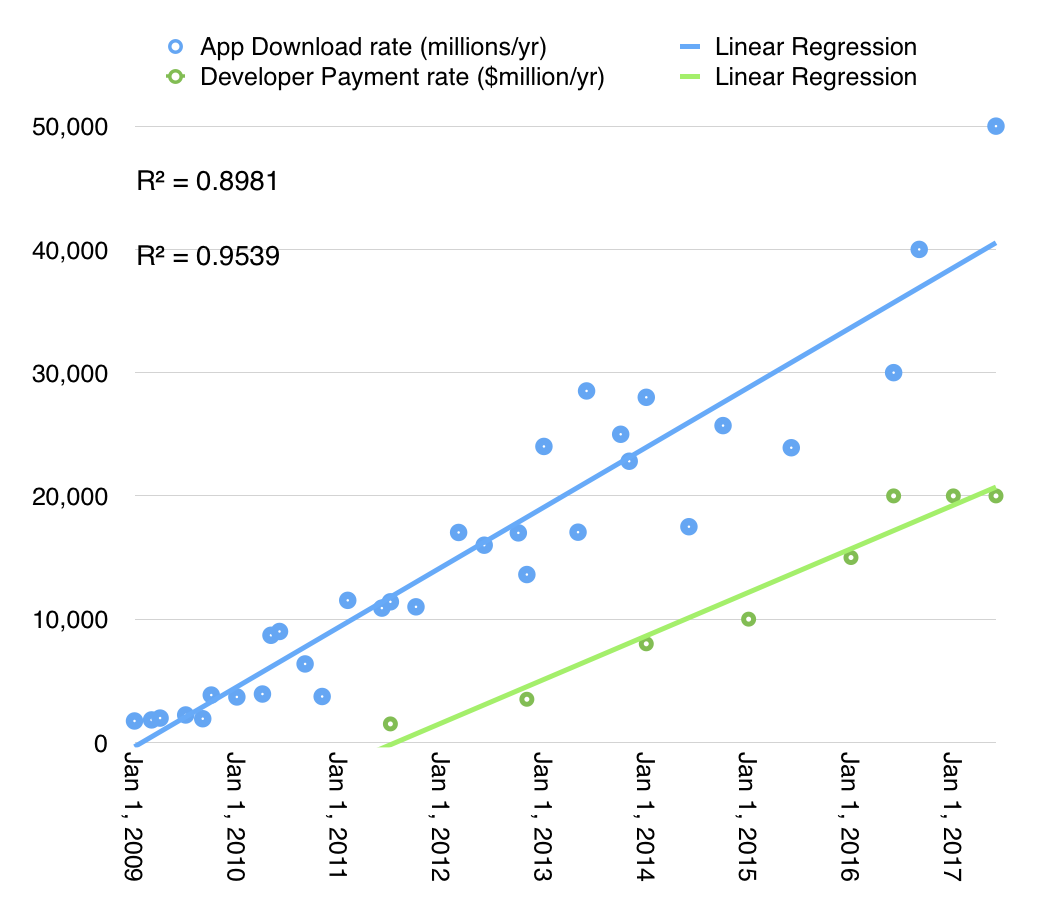
    The latest numbers on Services try to tell this story: 180 billion App downloads from 500 million App store weekly visitors. The download rate is accelerating as shown in the following graph:

    The revenue or payment rates can also be shown as accelerating though at a different rate. In both cases, the story of apps is not yet over, regardless of commentary to the contrary. Much of this growth comes from new markets like China and as India joins the iOS world, there is yet more opportunity emerging.

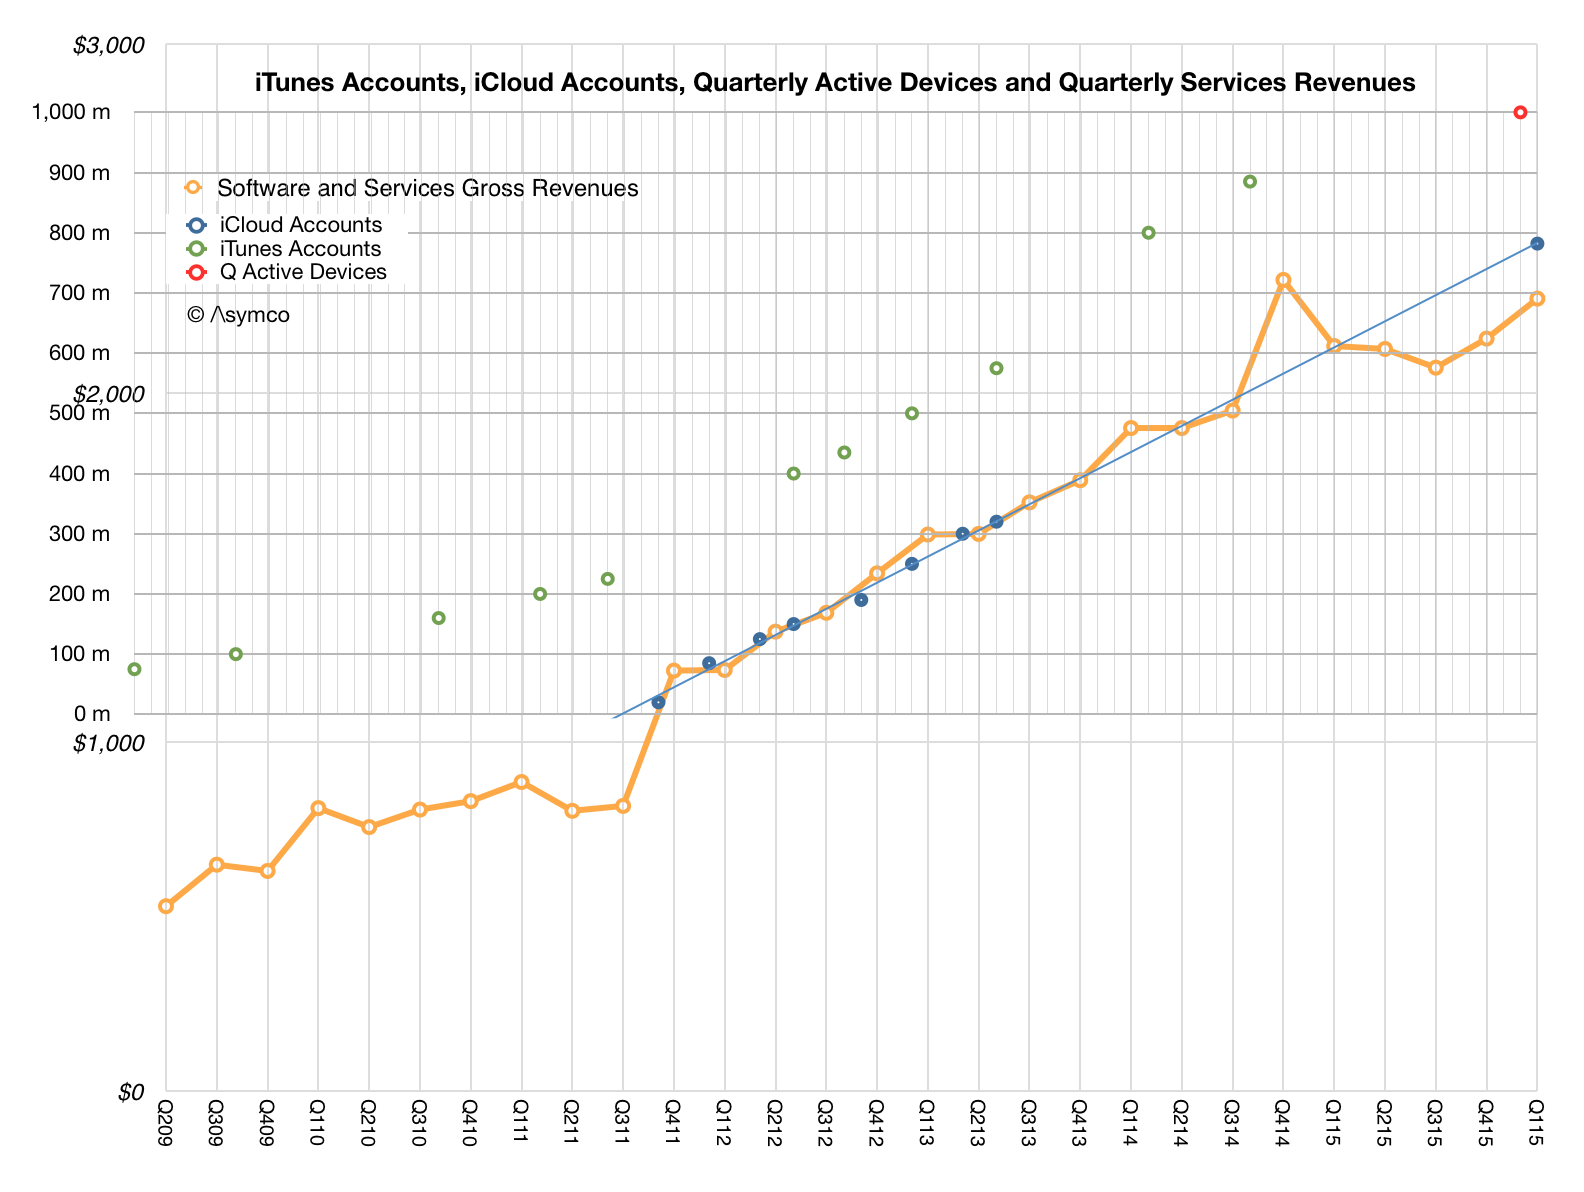
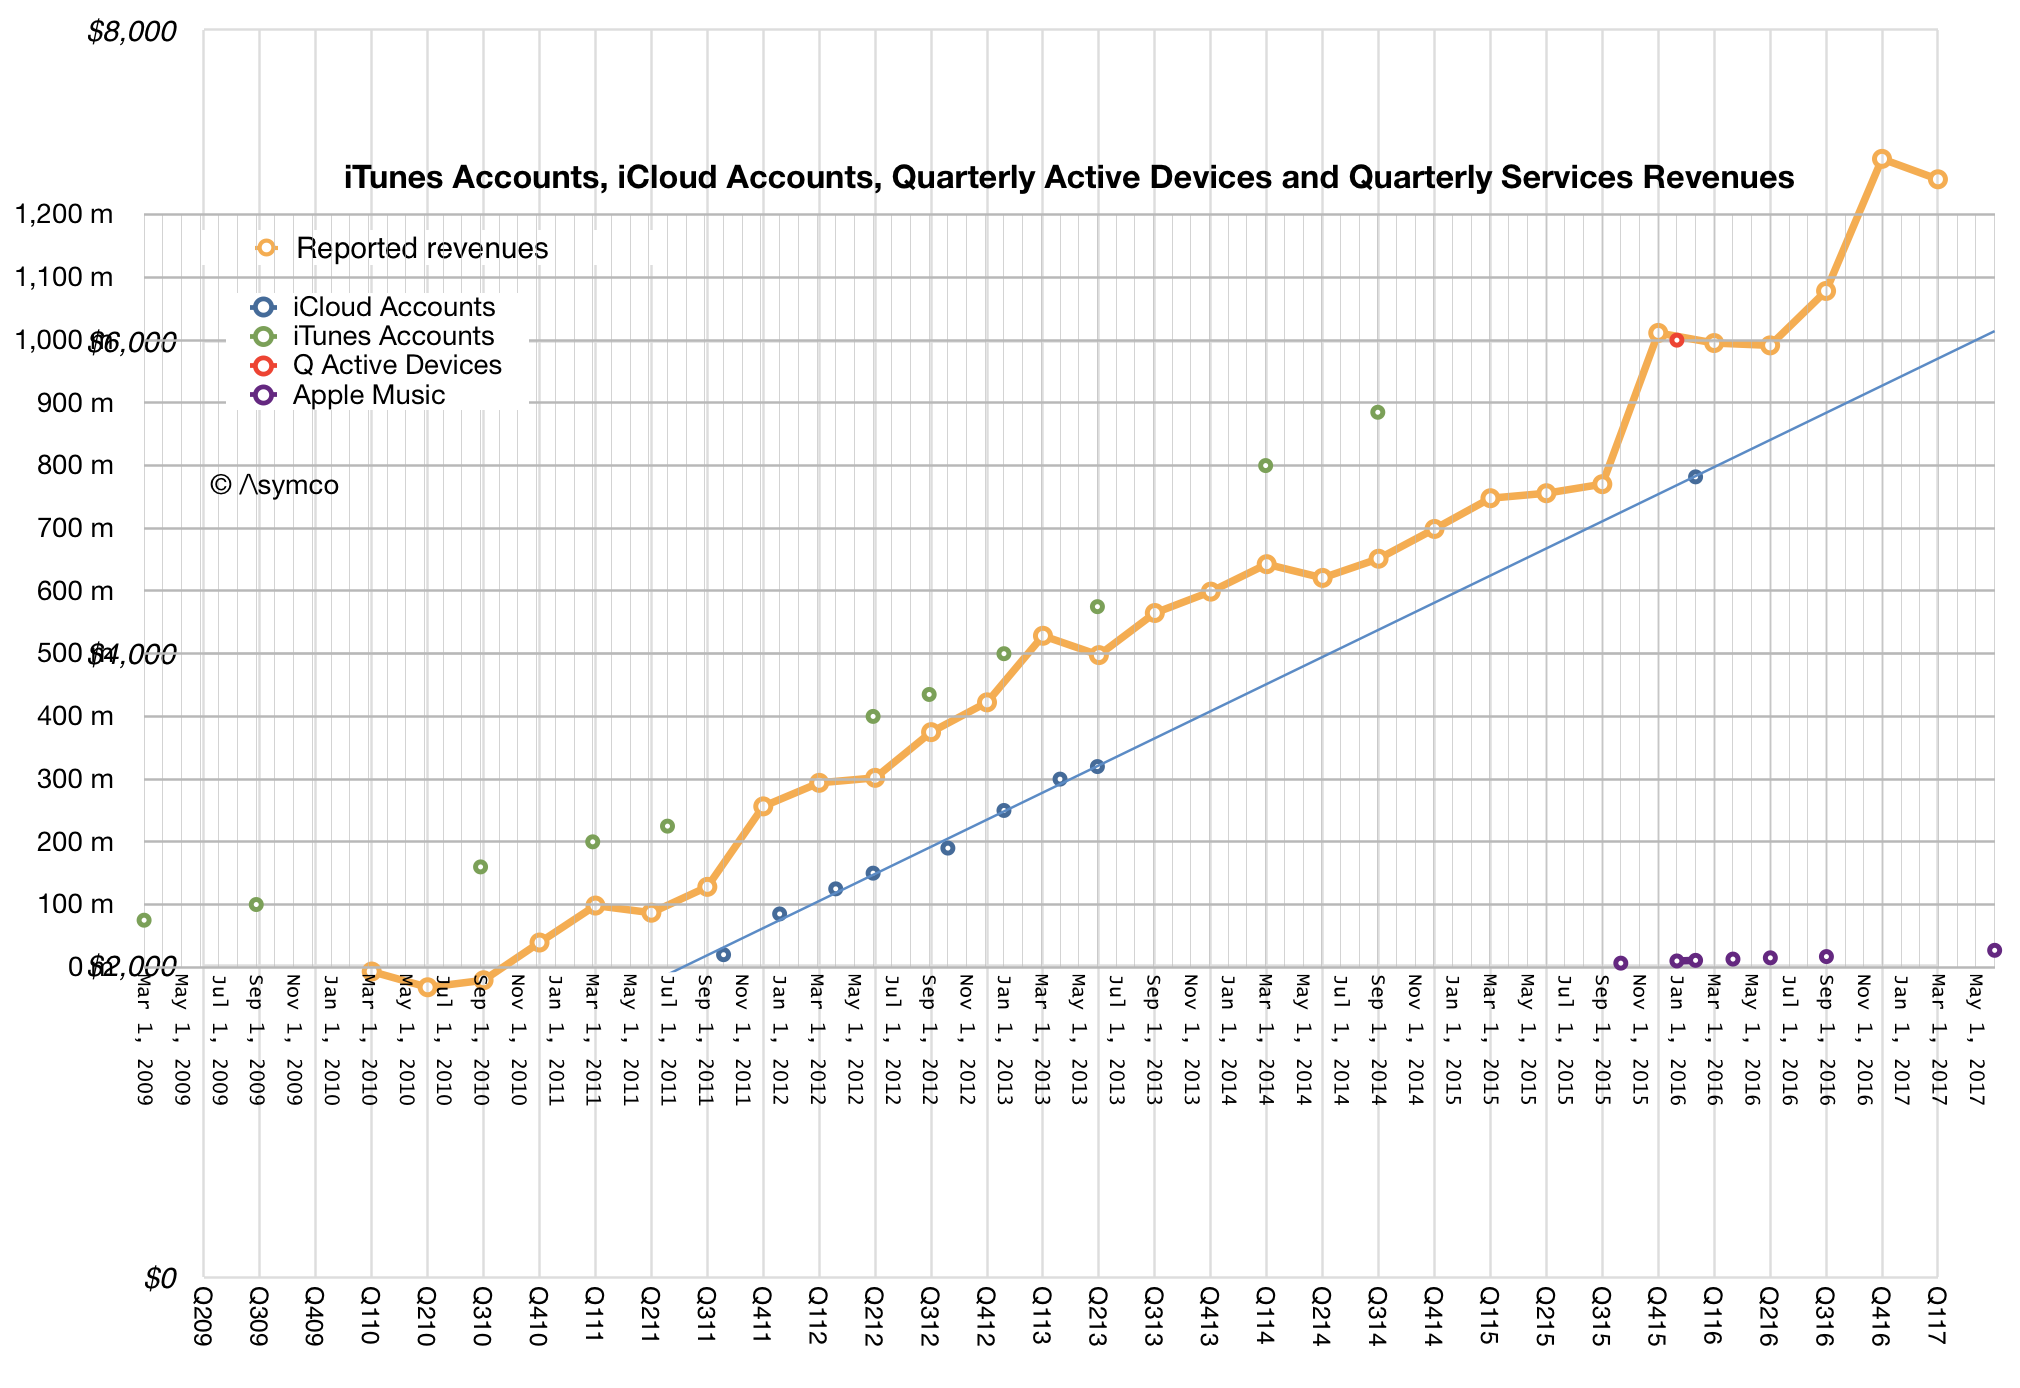
    This enables part of the story of Services which can be tracked with several other metrics: reported revenues, iCloud accounts, active devices, and iTunes accounts are highly correlated.

    The patterns after a decade are remarkably consistent. One would have thought that with mobile saturation in advanced markets, the content story would be told through horizontal lines. What we still see is the same slopes we've seen since the earliest days.

    But the biggest story at WWDC was the re-design of the App Store as a curated content market. The changes are profound: discovery, curation and the surfacing of content have been revamped. It's hard to predict the implications of this but one of the indications of direction was the separation of "Games" from "Apps". This is a jarring idea since if all Apps are content, what makes Games different from other Apps? Is this a genre elevated to a new medium?

    I can't yet get a sense of where this is heading, if anywhere, but the remarkable story of Apps is that it's still an ongoing story. We may be on chapter 2 and we can't predict how many chapters remain.

    Keep an eye on Apps and Services and developers. They are not lagging indicators of success for Apple. They are very much leading.

  3. The First Trillion Dollars is Always the Hardest

    Research · 61 comments

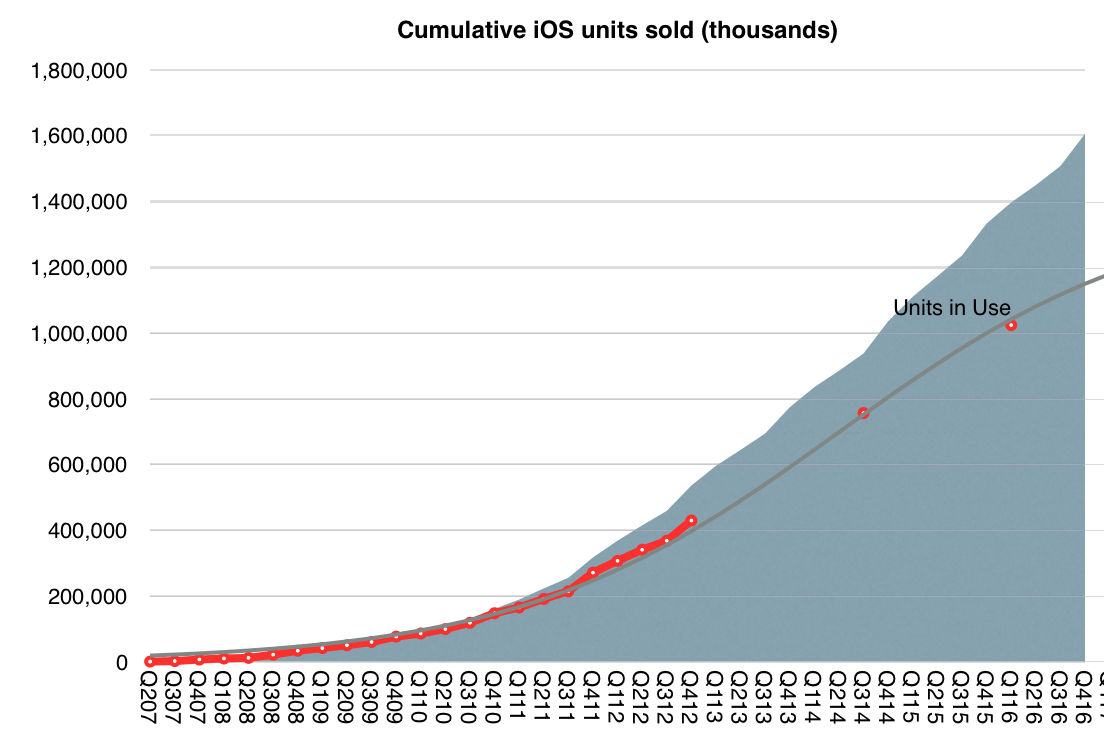
    In its first 10 years, the iPhone will have sold at least 1.2 billion units, ((Includes forecast for first six months of 2017)) making it the most successful product of all time. The iPhone also enabled the iOS empire which includes the iPod touch, the iPad, the Apple Watch and Apple TV whose combined total unit sales will reach 1.75 billion units over 10 years. This total is likely to top 2 billion units by the end of 2018.

    Screen Shot 2017-01-11 at 10.15.00 PM

    The revenues from iOS product sales will reach $980 billion by middle of this year. In addition to hardware Apple also books iOS services revenues (including content) which have totaled more than $100 billion to date.

    This means that iOS will have generated over $1 trillion in revenues for Apple sometime this year.

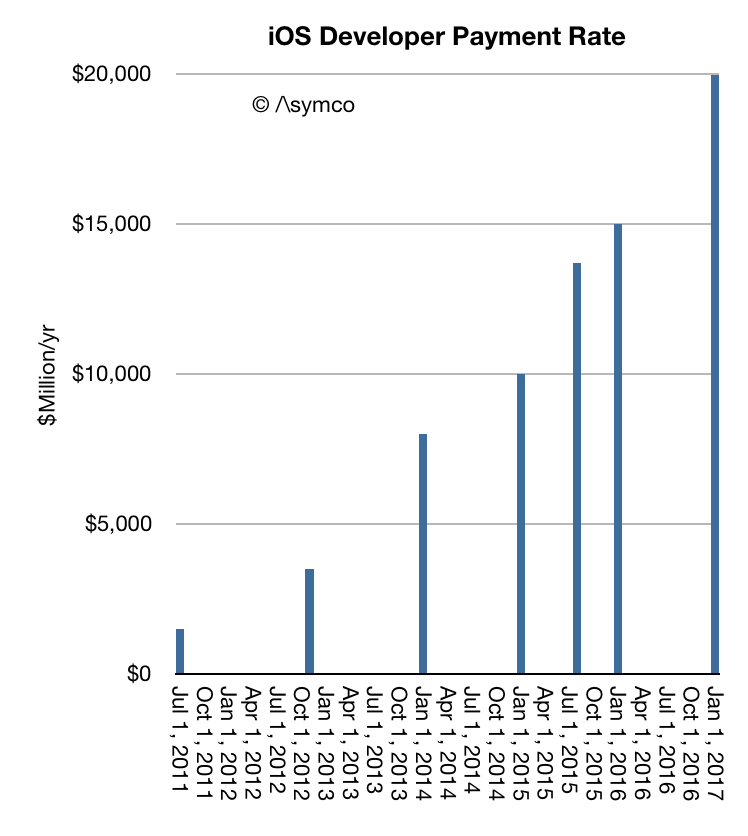
    In addition, developers building apps for iOS have been paid $60 billion. The rate of payments has now reached $20 billion/yr.

    screen-shot-2017-01-11-at-9-41-29-pm

    Not included in this payment total are "mobile-first" or "mobile mainly" businesses such as FaceBook, Twitter, Linkedin, Tencent, YouTube, Yahoo, NetEase, Pandora Radio, Google Search, Baidu, Google Maps, Gmail, Instagram, Amazon, eBay, JD.com, Alibaba, Priceline, Expedia, Salesforce and Other Enterprise Software, Ride Sharing Apps, AirBnB and many other services which monetize independently of the App Store.

    I estimate that the cumulative revenues enabled by iOS across these businesses have exceeded $500 billion, with a rate of revenue soon to reach $300 billion/yr.

    The revenue numbers can only hint at the change in behavior among users. An iPhone is unlocked 80 times a day. Assuming 600 million devices in use there are 48 billion sessions on iPhones every day. 17.5 trillion sessions every year. It is these instances of interaction and engagement which are desired by all businesses built on top of the ecosystem.

    These instances of engagement must be multiplied by the quality of the customers which Apple captures. iOS users spend more and are more loyal than those on alternative platform thus qualifying the platform as "premium" and thus adding to its value in the eyes of developers, content producers and service providers.

    As the install base of iOS increases and as users hire the devices to do more and spend more time with them the virtuous cycle of value creation will continue and accelerate.

    There is a temptation to think that such a business is fragile and will be disrupted. Challengers appear daily and the number of iPhone "killers" is not measurable. One can cite the billion users of Nokia phones which defected. One can cite the loyalty of BlackBerry users that evaporated. One can even cite the juggernaut of Windows and how it became impotent. One can cite the vast number of Android devices offered at low prices.

    But there are reasons to believe that the iOS empire is far stronger and resilient.

    Unlike Nokia's phones, Apple's product is an ecosystem with network effects and dependencies on software and services. It's also a monolithic product with a singular interface and form factor.

    Unlike BlackBerry, the iPhone does many jobs--too many to count. Indeed the iPhone evolves and changes its core value over time.

    Although different in many ways from Windows there are strong similarities in terms of loyalty and persistence of users. iOS even developed a dominant position in enterprises. Microsoft's attempt to become a hardware company is a testament to the confluence of the two business models.

    And whereas Android was originally seen as the "good enough" iPhone, potentially disrupting it, it turns out to be the ersatz iPhone. Chances are higher that users will switch from Android to iPhone and not the other way. Again, the reasons have more to do with the ecosystem and quality of users (which are hard to measure) than with the hardware (which is easy to measure.)

    As we look toward the second decade of the iPhone, the expectation isn't one of another "big bang" but a process of continuous improvement. The market is nearing saturation so the goals must be to capture more switchers from Android. Apple has achieved this with the Mac: survival, persistence and eventual redemption.

    More exciting is the apparent expansion of a network of ancillary "smart" accessories. The Apple Watch, the AirPods, Pencil and possible new wearables point toward a future where the iPhone is a hub to a mesh of personal devices. The seamless integration of such devices is what has always set Apple apart.


  4. State of the Ecosystem

    Research · 9 comments

    At WWDC 2016 Apple offered a set of new data points to illustrate its ecosystem's robustness.

    First, the number of registered developers increased by 2 million in the last year to a total of 13 million. That is a growth rate of 18%. To compare this total consider that Oracle claimed in 2014 9 million Java developers and IDC claimed in 2014 there were 18.5 million software developers in the world, of which 11 million were professional software developers and 7.5 million were hobbyist developers. It's therefore possible that Apple's "market share" among developers is close to 70%.

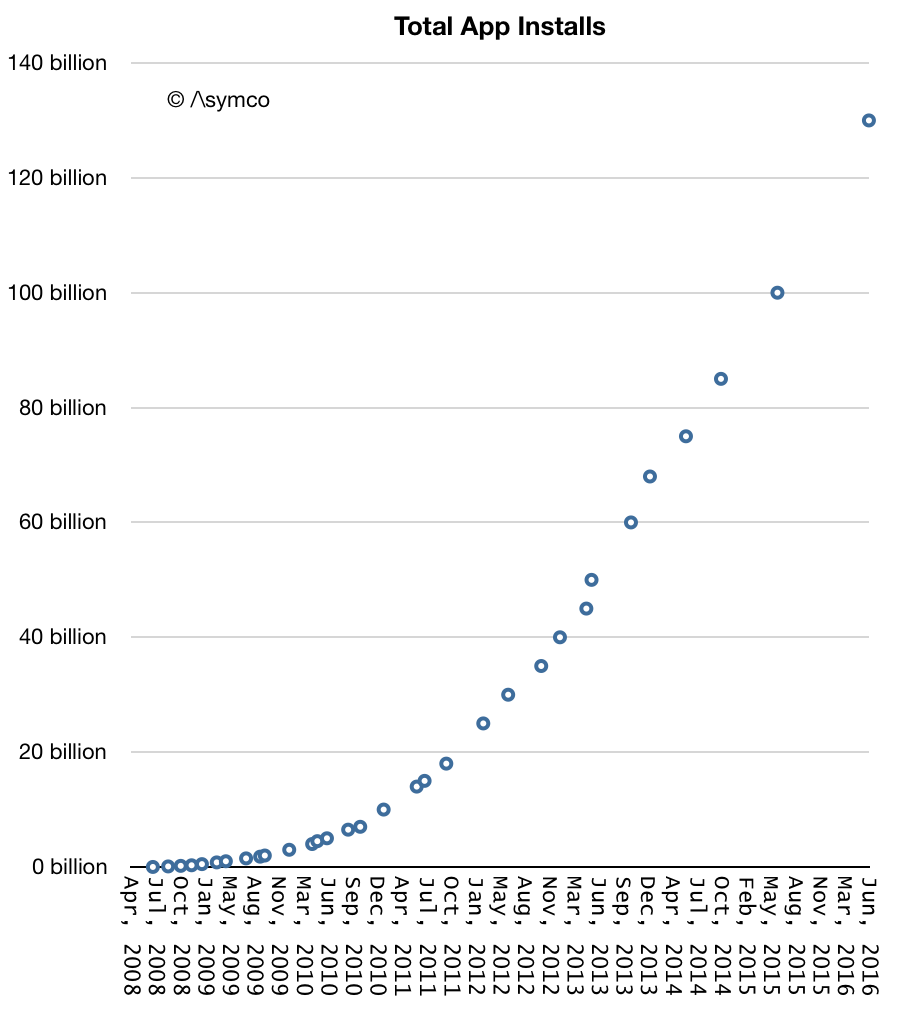
    Second, App installs have now reached 130 billion. The cumulative growth is shown in the graph below:

    Screen Shot 2016-06-16 at 12.25.11 PM

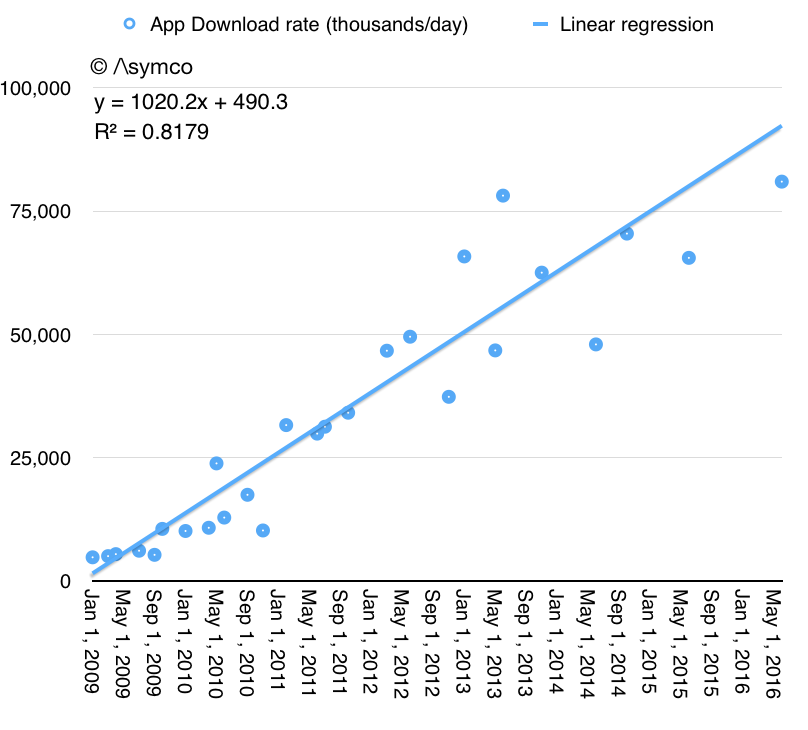
    The rate of growth is also shown in the following graph:

    Screen Shot 2016-06-16 at 12.33.35 PM

    Note that the rate of growth continues to increase and is now above 30 billion/yr. It turns out that apps continue to be a popular download item. The size of the audience continues to grow (see graph below) and it's therefore understandable that activity in the store continues to grow.

    Screen Shot 2016-06-16 at 12.32.44 PM

    Third, the rate of payment to developers has also increased to over $20 billion/yr., with the total payments having reached $50 billion.

    Screen Shot 2016-06-16 at 12.25.52 PM

    The graph above shows the derived payment rate (in green) relative to the download rate (blue). Although not completely parallel, the overall correlation is plain to see.

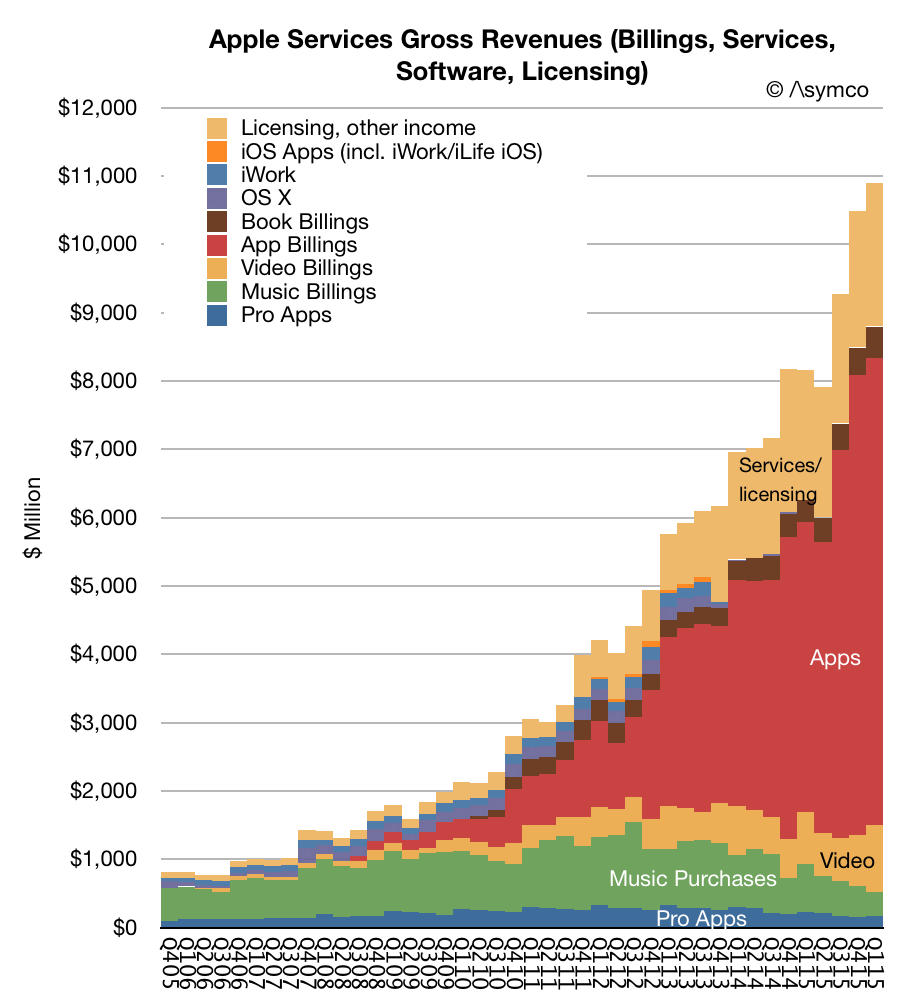
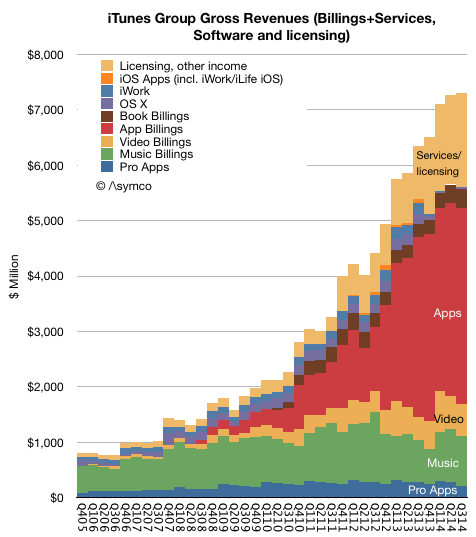
    Fourth, there are more platforms than ever (four device and three services). As a result, Apps and services continue to outgrow traditional content revenues. Gross revenues for iTunes/Apps/Software/Services/Licensing is shown below:

    Screen Shot 2016-06-16 at 12.26.29 PM

    Overall, economic activity transacted directly through Apple's platforms is approaching the run rate of $40 billion/yr. It continues to grow at about 20%, so it's foreseeable that it will reach at least $50 billion/yr.

    It's hard to compare to other ecosystems as metrics vary but this rate alone places Services as one of the larges businesses in the world (service or otherwise).

    There are other ecosystems "on top" of iOS which transact outside the Apple systems (and hence are not reported in the total above). These include Facebook, Google, Uber, Amazon and other economies which use iOS devices to enable engagement. These add up to hundreds of billions of dollars in transactional value. My estimate is that all mobile services are at least $250 billion/yr today and will reach $800 billion/yr in 2020. Apple is and will continue to be the home or enabler to the majority of this revenue.

    But the more profound point to be made is that this ecosystem relies mainly on direct payments by the beneficiaries of the service or content. Apple contents itself with the $35 billion it can transact through its own storefronts because it feels that the business models are compatible with its brand.

    When it comes to all the ways of "monetizing" platforms, this may be a very conservative strategy but it's one that also avoids the potential pitfalls of social scandal.

  5. The Next 40

    Research · 28 comments

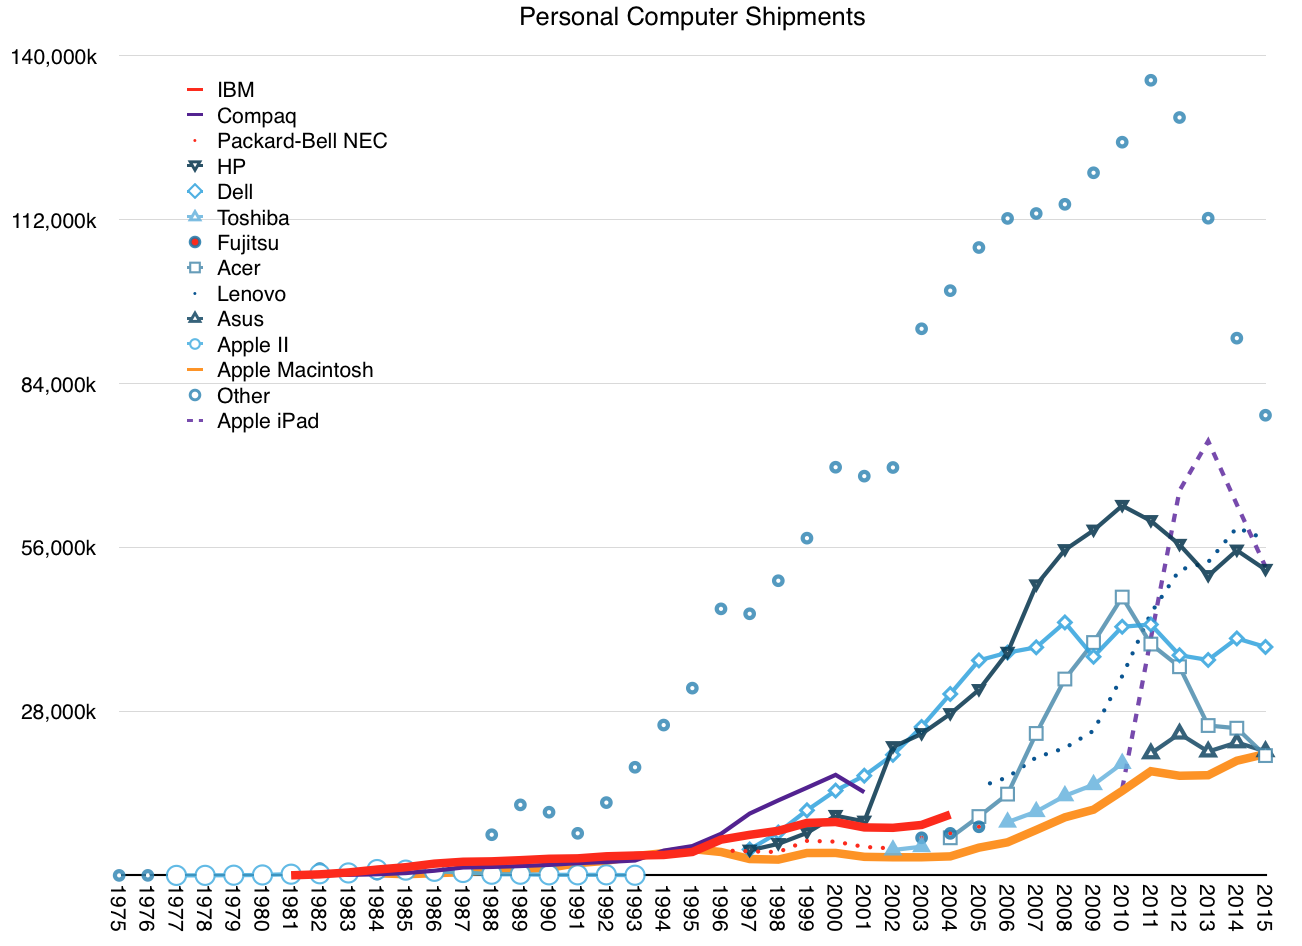
    In Apple's first 40 years it shipped 1,591,092,250 computers ((including Apple II, Mac, iPhone, iPad and iPod touch; excluding Apple Watch, Apple TV and other iPods. Includes Q1 shipments estimated at 63,597,000 Macs, iPhones and iPads)).

    This shipment total is higher than any other computer company in its first 40 years. Actually there are no other PC makers that are 40 years old. One computer maker (IBM) is older but they only sold PCs for 24 years and what they still sell they don't sell in high numbers.

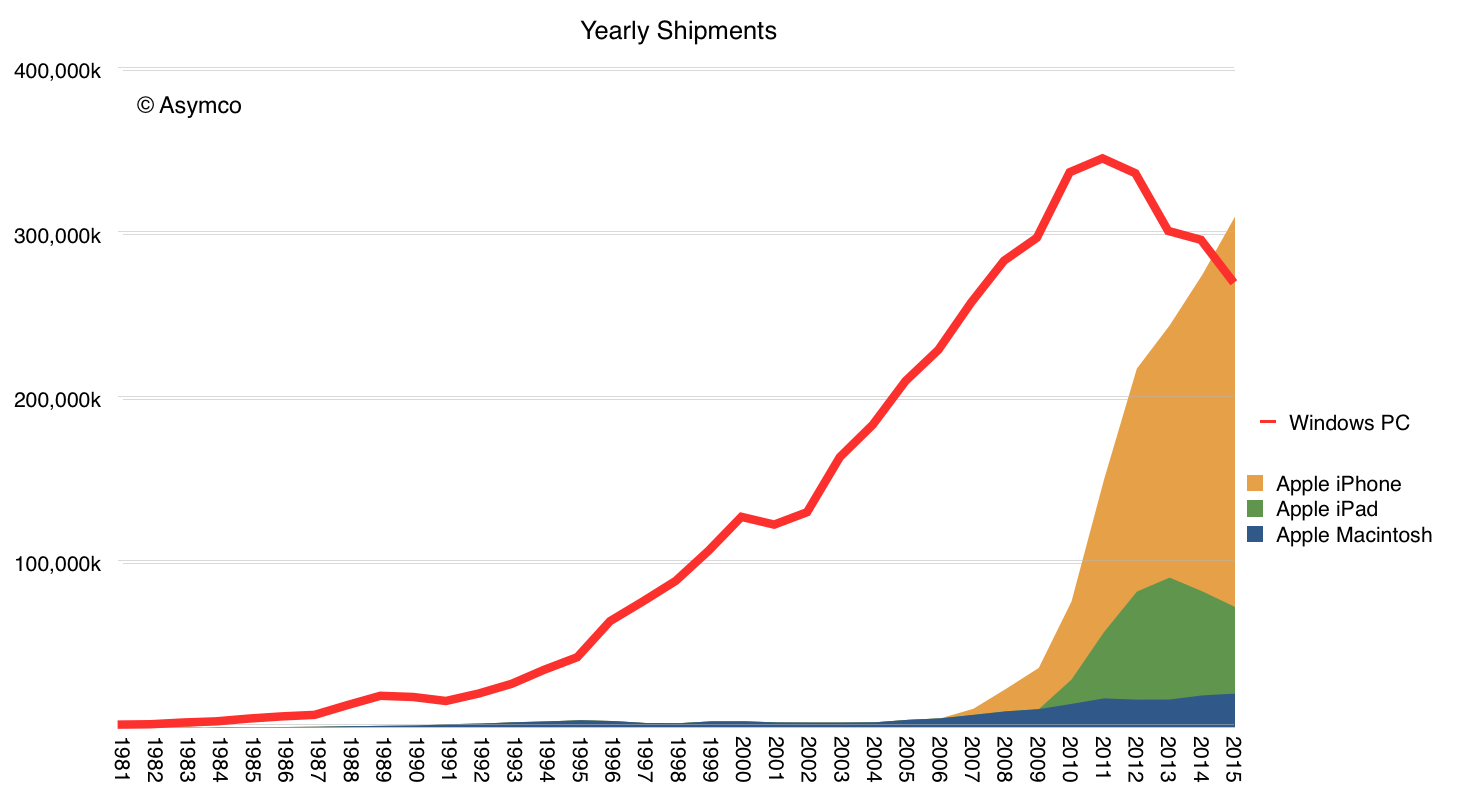
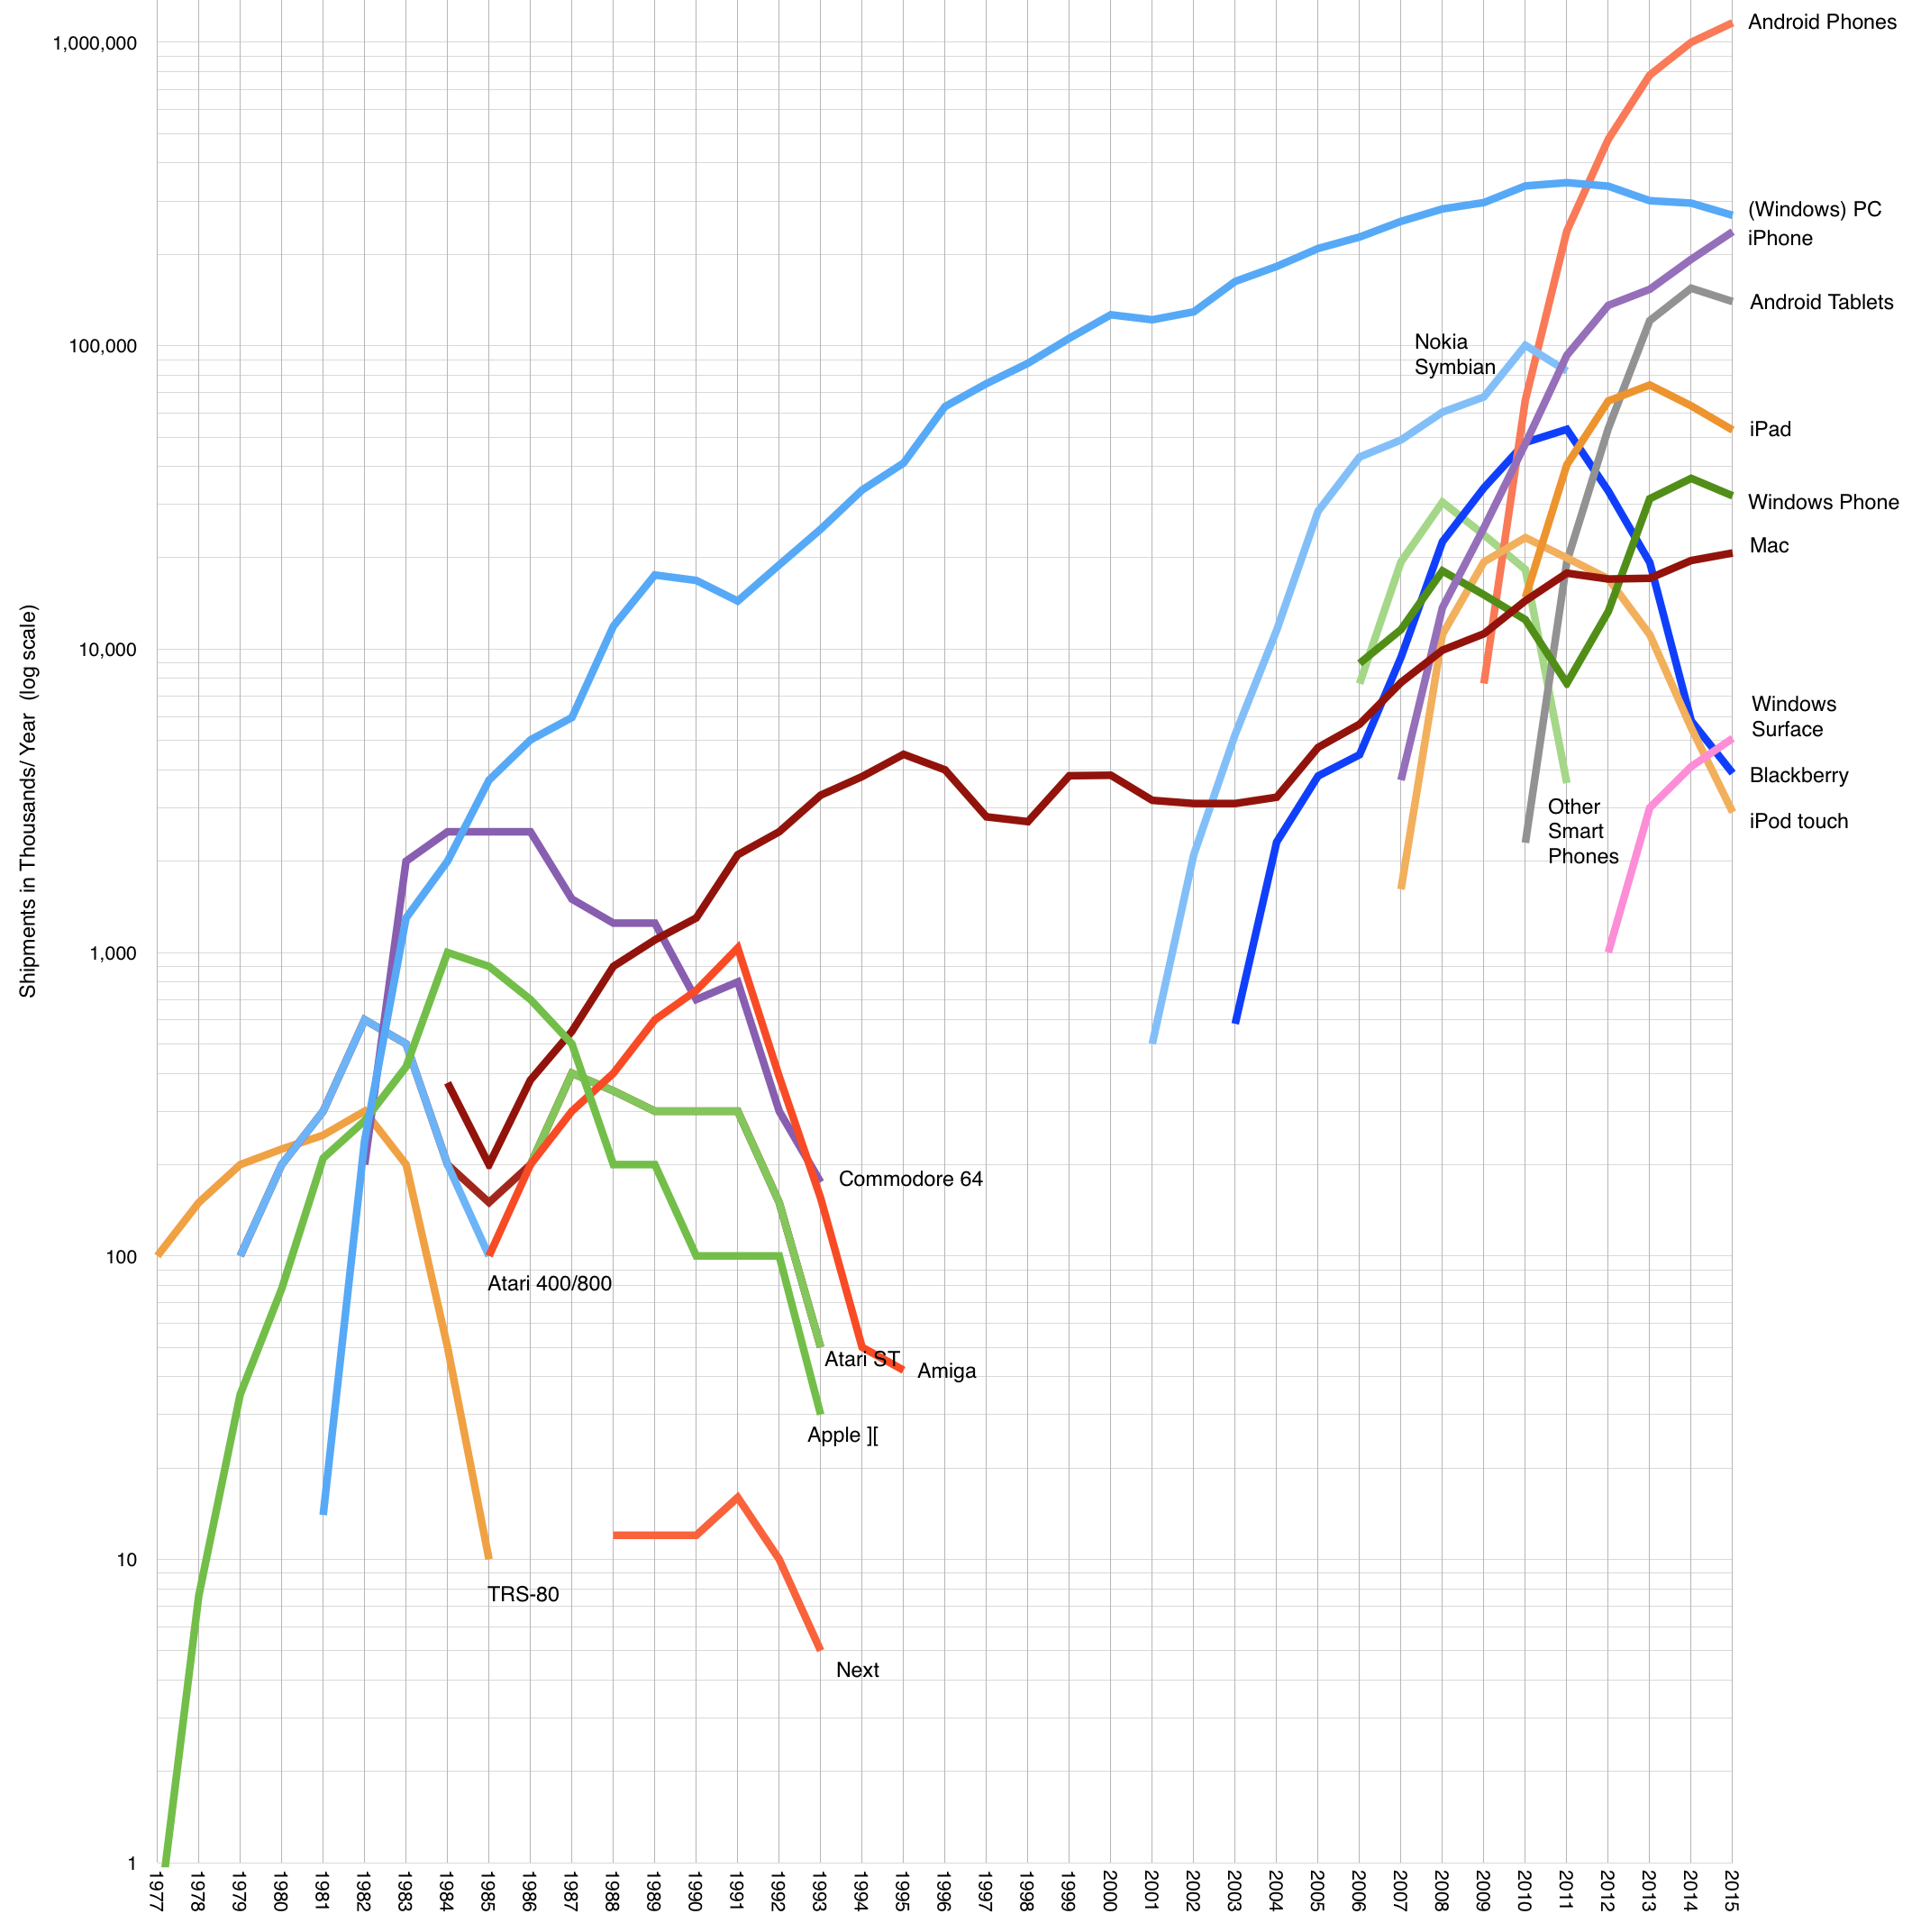
    That does not make it the top seller in a given year. Looking at only the Mac, Apple's traditional form factor personal computer, Apple has only returned to the top 5 last year. Only if including the iPad it was the top computer vendor in 2011 and including iPhone, it was first in 2009.

    Screen Shot 2016-03-28 at 11.36.56 AM

    After having a 40 year run and after selling more computers than all American and Japanese computer companies put together, how should we think about the next 40 years?

    First, clearly Apple shifted from being a "computer company". It has already changed its name to exclude the word "Computer" but that has been interpreted as saying that it sells devices (which happen to also be computers.) The word "computer" is already archaic. We stopped using computers to compute in the 40s. We used them to make decisions, keep track of things, speed things up and then to communicate and then to entertain.

    Devices, it seems, are what customers mainly use to do, well, everything. Computing has grown to encompass most activities we engage in. So is Apple then a device maker?

    More broadly, irrespective of the name, is Apple at 40 still defined as a hardware company? Certainly Wall Street ((i.e. average people)) still think so. The conversations one hears clearly consider Apple's future to be tied to the sales volume of specific products. At one time it may have been the Mac, another, the iPod and now the iPhone. This thinking is again a legacy of where the company was but mainly it's a reflection of how revenues are reported.

    We see a line item in the income statement that says "iPhone" and it has a big number next to it so we, of course, fixate on that big shiny number. But if we were to unpack that number and see why it's so big we would discover that buyers are buying something other than what financial statements report.

    Buyers are buying experiences, I hear you say. Yes, but more than that. Much more. They are buying safety, comfort, convenience, simplicity, productivity. They are buying modules to combine with other modules that help to do something. Something better. They are buying hope, satisfaction, escape or vanity. In other words they don't know what they want but know when they have it. They trust products unseen which have a reputation of delivering that which they think they might like, without knowing what that is. By employing the product, and a whole lot more—effort, time, mental energy and repetitive actions—they learn to exploit a product to achieve satisfaction.

    Screen Shot 2016-03-28 at 4.59.14 PM

    Products are enablers, as are experiences and software and ecosystems and services. They are modules used in a melee of activity to make the user feel they are making progress. And if that module is better than no module then it will command a price and if it's better than another module or modules then it will command a premium. And if most people agree then it will be popular with many. And only if all these are true will it create a big number on a report.

    And so we must search for other names to call a company that delivers an enabler that may lead to progress. Crude categorization like the reporting of finances leads to self-deception and a loss of opportunity to understand. Firms are often victims of this self-deception because they start believing that customers buy the things they sell. They start to believe that what is on their financial reports is a reflection of the value they create. It's a simple mistake to make, but a mistake which leads to catastrophe. If its data is mis-categorized, by chasing numbers the company runs away from opportunity, leaving it to competitors otherwise unencumbered with knowledge of numbers.

    Assuming Apple avoids mis-categorizing what it does, will it be a "solutions" or "services" or "brand" company? Is it, as I used to say, a "blockbuster manufacturing line"?

    Yes, and still that's not all it could be. Nor is it enough to understand what will come.

    My simple proposal is to think of Apple (and actually any company) as a customer creator. It creates and maintains customers. The more it creates, the more it prospers. The more customers it preserves the more it's likely to persevere. This measure of performance for a company is not easy to obtain. It's not a line item in any financial report.

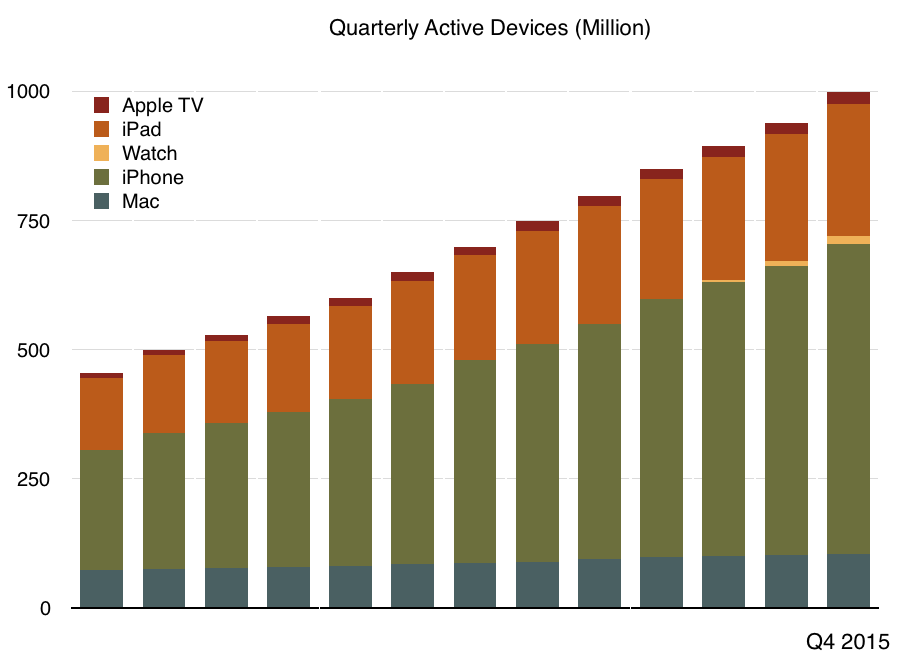
    The closest figure we have is that today Apple has one billion active devices in use. We're not told of the total users or total customers because Apple cannot count people or wallets as accurately as it can count active devices. But as imperfect as it is, this number gives us a way to get close to counting customers.

    So we know that at least Apple has created a large number of customers. Knowing total devices sold and number in use means that we can be sure that 63% of all the computers Apple sold are still in use. This means that most customers are recent customers. That is not necessarily good news. New customers are not well understood. We don't know how these new customers might behave in the future.

    Screen Shot 2016-03-28 at 12.28.22 PM

    Will they come back for more of whatever Apple makes? If we look at the history of competitors or technology products in general, chances are they won't. The industries Apple has been a part of are filled with one hit wonders. Companies which had parabolic trajectories and built no loyalties. Statistically speaking, success in Apple's markets is always followed by failure.

    But what if we did not seek correlation but looked for causation? What if we ignore statistics about companies other than Apple and focus on statistics about Apple's actual customers? Rather than assume all companies are the same, what if we assume that some can be exceptional?  What if we we look for the anomalies, not the clusters?

    We might want to ask about the causes of success or failure for a single company. We might want to sample its specific customers.  We might want to observe how Apple's own customers behaved in the past.  We might want to use theories of brand value or theories of network effects or theories of software ecosystems.

    These measures, rather than those of "comparable companies" might lead to different conclusions: That customers are loyal, that they will value the brand and that they are invested in a network. In other words, that they will buy from Apple again.

    If we then factor in the size and persistence of Apple's audience (customer base) we might conclude that there are factors which will allow it to grow rather than shrink. My analysis based on public data shows that the customer base has been increasing steadily.

    Screen Shot 2016-03-28 at 4.17.19 PM

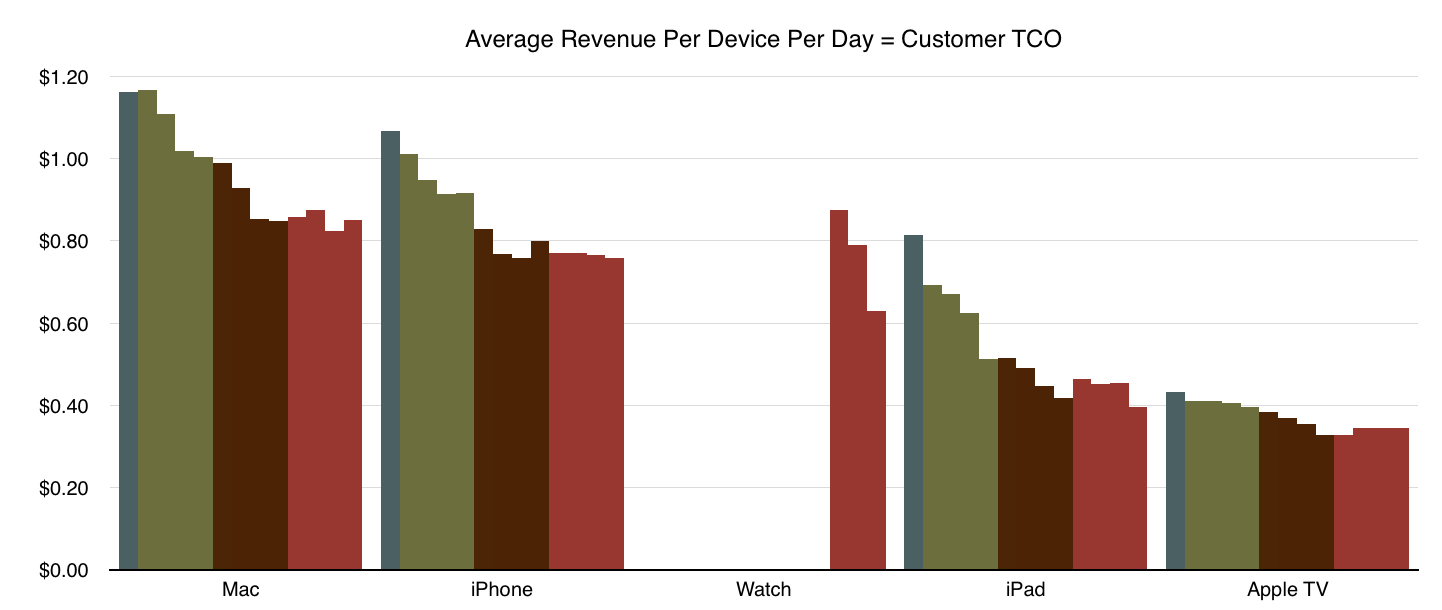
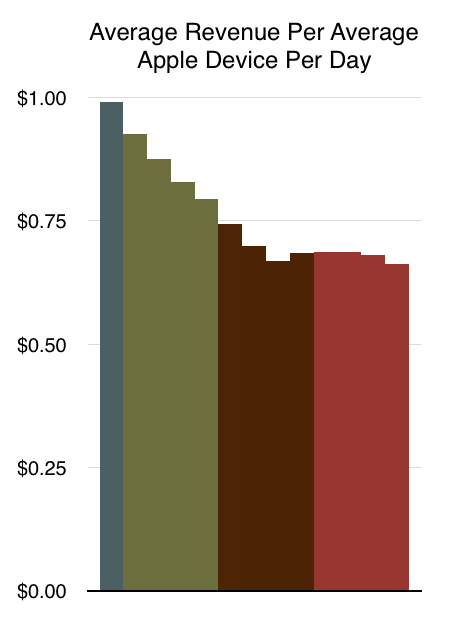
    Considering this audience and the revenues generated, we can categorize the revenue by active device as follows.

    Screen Shot 2016-03-28 at 4.15.51 PM

    Each bar represents that product's revenue per day in a given quarter (from Q4 2012 to Q4 2015). Each year is therefore represented by a different color. Dark green for 2012, light green for 2013, burgundy red for 2014 and dark red for 2015. For example, each iPhone in use was generating exactly $1/day in revenues (including services and accessories) during the first quarter 2013.

    This allocates all of Apple's revenues to these products and by proxy to customers.

    In summary, the "average revenue per Apple device per day" is currently $0.68. If we assume one unique user per device then Apple collects 68 cents from each customer each day. ((In reality the figure may be closer to $1, as there are likely to be more 1.2 to 1.5 devices per person.))

    Screen Shot 2016-03-28 at 4.19.39 PM

    Combining the history of customer creation and customer preservation with the value obtained from each customer implies that the next 40 years will be about creating another large tranche of customers whose willingness to spend on whatever Apple creates will be relatively unchanged.

    We don't know the limit. One billion was hard to imagine even one year ago. We might see two billion devices in short order. Perhaps not. Perhaps as we have a multitude of devices about us all day the number will become less meaningful. But if the number of middle class customers grows and as Apple keeps its products within their reach, there is no reason to think that there will be a reversal of the last 40 years in terms of customer acquisition.

    This analysis contradicts the current perception of the company as reflected by its stock price. That price assumes the audience will wither ((With a P/E ratio of 11, without a change in revenue per user, the only justification would be the audience shrinking by more than 90% over the next 20 years.)) That is not insanity. It is what we could expect if Apple were unexceptional.

    We could surrender to correlation and ignore causation but statistics show that such an approach rarely works.

    -------

    Incidentally, this and a lot more will be discussed at the next Subscribe conference.

  6. Unicornia

    Research · 14 comments

    Unicorns typically are valued on the basis of number of users. While they are not yet monetizing those users, their growth and engagement metrics are expected to be off the charts. As there are no revenues (or profits) the $billion valuation hinges on a nominal value of $/user. That figure is based on comparable companies (e.g. Facebook) which do monetize their users.

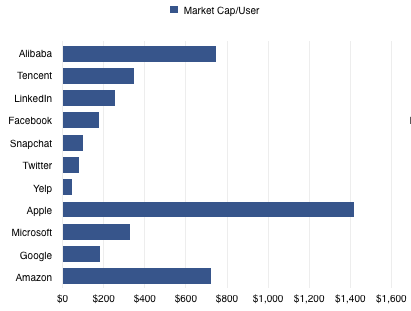
    Since the unicorn's capitalization/user defines its valuation, which company should be considered comparable? Unfortunately they range widely. There are many alternatives. The graph below shows a few Market Cap/Mobile User rates ranging from $45 for Yelp to $747 for Alibaba.

    Screen Shot 2015-05-15 at 5-15-2.47.16 PM


    Note that I've also added companies which may not be considered as unicorn comparables because they are not usually valued on a per-user basis. Apple, Microsoft, Google and Amazon are priced by product sales, typically. However, most of them operate and self-define as service organizations. Microsoft has been "monetizing users" for decades using a recurring revenue model. It has a "SaaS" business logic for most of its revenues. Google ((Google users are estimated at 2 billion active Android/GMS devices)) likewise. Amazon reports its active users every quarter and obviously is measuring itself by that metric.

    Apple ((The assumption here is that Apple has 520 million active users which is based on iOS devices in use estimates)) is the least likely to be seen as a company whose value is a function of user base. Nonetheless it behaves entirely on that basis. The company's entire strategy depends on satisfying its customers and building its brand which can only have one outcome: loyalty and repeat purchases. The services and software they offer can be seen as supporting that brand loyalty which is converted to profit through an above-average selling price.

    Being mature of business model therefore does not exclude a company from being valued like all the kids are these days.

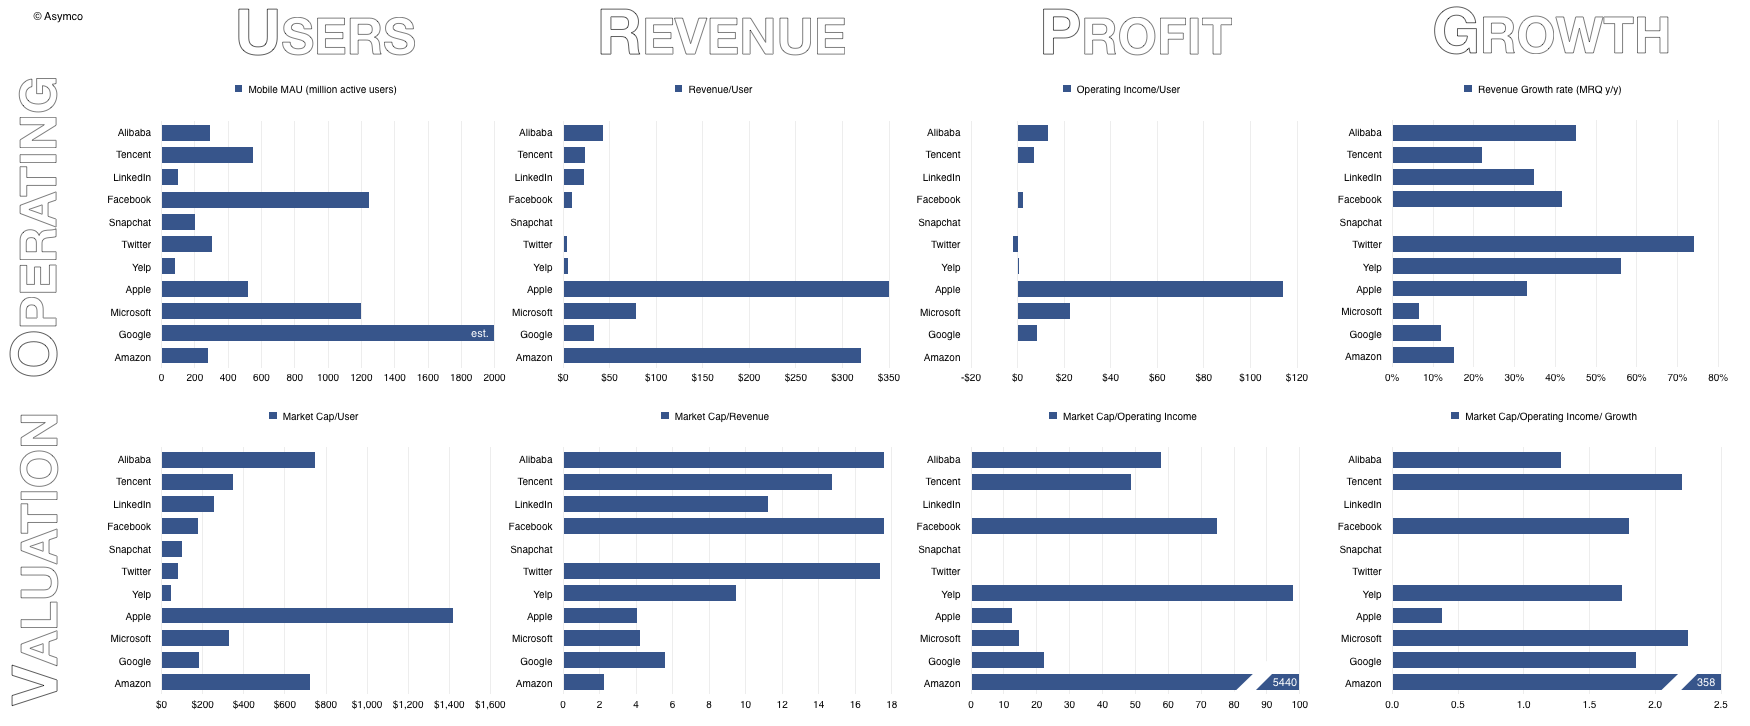
    So, if we do look at the value/user metric we might as well look at the revenues, operating profit and growth data.

    Screen Shot 2015-05-15 at 5-15-3.09.43 PM

    Unicorns are therefore characterized as having negligible revenue or profit but significant growth. The growth of Alibaba, Tencent, LinkedIn, Facebook, Twitter, Snapchat and Yelp should be seen in the 50% y/y range. The growth of mature companies is more modest: Microsoft (<10%), Google (12%), Amazon (15%).

    Apple is an exception with recent growth in the 30% to 40% range.

    Markets therefore value internet services at multiples of 10 to 20x revenues and 50x at least in terms of operating income. These multiples don't yet apply to Unicorns, since they typically don't have revenues, but the expectations are typically in this range once they do.

    Mature product companies are valued more cheaply with 2x revenues for Amazon (a retailer with zero margins) up to Google with near 6x. Apple and Microsoft are in the middle at 4x revenues.

    Mature company value as a function of income is also much lower ranking from about 12 for Apple to 22 for Google. Amazon's multiple is astronomical only because it has almost zero income.

    Finally, when considering growth and income together ((When seen into the future this is the PEG ratio or Share Price/Earnings/Growth. When seen into the past, this is the PETG or Share Price/Earnings/Trailing Growth)) both emerging services and product companies are priced between 1.3 and 2.5. The outliers are Amazon due to its lack of income (PETG of 358) and Apple with its enormous income (PETG of 0.4).

    This last ratio has had a "rule of thumb" of 1.0 being the "fair value" with <1 being seen as under-valued for growth and >1 being over-valued. Alternatively it can be seen as either pessimism about sustainability or optimism, respectively.

    Clearly Unicorn Mania (or Unicornia) is a reflection of an optimism around new market disruptions in many industries where software has suddenly become ingestible.  Old-school software companies are seen as less exciting in this context. If only they could take part in these new market creating opportunities then maybe they too could benefit from this optimism.

    Now that would be crazy talk.

  7. The Battle for The Wrist

    Research · 41 comments

    The Apple Watch offers a hierarchy of surfaces onto which software can compete for attention:

    1. The Complication Layer
    2. The Notification Layer
    3. The Glances Layer
    4. The App Screen

    These surfaces are arranged in a hierarchy where the highest is the most accessible and the lowest is the least accessible. In a similar fashion we can consider the hierarchy of screens a person could reasonably be considered to be exposed to:

    1. The Watch
    2. The Phone
    3. The Tablet
    4. The TV
    5. The Personal Computer
    6. The Public/Work Computer

    Note that this hierarchy is correlated to the size and hence the portability and persistence of proximity to the user. Each of the screens has its own "surfaces" which expose software to the user with various degrees of ease. For instance the iPhone has Notifications, Control Center, Home Screen, etc. The OS X personal computer has the Desktop, Notifications, the Dashboard, the Browser etc.

    It follows then that software which is located at the top of each hierarchy on each device will have the greatest exposure to user interaction and that the device which has the nearest proximity to the user will provide the greatest value to software developers.

    This implies further that the most valuable "real estate" for software will be the Complication layer on the Watch.

    The software which receives either default placement there or which convinces the highest number of users to opt for placement there will have the greatest potential value. As suggested in my post on how the Watch will be valued, how software will be valued will be by the probability of its Settings being enabled for display on the Watch and its presence within Glances.

    The jostling for position within the constrained real estate on the wrist will be analogous to the competition for positioning on the phone. You'll note that the winners on the phone were different than the winners on the PC. My bet is that the winners on the Watch will be different than the winners on the Phone.

    And that's not a bad thing.

  8. Bigger than Hollywood

    Research · 72 comments

    Apple paid $10 billion to developers in calendar 2014. Additional statistics for the App store are:

    • $500 million spent on iOS apps in first week of January 2015
    • Billings for apps increased 50% in 2014
    • Cumulative developer revenues were $25 billion (making 2014 revenues 40% of all app sales since store opened in 2008)
    • 627,000 jobs created in the US
    • 1.4 million iOS apps catalog is sold in 155 countries

    Putting these data points together with others from previous releases results in a fairly clear picture of the iTunes/Software/Services ((soon to be renamed Services and encompass everything under the heading of iTunes software and services today including content, apps, licensing and other services and beginning Q4 2014 it will also include Apple Pay.))

    Screen Shot 2015-01-22 at 1-22-10.38.39 AM

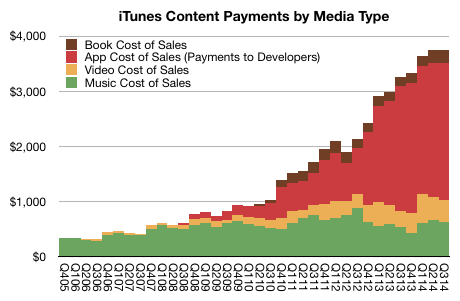
    The App ecosystem billings (what consumers actually pay) is shown in the red area above. 70% of those payments are transferred directly to developers and Apple reports the 30% remaining as part of its revenues. This view of the iTunes ecosystem shows the impact of Apps relative to the other media types. When we measure the payments to the content owners we can see that Apps also dominate: 

    Screen Shot 2015-01-22 at 1-22-10.44.16 AM

    The red area above adds up to the approximately $25 billion total paid to developers. This view of the payments to ecosystem contributors shows how apps are now a bigger digital content business than music (( Music payments due to iTunes Radio streams are not shown as part of Music cost of sales. Streaming revenues are included in the services/licensing income and payments come out that cost structure.)) and TV programs and Movie rentals and purchases put together.

    This is quite a story.

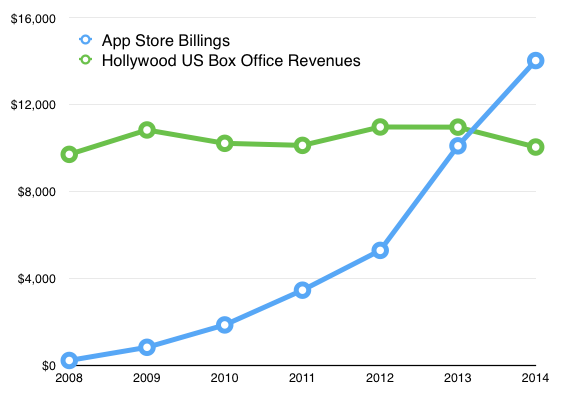
    Put another way, in 2014 iOS app developers earned more than Hollywood did from box office in the US.


    Although the totals for Domestic (US) Box Office are not the complete Hollywood revenues picture, Apple's App Store billings is not the complete App revenue picture either. The Apps economy includes Android and ads and service businesses and custom development.  Including all revenues, apps are still likely to be bigger than Hollywood.

    But there's more to the story. It's also likely that the App industry is healthier. On an individual level, some App developers earn more than Hollywood stars ((so do YouTube stars, but that's another story.)) and I would guess that the median income of app developers is higher than the median income of actors. ((A large majority of actors earn less than $1,000 a year from acting jobs)) The app economy sustains more jobs (627,000 iOS jobs in the US vs. 374,000 in Hollywood) and is easier to enter and has wider reach. As the graph below shows It's also growing far more rapidly.

    Screen Shot 2015-01-22 at 1-22-11.30.06 AM

    The curious thing is that even though the medium of apps is swamping other forms of entertainment in all measurable ways, comprehension of the phenomenon is lagging.

    Information asymmetry is a wonderful thing.

  9. Biggest news of 2014

    Research · 72 comments

    As corporate romances go, IBM and Apple's must rank among the most unexpected. As I wrote on the date they changed their Facebook status, the two companies were antagonists for the better part of twenty years and their rapprochement was met with a shrug mostly because yet more decades passed since.

    Screen Shot 2014-12-26 at 11.28.03 AM

    Nostalgia aside, this new union is profoundly important. It indicates and evidences change on a vast scale. The companies' antagonism was due to being once aimed at the same business: computing. Since the early 1980s, "computing" came to be modularized into hundreds, perhaps thousands of business models. It is no longer as simple as selling beige boxes. IBM was forced out of building computers and into services and consulting while Apple moved to make devices and the software and services which make its hardware valuable.

    The convergence of interests which was consummated into a deal this year stems from the migration of computing around what has come to be called "mobile". Apple intends to accelerate the adoption of its mobile platforms among the remaining non-adopters: enterprises–a group which, by now, qualifies as laggards. ((There was a time–when Apple was young–when enterprises were the innovators, early adopters. That role ended approximately in the year 2000)) Simultaneously IBM intends to connect data warehouses at those same enterprises to their employed users.

    Both can achieve their goals better if they join forces: Apple offers assistance and expertise while obtaining access and lubrication for orifice entry. IBM offers modularized access to databases through its own APIs and obtains credible client experiences. The combination increases adoption of mobile (i.e. intuitive) solutions and an increase in productivity, benefiting the buyer.

    The recent apps release showed just how transformative this relationship could be. We were witnesses to apps which appeared to be designed for users[!] They were not designed for committees that prepare checklists of requirements.

    We must applaud IBM for having the courage to resist the featuritis which plagues enterprise software design. This resistance requires saying No to those who specify and are thus authorized to purchase software and hardware. IBM has had to essentially say no to those who buy and yes to those who are paid to use. The quality of the experience is evident at first sight. The number of user actions, the number of screens to wade through have been ruthlessly culled. These are concepts and ideas which now permeate app design best practices. Yet they are practices which still elude the spec-driven enterprise software wastelands.

    Simultaneously we must applaud Apple for accepting that there are throngs of unwashed masses laboring in cubicles which deserve to be served. They may be employed by laggards but they are people too. Apple management has made clear that they are being more inclusive and open minded. Extending that open hand to the downtrodden salaried masses must surely bring a tear to one's eye.

    Being unexpected and yet explanatory of the state of technology today, the partnership between IBM and Apple is, in my opinion, the most significant technology news of 2014.

    As a romance, it is at least as newsworthy as the divorce of Wintel was in 2012.

  10. How big is iCloud?

    Research · 24 comments

    Apple has declared that what used to be "Other Music Related Products and Services" ((Includes revenue from sales from the iTunes Store, App Store and iBookstore in addition to sales of iPod services and Apple-branded and third-party iPod accessories.)) plus "Software, Service and Other Sales" ((Includes revenue from sales of Apple-branded and third-party Mac software, and services.)) which was formerly known as "iTunes/Software/Services" ((Includes revenue from sales on the iTunes Store, the App Store, the Mac App Store, and the iBooks Store, and revenue from sales of AppleCare, licensing and other services)) is about to become "Services".

    "We'll also have a category that we refer to as services and this will encompass everything we report under the heading of iTunes software and services today including content, apps, licensing and other services and beginning this month it will also include Apple Pay."

    "Services" will therefore encompass a massive amount of revenue. The reported revenues for the fiscal 2014 were $18 billion. Including all billings, the turnover in sales is over $28 billion. For next year, assuming that Apple Pay, which is just getting started, is unlikely to contribute greatly to revenues, Services turnover will top over $35 billion. That figure would make Apple Services alone one of the top 90 companies in the Fortune 500.

    Screen Shot 2014-11-14 at 5.11.47 PM

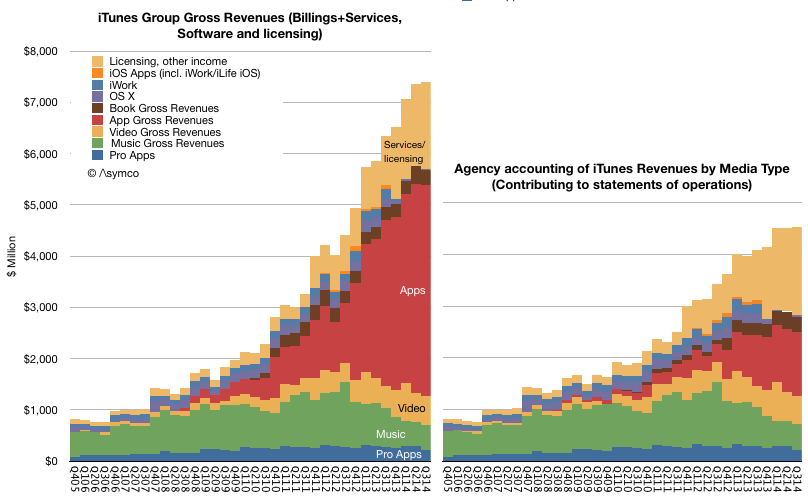
    Regardless, as a component of overall sales, the group formerly known as iTunes/Software/Services (shown in red above) was a modest 7% of total sales in the last quarter. Using all available information regarding downloads, payouts and reported financials, an estimate can be obtained on how this 7% is itself divisible into nine sub-segments:

    Screen Shot 2014-11-14 at 5.15.08 PM
    • Pro Apps
    • Music
    • Video
    • Apps
    • Books
    • OS X
    • iWork
    • iOS Apps
    • Licensing and other income

    These are shown above as either contributing to statement of operations (i.e. as reported, on right) or using billings (or the actual "cash register takings", on left). ((The primary distinction is in Apps billings where the 70% paid to developers is not shown as revenue.))

    What would be ideal in understanding this Services segment would be to break the "Licensing and other income" into its component parts. Namely:

    • Licensing revenues including Google's payments for traffic acquisition (TAC)
    • AppleCare
    • iTunes Match
    • iTunes Radio
    • iAd
    • iCloud
    • (and soon, Apple Pay)

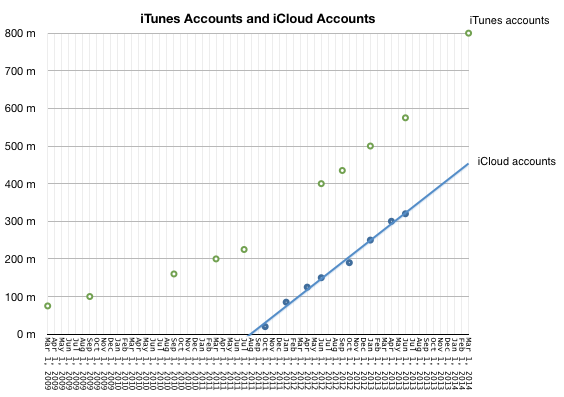
    In particular, it would be very interesting to know exactly how much revenue could be coming from iCloud. We have not heard from Apple on iCloud user numbers since mid-2013 and this was the data at the time:

    Screen Shot 2014-11-14 at 5.30.27 PM

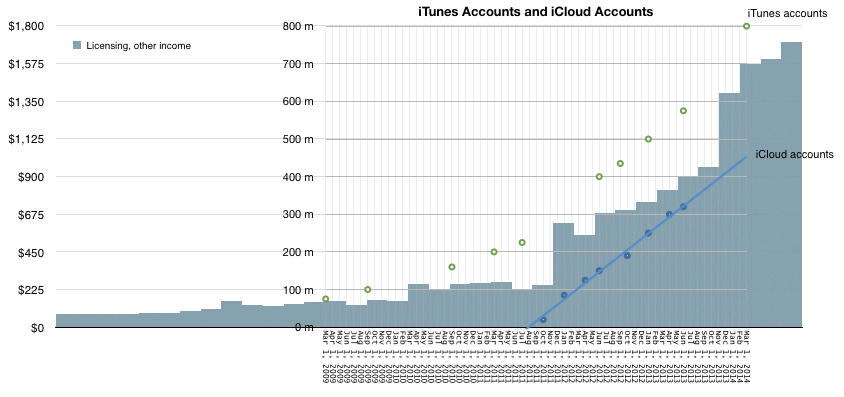
    Couple that to "Licensing and Other Income" as deduced from Services accounting yields the following picture:

    Screen Shot 2014-11-14 at 5.38.30 PM

    It would appear that iCloud accounts are growing in proportion to "Licensing and Other Income". Note that at the point that iCloud accounts were zero, revenues from Licensing were about $225 million/quarter and growing slowly. The real growth kicked in when iCloud accounts started ramping up. Since revenues from iCloud has to be in the "other income" and since no then it is, I believe, reasonable to assume that the iCloud user base growth is a principal driver of growth ((Of course, AppleCare could also be a driver but AppleCare should follow overall device sales patterns and this is not clearly evident in the Licensing/Other curve))

    Also, bursts in the Licensing and other income line occurred after several iCloud-specific marketing events:

    Mobile Me migration started in October 2011 and on September 30, 2013 the complimentary iCloud storage plans expired and were automatically adjusted to the free 5 GB plan (with an offer to upgrade to a paid plan). Correspondingly, Q1 2012 and Q1 2014 showed the largest increases in Licensing and Other Income.

    This is a multiplication of many assumptions, but there is some intuitive logic. The only place iCloud can be found seems to be growing in proportion to iCloud users and plan marketing.

    So how much does iCloud contribute to Apple's sales? My guess would be about $1 billion per quarter. That would be spread over 500 million iCloud accounts and therefore an average revenue per account of $2/user/quarter or $8/user/yr.

    The lowest non-free iCloud pricing is about $12/yr (5GB plan is free). This would imply that two thirds of iCloud users are paying users (and one third are opting for the 5G plan).

    I realize that this attach rate to a paid service is astronomical. Anything over 10% is unheard of. I would say the error in my estimates could be 20% but that still leaves a huge gap to what seems reasonable.

    [Put another way, if the attach rate were only 10% then iCloud revenues would have to be in the $600 million range and thus only about 10% of what Licensing and Other income seems to be. This would force the question of what could be generating the remaining $5.6 billion/yr.]

  11. The new iPad. Is it better?

    Research · 62 comments

    The problem with getting better is that if you're more than good enough you're actually getting worse. Improving beyond the point where your improvements can be absorbed is not only wasteful but it's also dangerous. It opens the door to competitors who compete asymmetrically.

    This is the perverse and pervasive threat hanging over all system vendors. The temptation to "get better" is not coming from incentives and human nature. It's  always there as Moore's Law offers an exponential increase in power. People don't naturally have exponentially increasing needs. For them to absorb this new power, it has to be couched in new uses.

    What has permitted the absorption of improvements in semiconductor performance (and production) have been other aspects of the system: the software, communications and services innovations have been positioned on more demanding jobs to be done which, once hired for those jobs, saturate the available processing and storage.

    This is most easily evident in how digital photography has advanced. The constraints on sensors meant that quality was initially poor and as cameras were unconnected, they were relatively under-utilized. But once software and communications were added (by inclusion in smartphones) digital photo creation exploded. This, in turn, led to more storage needs both on the device and the servers. In a virtuous cycle, more processing power meant video was possible, then high definition video, then slow motion high definition video. The previous storage limits on mobile devices were quickly overwhelmed. Megabytes of storage became gigabytes and then hundreds of gigabytes. Video editing meant processing power was suddenly in demand again. Cores multiplied.

    Third party media (music and videos) storage and playback used to be the main job that storage was hired to do ((Which was far more demanding than office-like documents)) but as cameras got better, user-generated content suddenly bellied up to the bar.

    That is now the story for phones, which are gobbling up all the storage and bandwidth we can throw at them. But what about the larger form factors? Are iPads (and laptops) growing in their demands? Paradoxically, it would seem that the smaller devices are hungrier than their larger cousins.

    The answer lies with the jobs to be done. If highly portable devices are more usable, they will be used more. Large devices are left behind, literally, because their jobs are not as pervasive in place and time. For a large screen like the iPad to increase its attractiveness, it has to be the stage for a set of jobs that only it can perform.

    The new iPad has the horsepower. It has more portability (thinner, lighter) and it has the touch ID convenience. It even has a better camera. But for it to succeed it needs to be hired for a set of jobs as expansive in usage as the user-generated photo/video jobs that the iPhone has been called to do.

    I hire my iPad for one such job: to persuade audiences small and large. I use it across a dining table and across an auditorium to appeal with a visual language. I use Perspective to create stories that have to be seen to be believed and once seen, create belief.

    The tool is demanding however. As the stories are fed by data and the visualizations are rendered algorithmically and not as stored images it is hungry for processing power. I also need it to record performances which taxes storage. I need to transmit those performances both in real-time and as recordings, tasking the WiFi and cellular bandwidth. I need as much screen as I can get to be able to interact with the elements on screen, of which there may be hundreds. I need to export video versions of performances and thus I need a video studio with all its extravagance. I need it to run for all-day workshops connected to a projector, sometimes through AirPlay, under stage lights, which pushes the battery.

    Consider my last padcast. It was recorded in one take lasting 18 minutes. I then exported the results to a video that was uploaded to Vimeo and viewed by thousands. However it took over one hour to render it and due to that constraint I did not have the luxury of editing it. I could not easily add, subtract or annotate the video production. This was done on an iPad Air and I was happy to get it done at all.

    But if I had an iPad Air 2, not only would production time be shrunk ((To about half the time)) the things I could attempt to do with a presentation suddenly expand. It's not just about more efficiency but an expansion of scope. More power means more work I choose to do.

    So is the new iPad better? As far as the jobs I hire it do do, the new iPad is better. It is in fact not good enough. Which is the best thing to be.