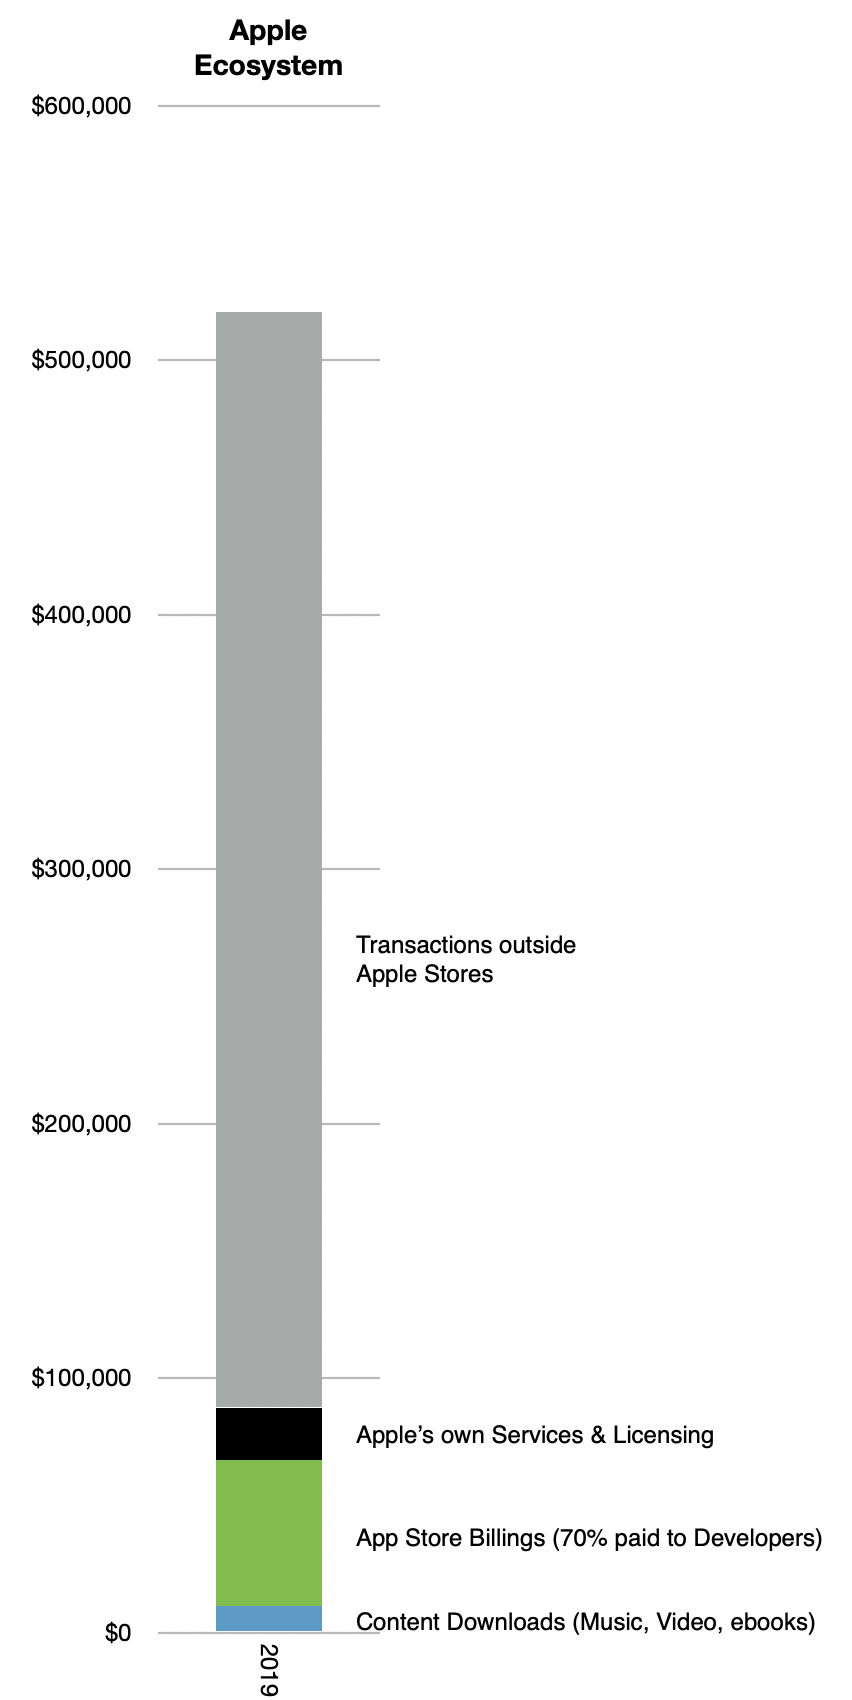
According to one estimate, in 2019 Apple's ecosystem was approximately $519 billion. This includes both transactions that Apple handles, such as paid apps, as well as purchases and other economic activity that happened through apps in which Apple is not involved in the transaction, such as Uber, Bird or Bond rides.
A fraction ($48 billion or 9.3%) of this total is reported as part of Apple's financial statements as "Services Revenues". The rest ($471 billion) is reported on other financial statements, typically businesses which use apps to book sales. These are app revenues are not even accounted as "Payments to Developers" as they are not paid directly to any developer.
The attention to Apple's terms and conditions with developers only apply to transactions in the area shown in green below. The grey area is all outside the App Stores and attracts no attention.
The attention paid to Apple's new services including the "+" brands of TV, News, Arcade, Music and now Fitness and the new bundling thereof refers to the area shown in black above.
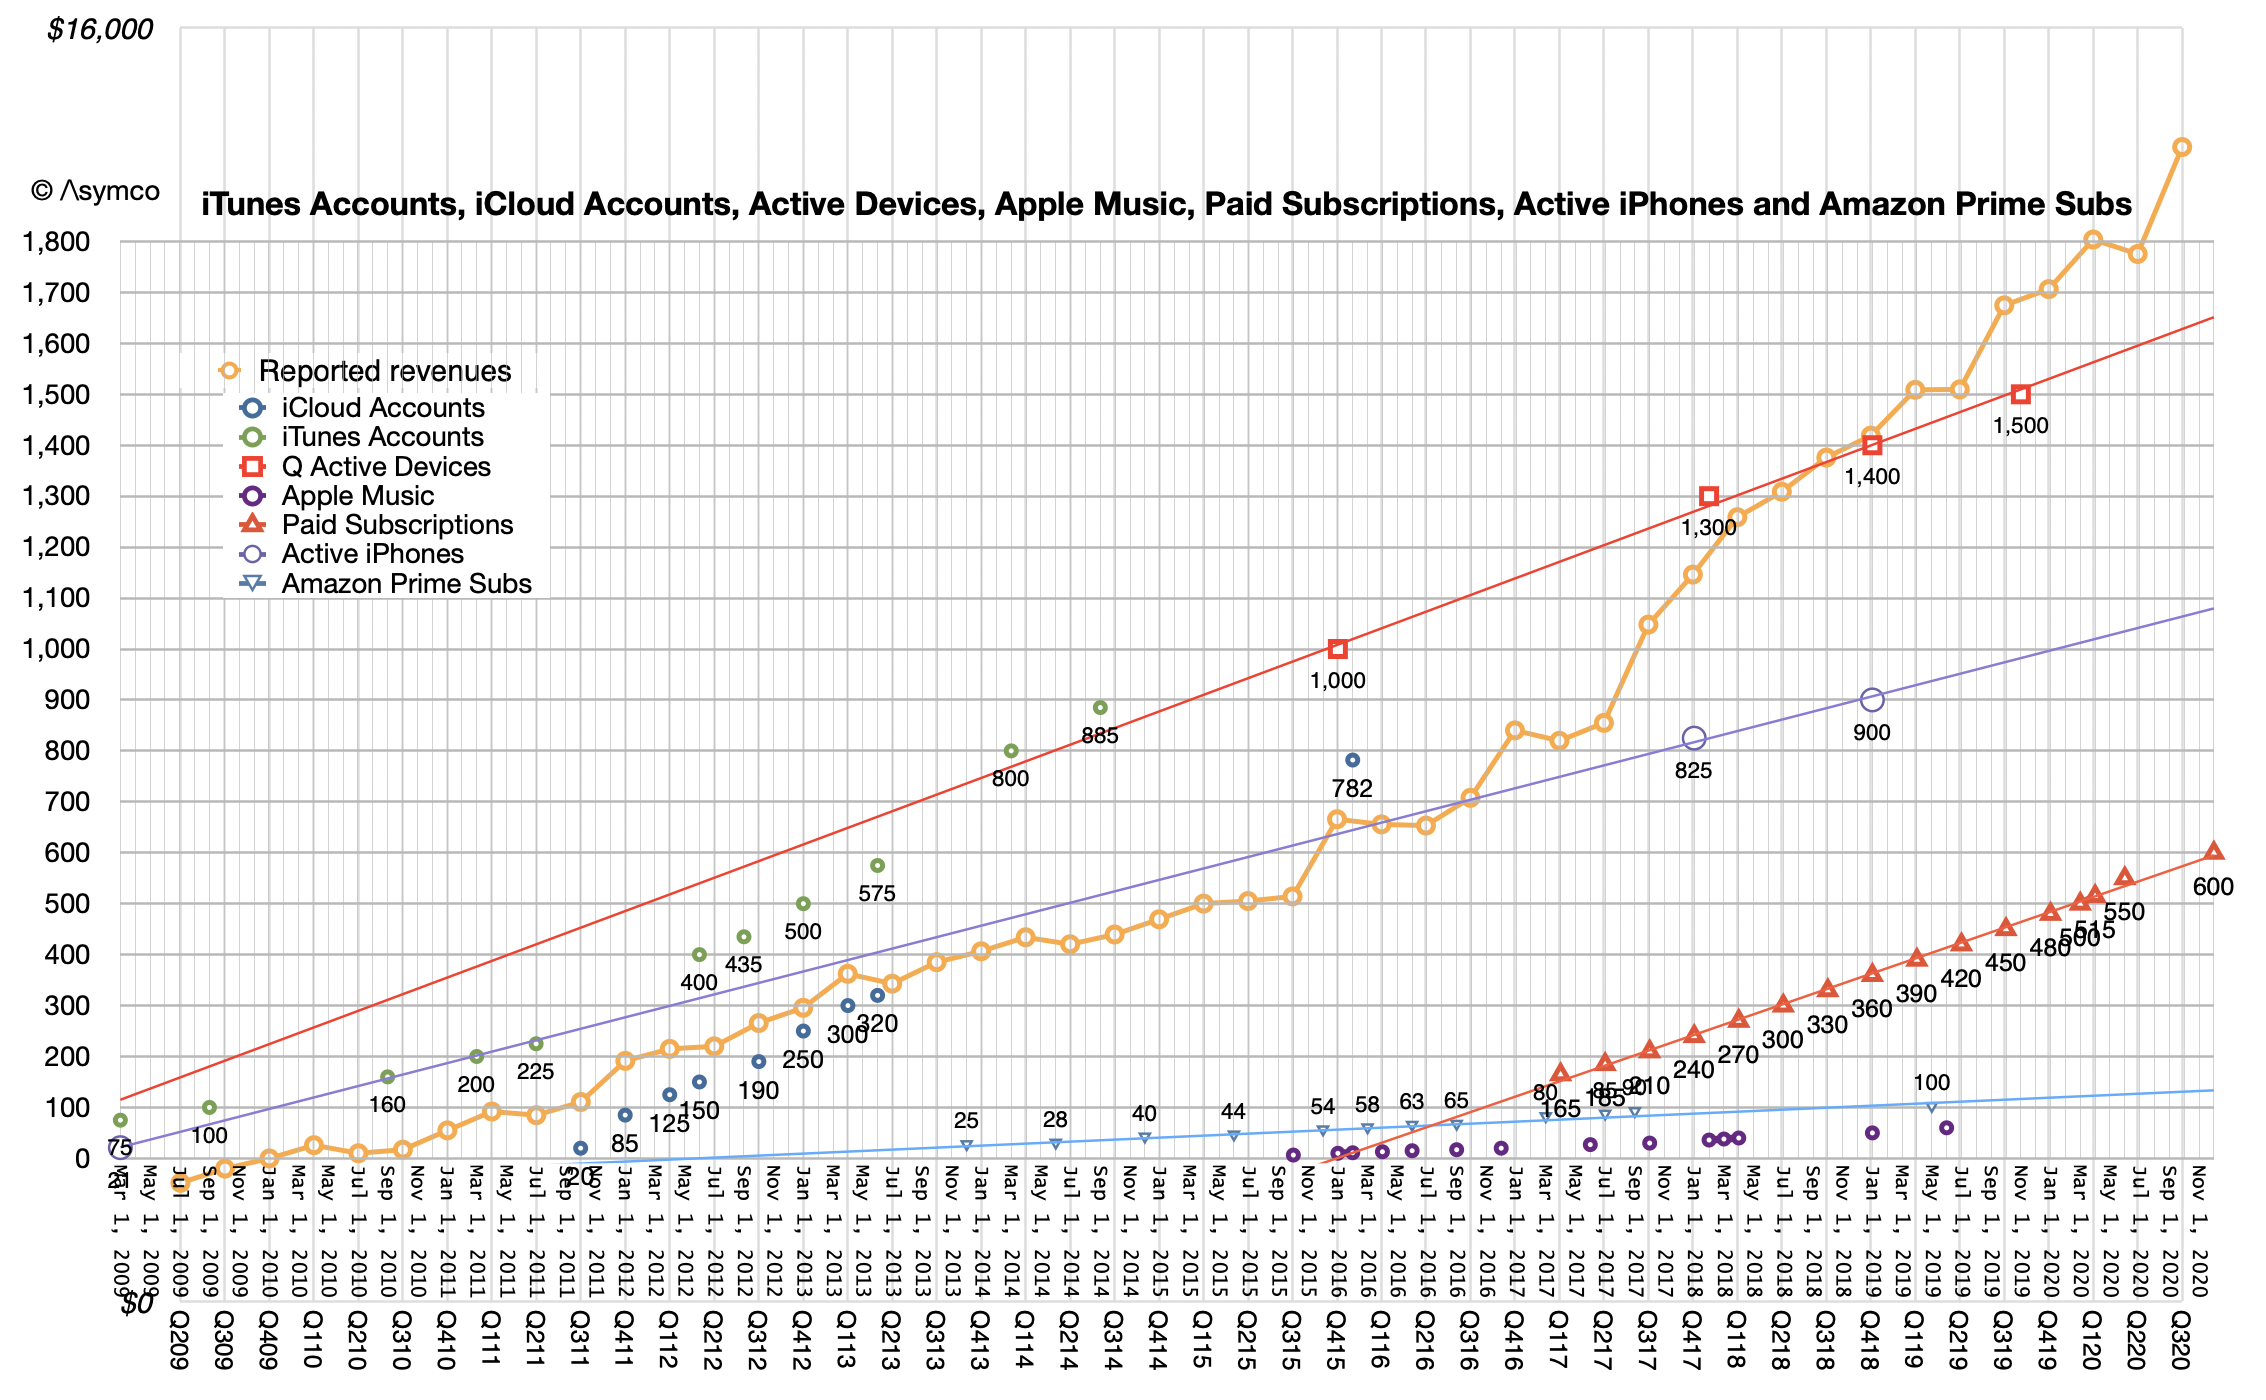
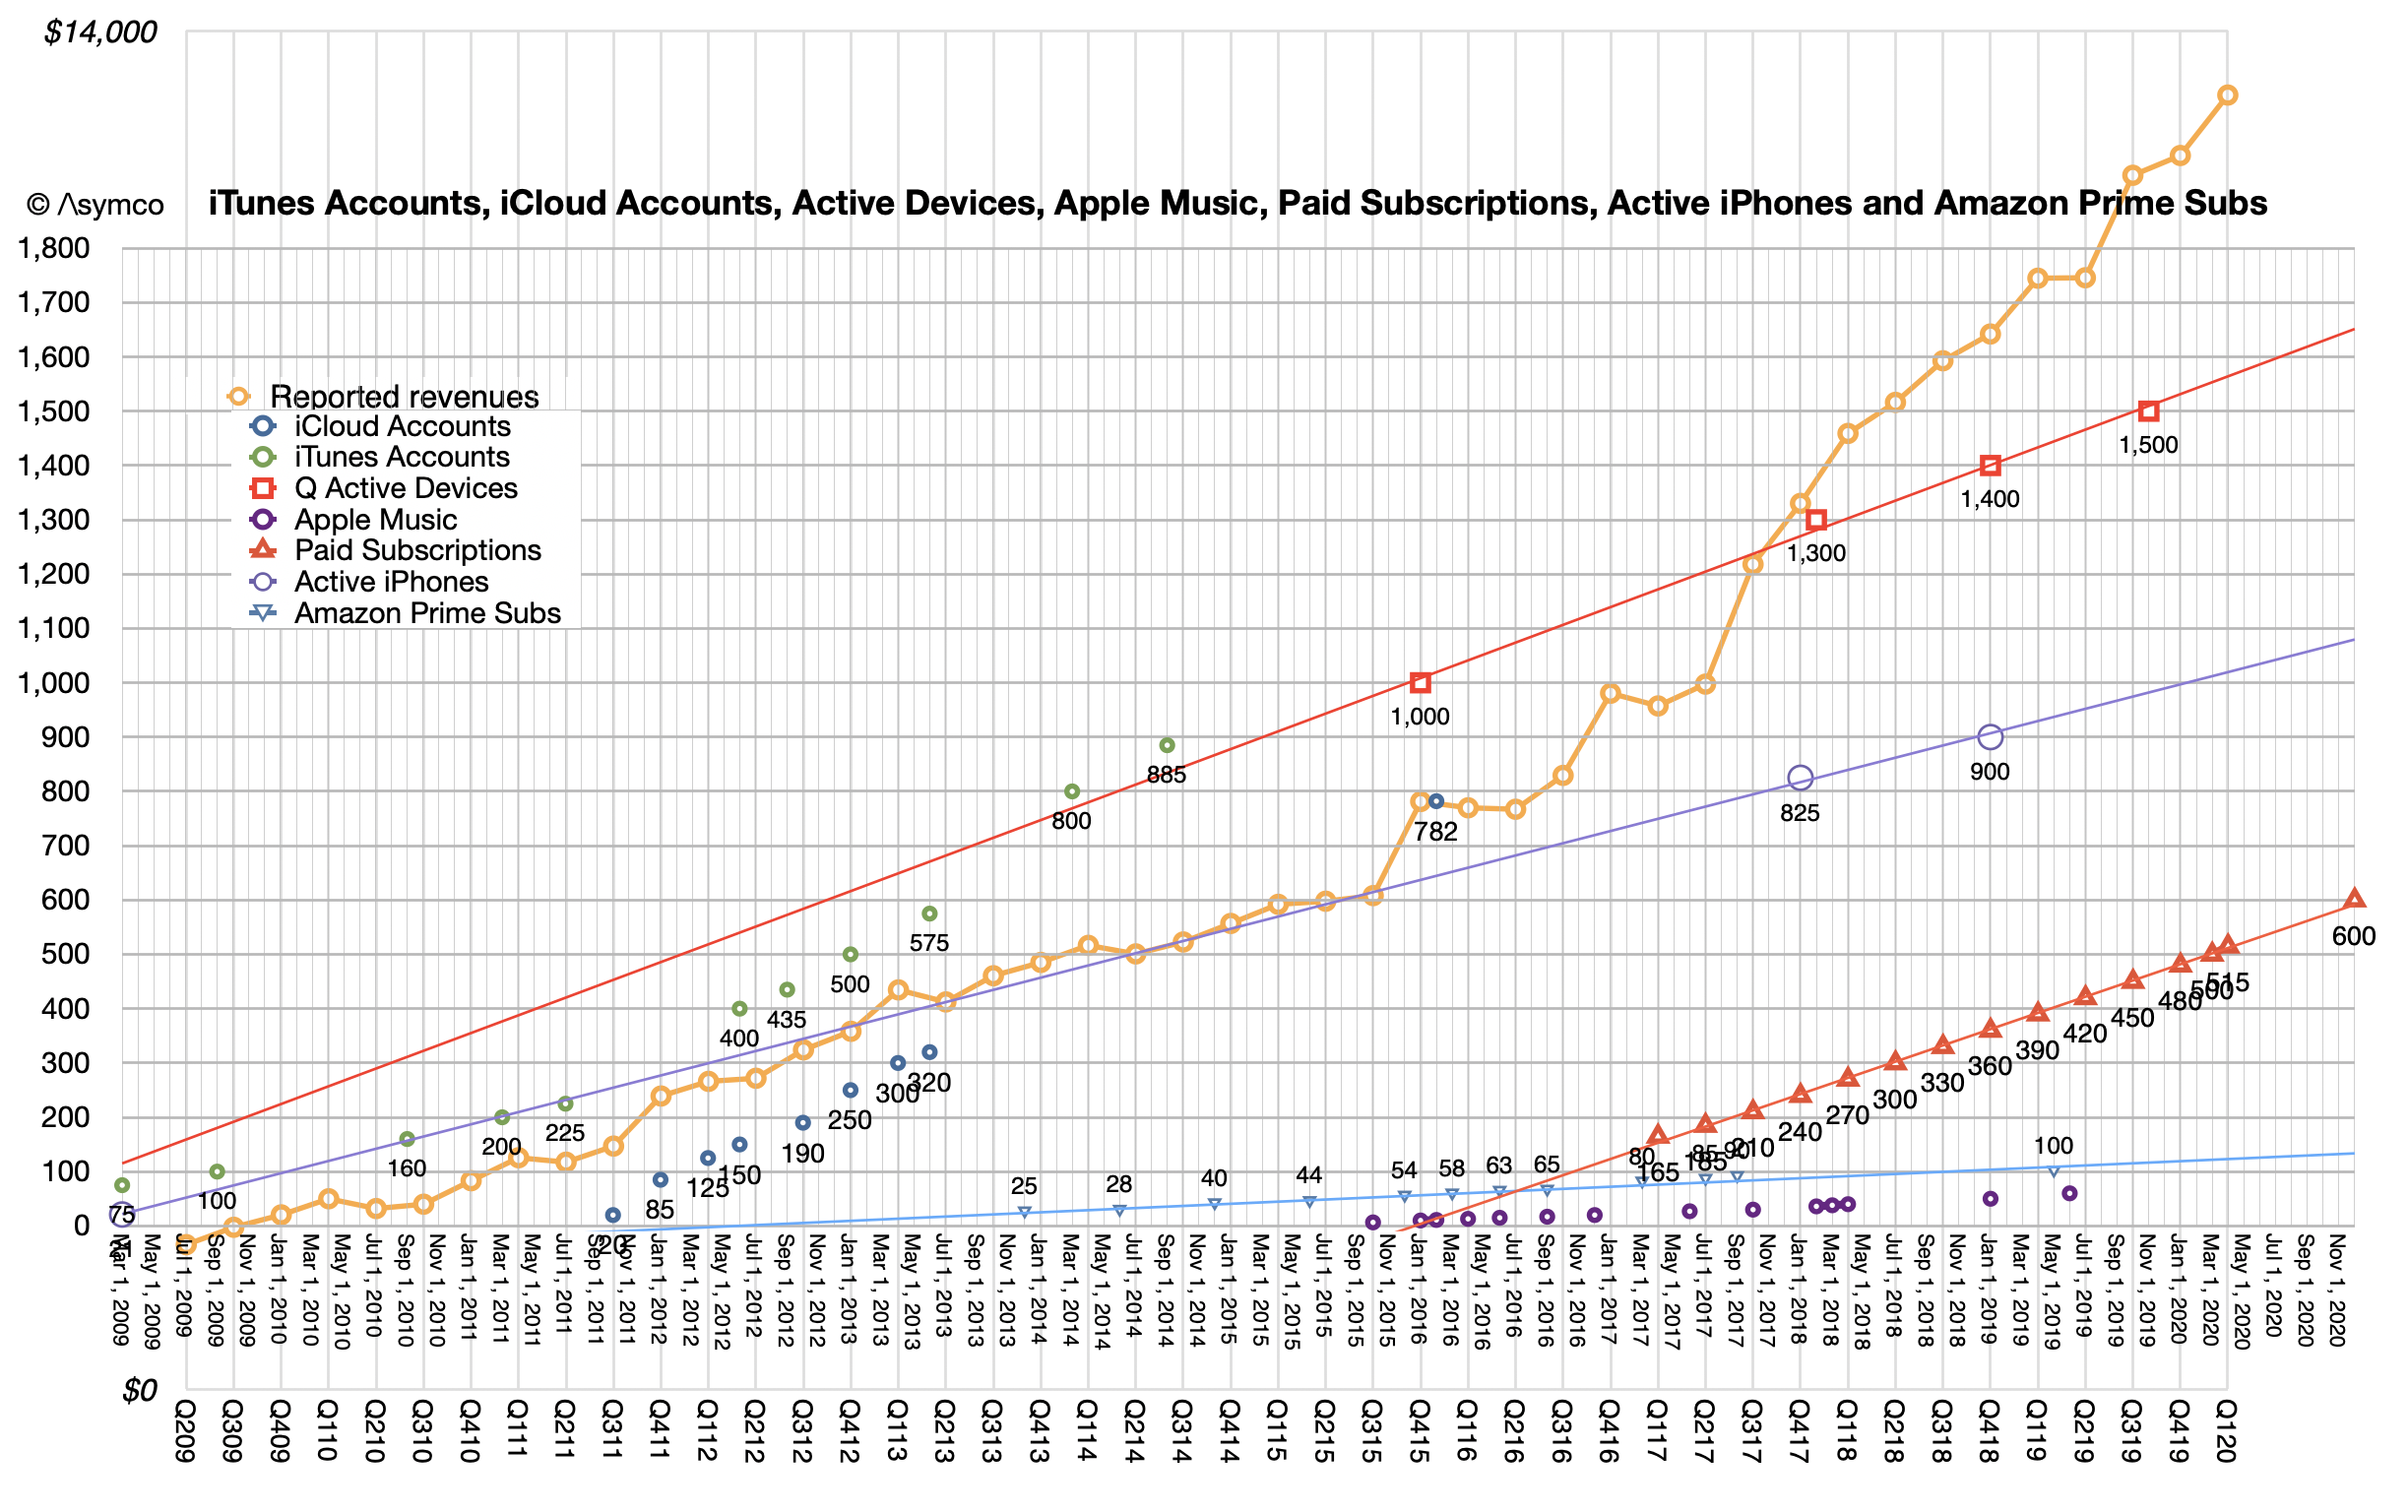
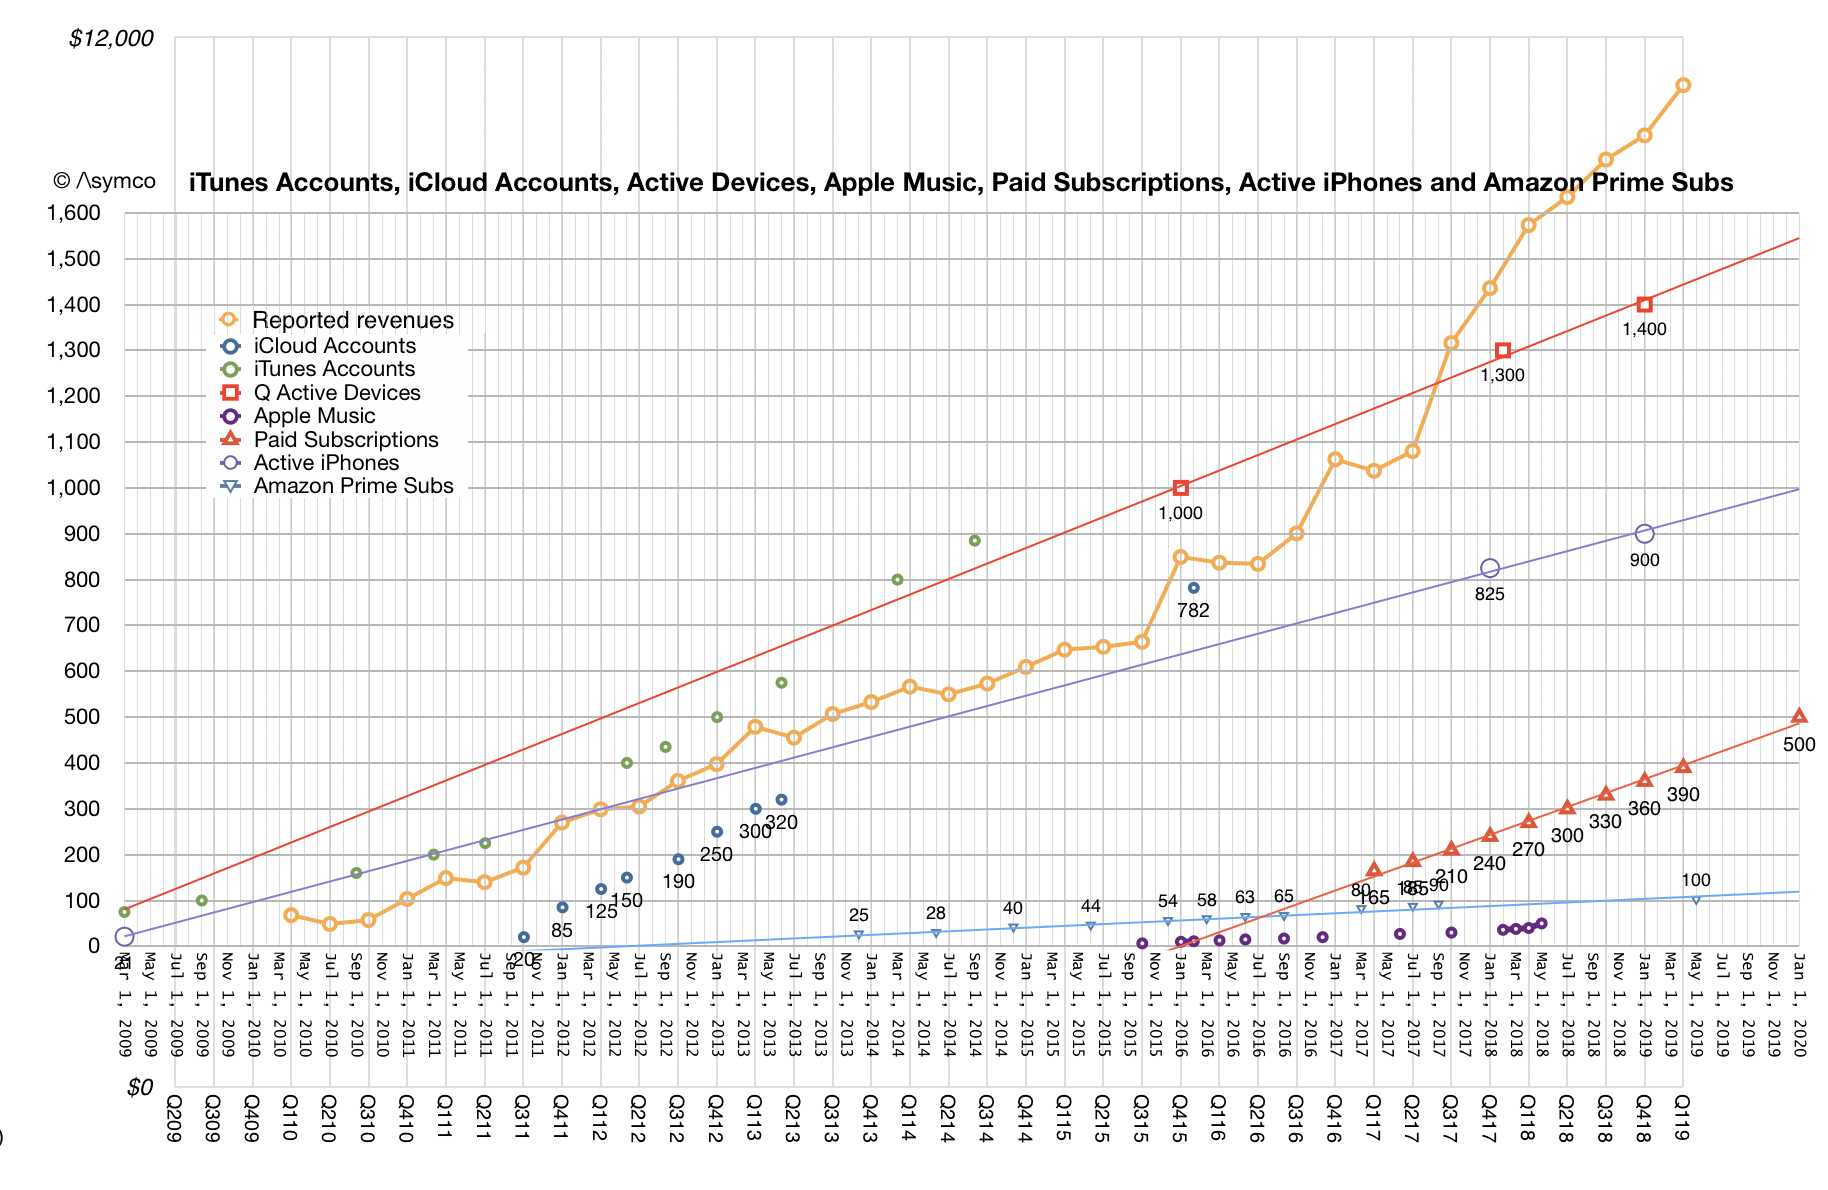
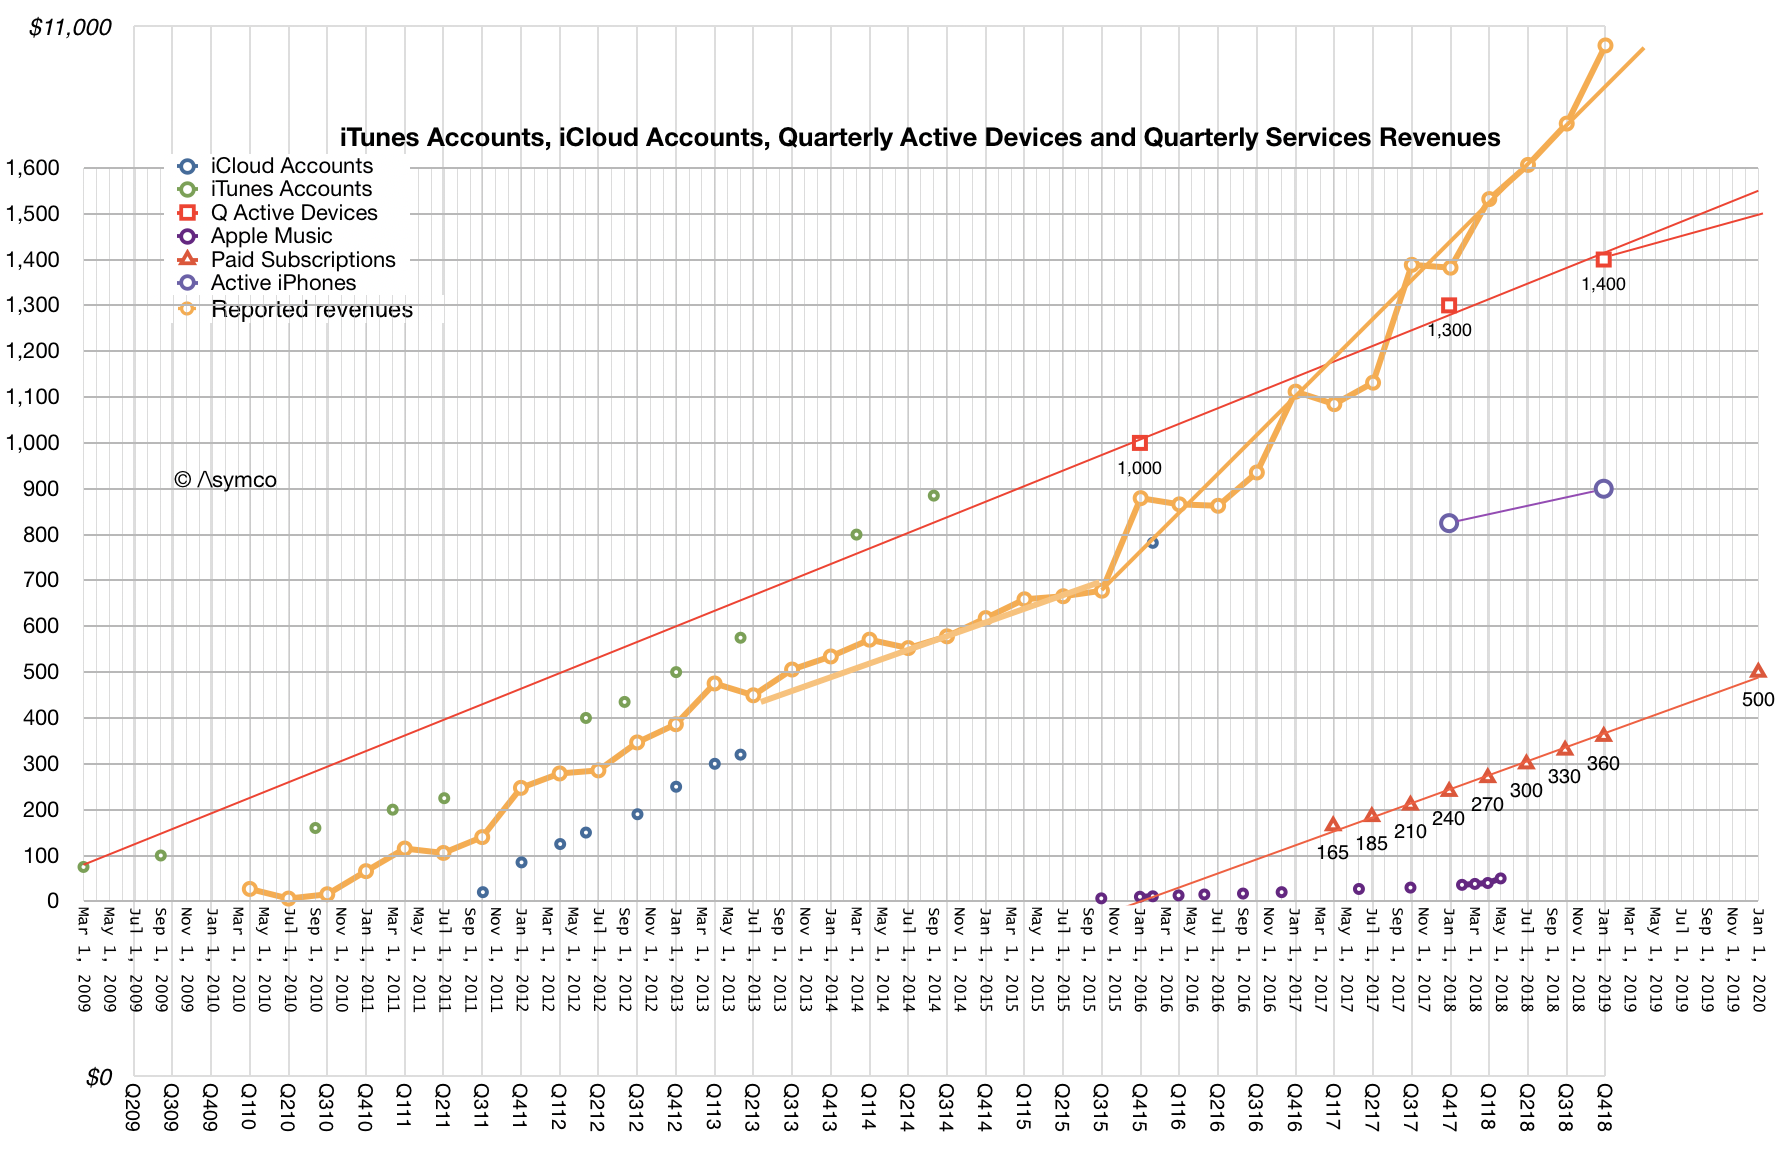
The Green and Black areas are also captured through subscriptions whose quantity is charted with triangles below. Note that the latest quarter saw an acceleration in the accumulation of subscriptions, putting the 600 million target set for end of this year closer than expected. Note also the change in slope of the yellow line as the triangles were added.
These two charts are an attempt to illustrate what is a huge set of activities. Apple's product lines may be something we can grasp in terms of objects for sale and price points, and feature sets, etc. But the Ecosystem that sits on top of these devices is not comprehensible.
There are literally millions of apps, services, and ways of delivering and capturing value. There are millions of people employed in what amounts to an economy bigger than the 25th largest in the world (Belgium (1)). It's half a trillion dollars of activity.
Given the growth of the underlying Services segment (~15%), it's probably going to double in 5 years to $1 trillion. Apple will certainly benefit as even if only 9% of that is booked as direct revenues, the rest will create resilience in the user base.
The power of an ecosystem isn't what Apple is able to skim from it but rather that millions of other people will want to encourage and preserve its existence as their livelihoods, hopes and aspirations will depend on it. This goes beyond loyalty of end users (which is extraordinary) as it's a loyalty of those who co-invest in it. All participants in an ecosystem become partners in its preservation.
Apple is not the only technological ecosystem out there, but I'm willing to bet that it's the most vibrant in terms of creative effort, economic value and growth.
This ecosystem is a thunderous declaration of value which is largely unheard by investors or analysts. While looking at the potential for growing the direct revenue with "+" Apple services, the indirect, qualitative added value of services which never hit Apple's income statement are ignored. Like the ignored value of a satisfied customer, how much is the value of an economic co-dependency?
Although it's inappropriate to compare a company's market capitalization (which is a measure of asset value) with GDP (which is a measure of economic activity) an "economy" like the value of all transactions in an ecosystem is comparable with GDP.
In March 2016 Ben Bajarin and I put on an event called SUBSCRIBE where we asked, among other things,
How will the online services business models evolve?
How will hardware affect software and services and vice versa?
How will users, usage, and capital connect?
Now is a good time to look back on that event.
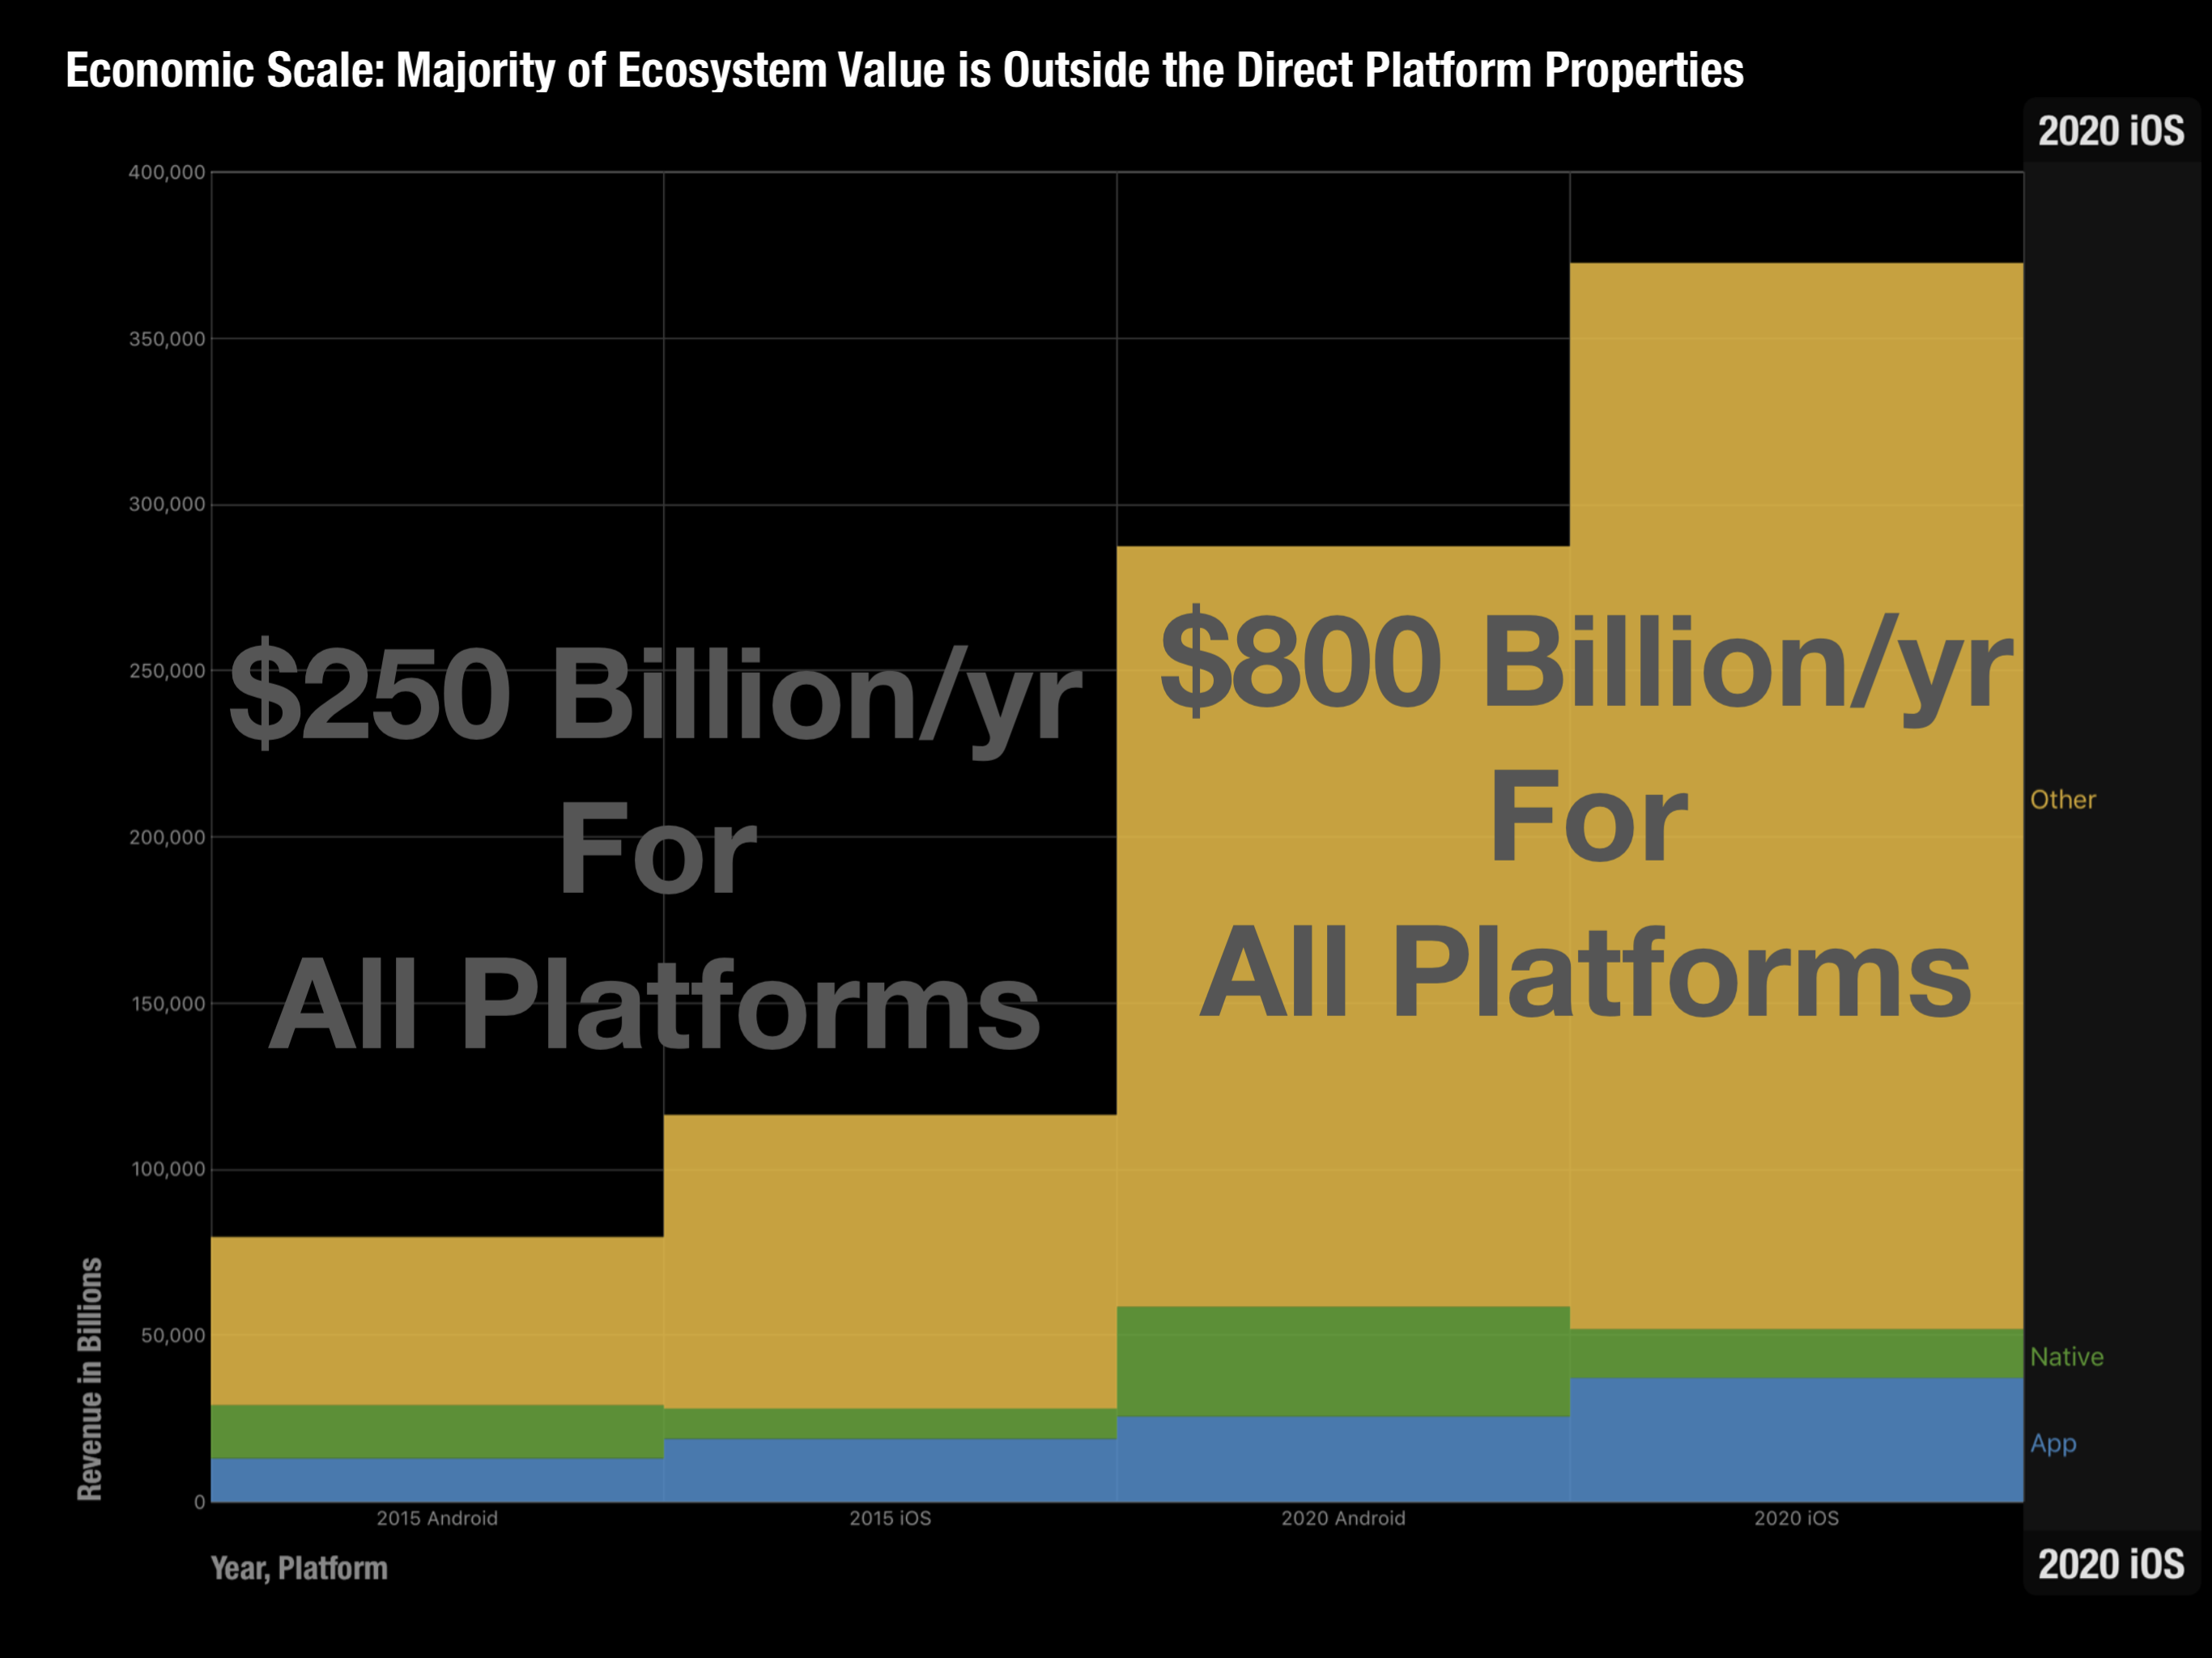
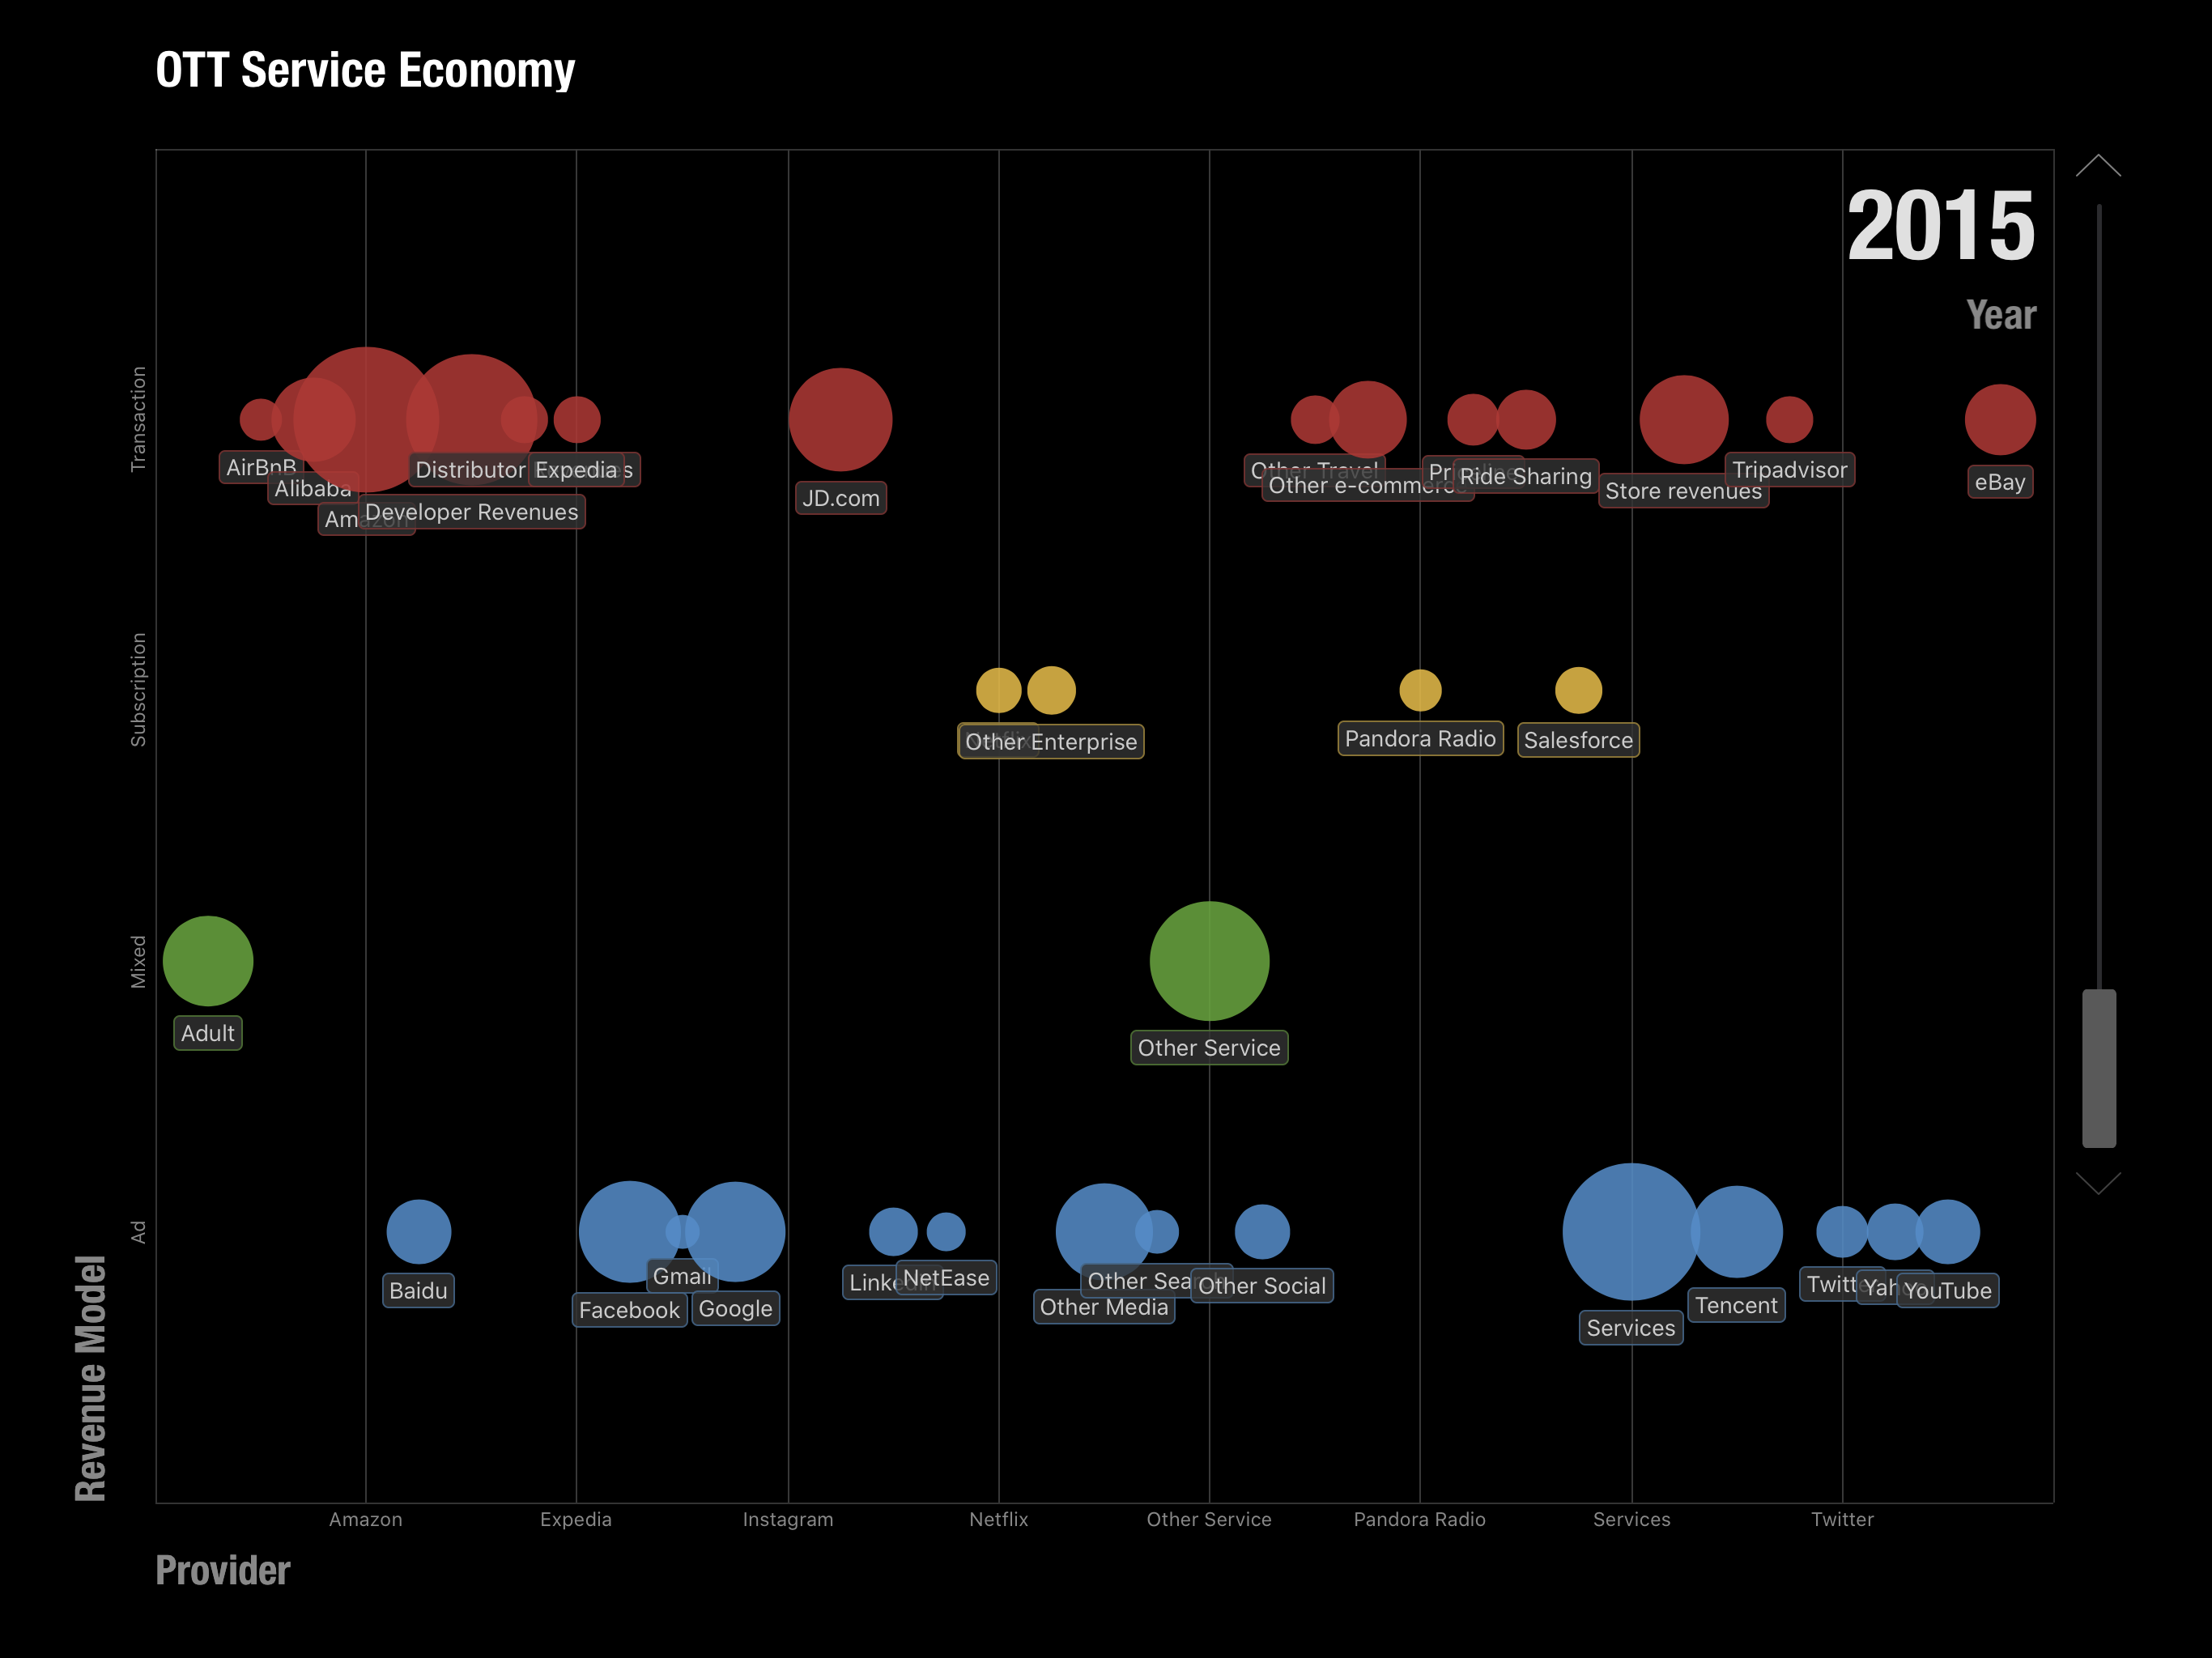
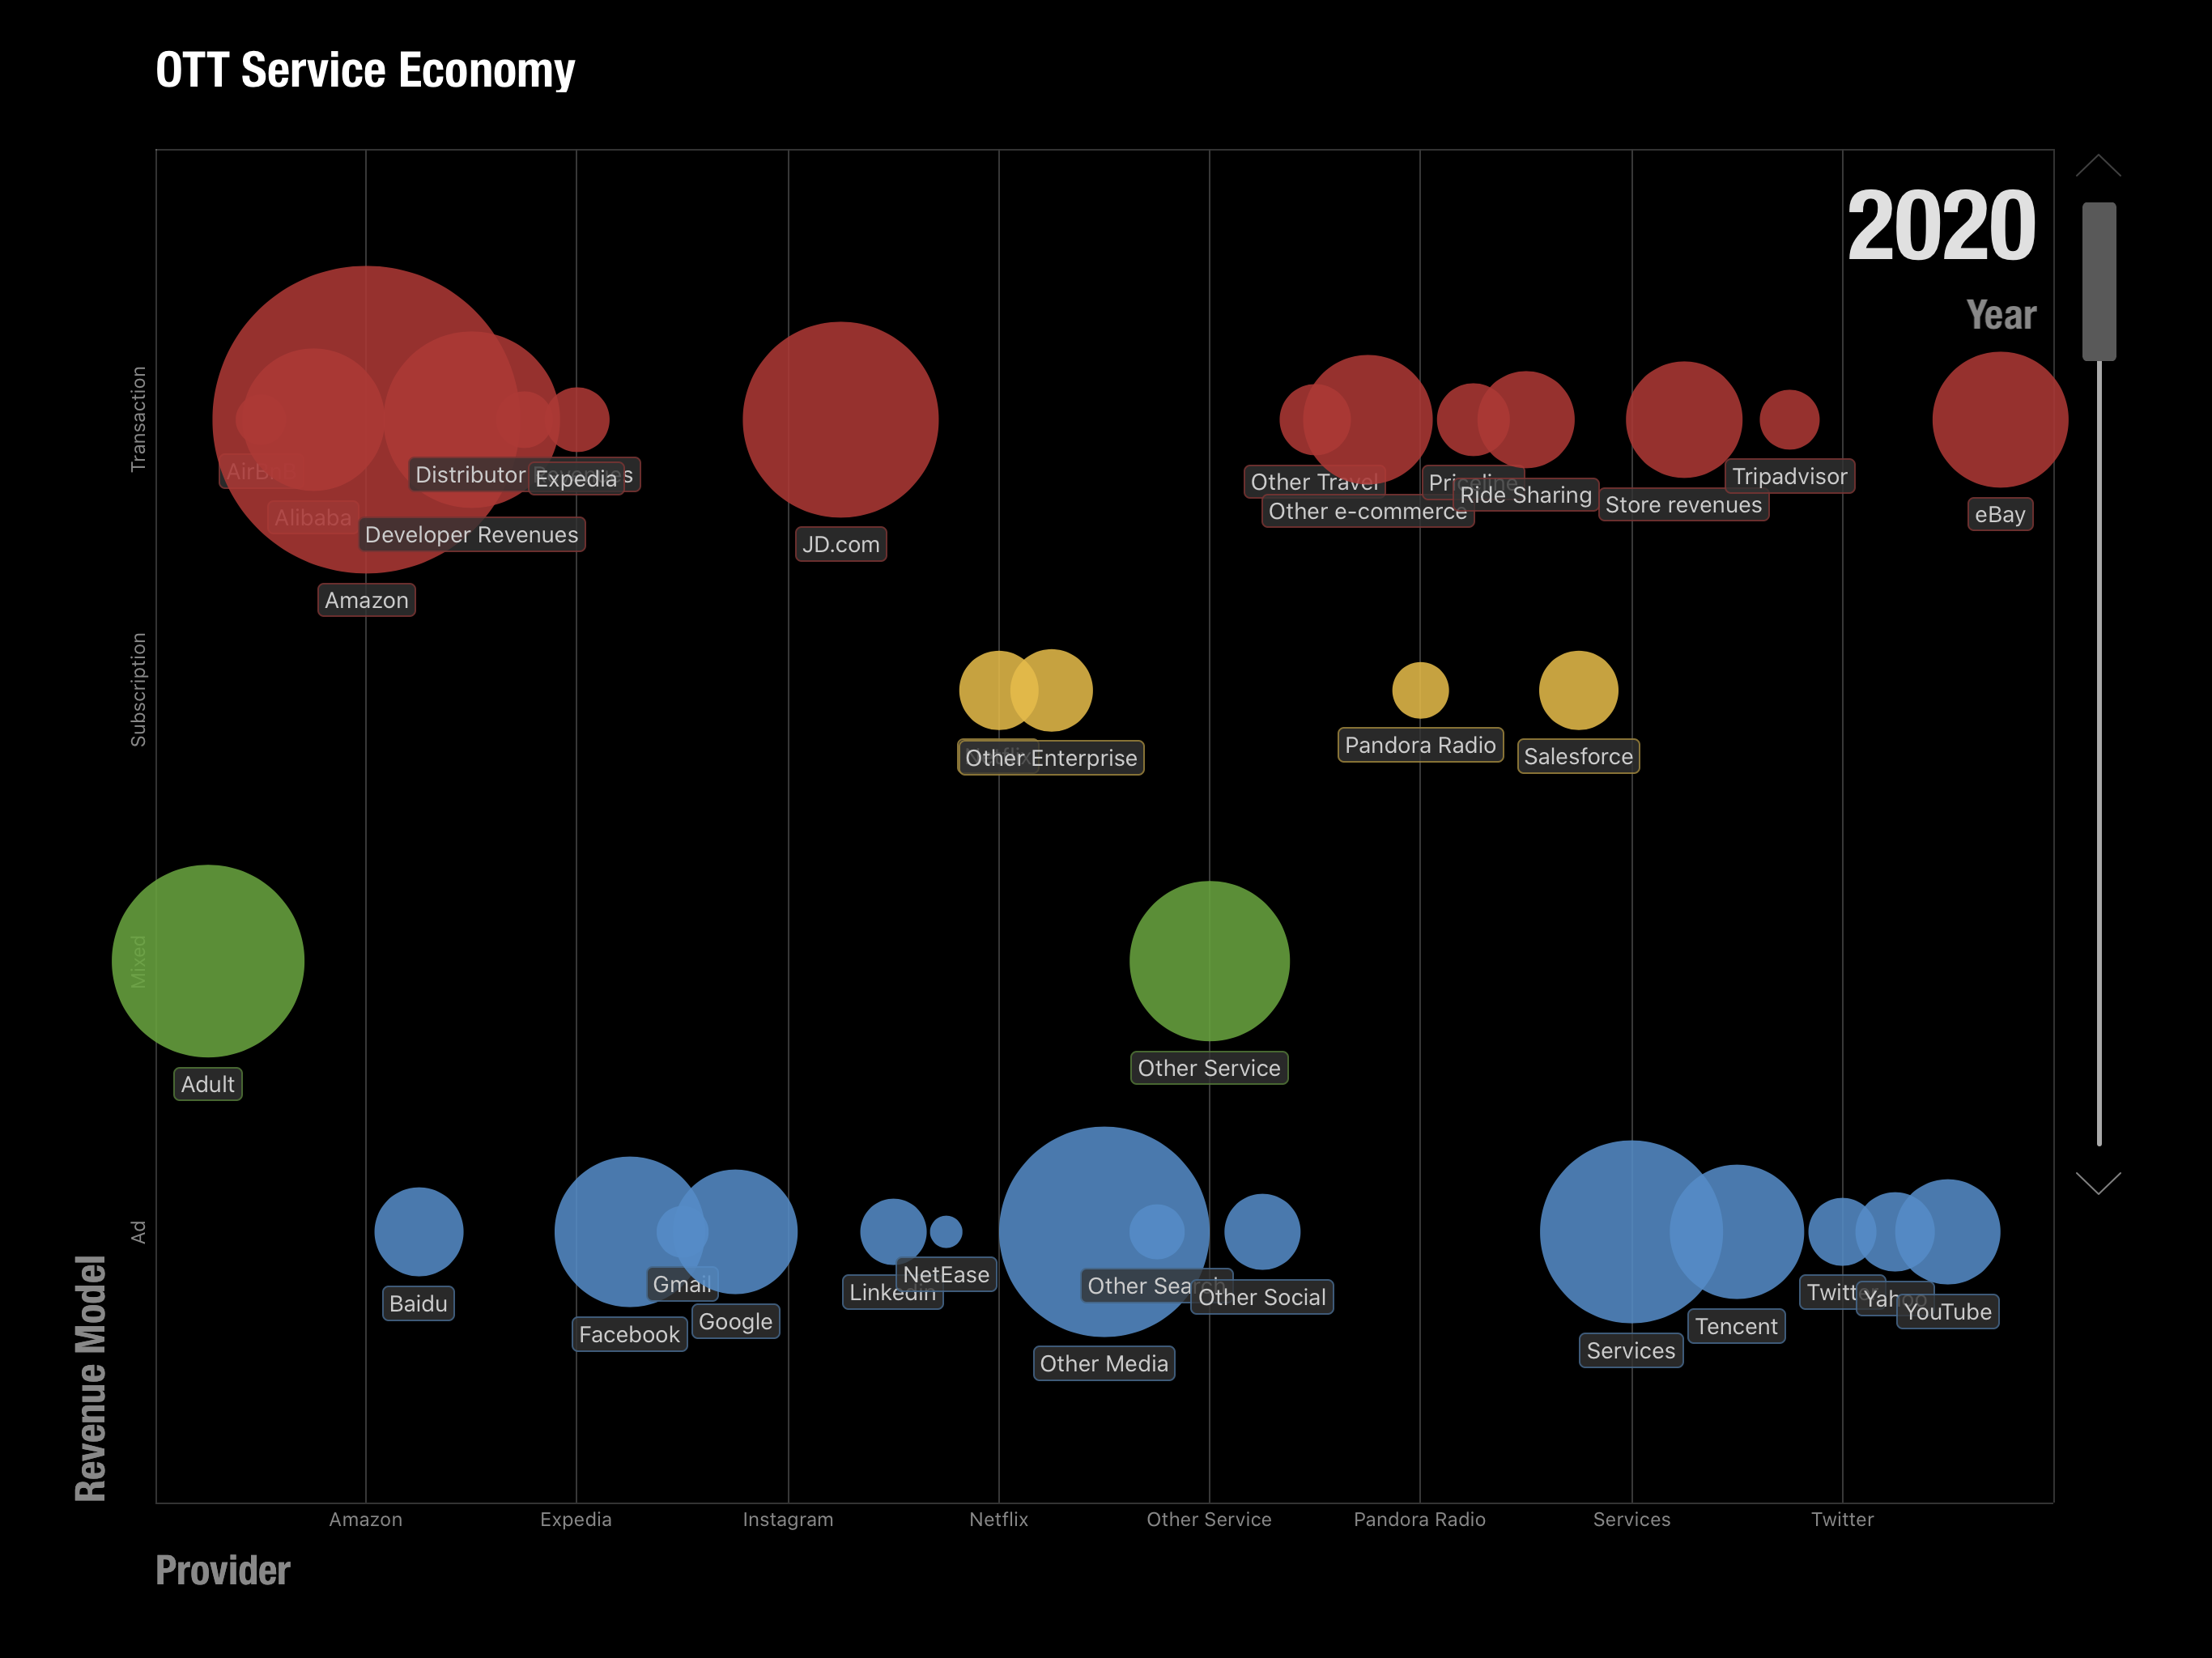
For the keynote I prepared a model which predicted the mobile ecosystems for iOS, Android and Chinese Android over the next 5 years (to 2020). The methodology involved taking a measurement of the revenues of the top internet service companies, building up the categories these companies occupied, estimating how much of those revenues are through mobile distribution and then splitting the result among the three platforms of iOS and the two Androids.
Adding to that the "native" app and content revenues for each platform would yield the Ecosystem total value. Applying a growth rate would offer some visibility into the future.
The following images are screen captures of the Perspective presentation.
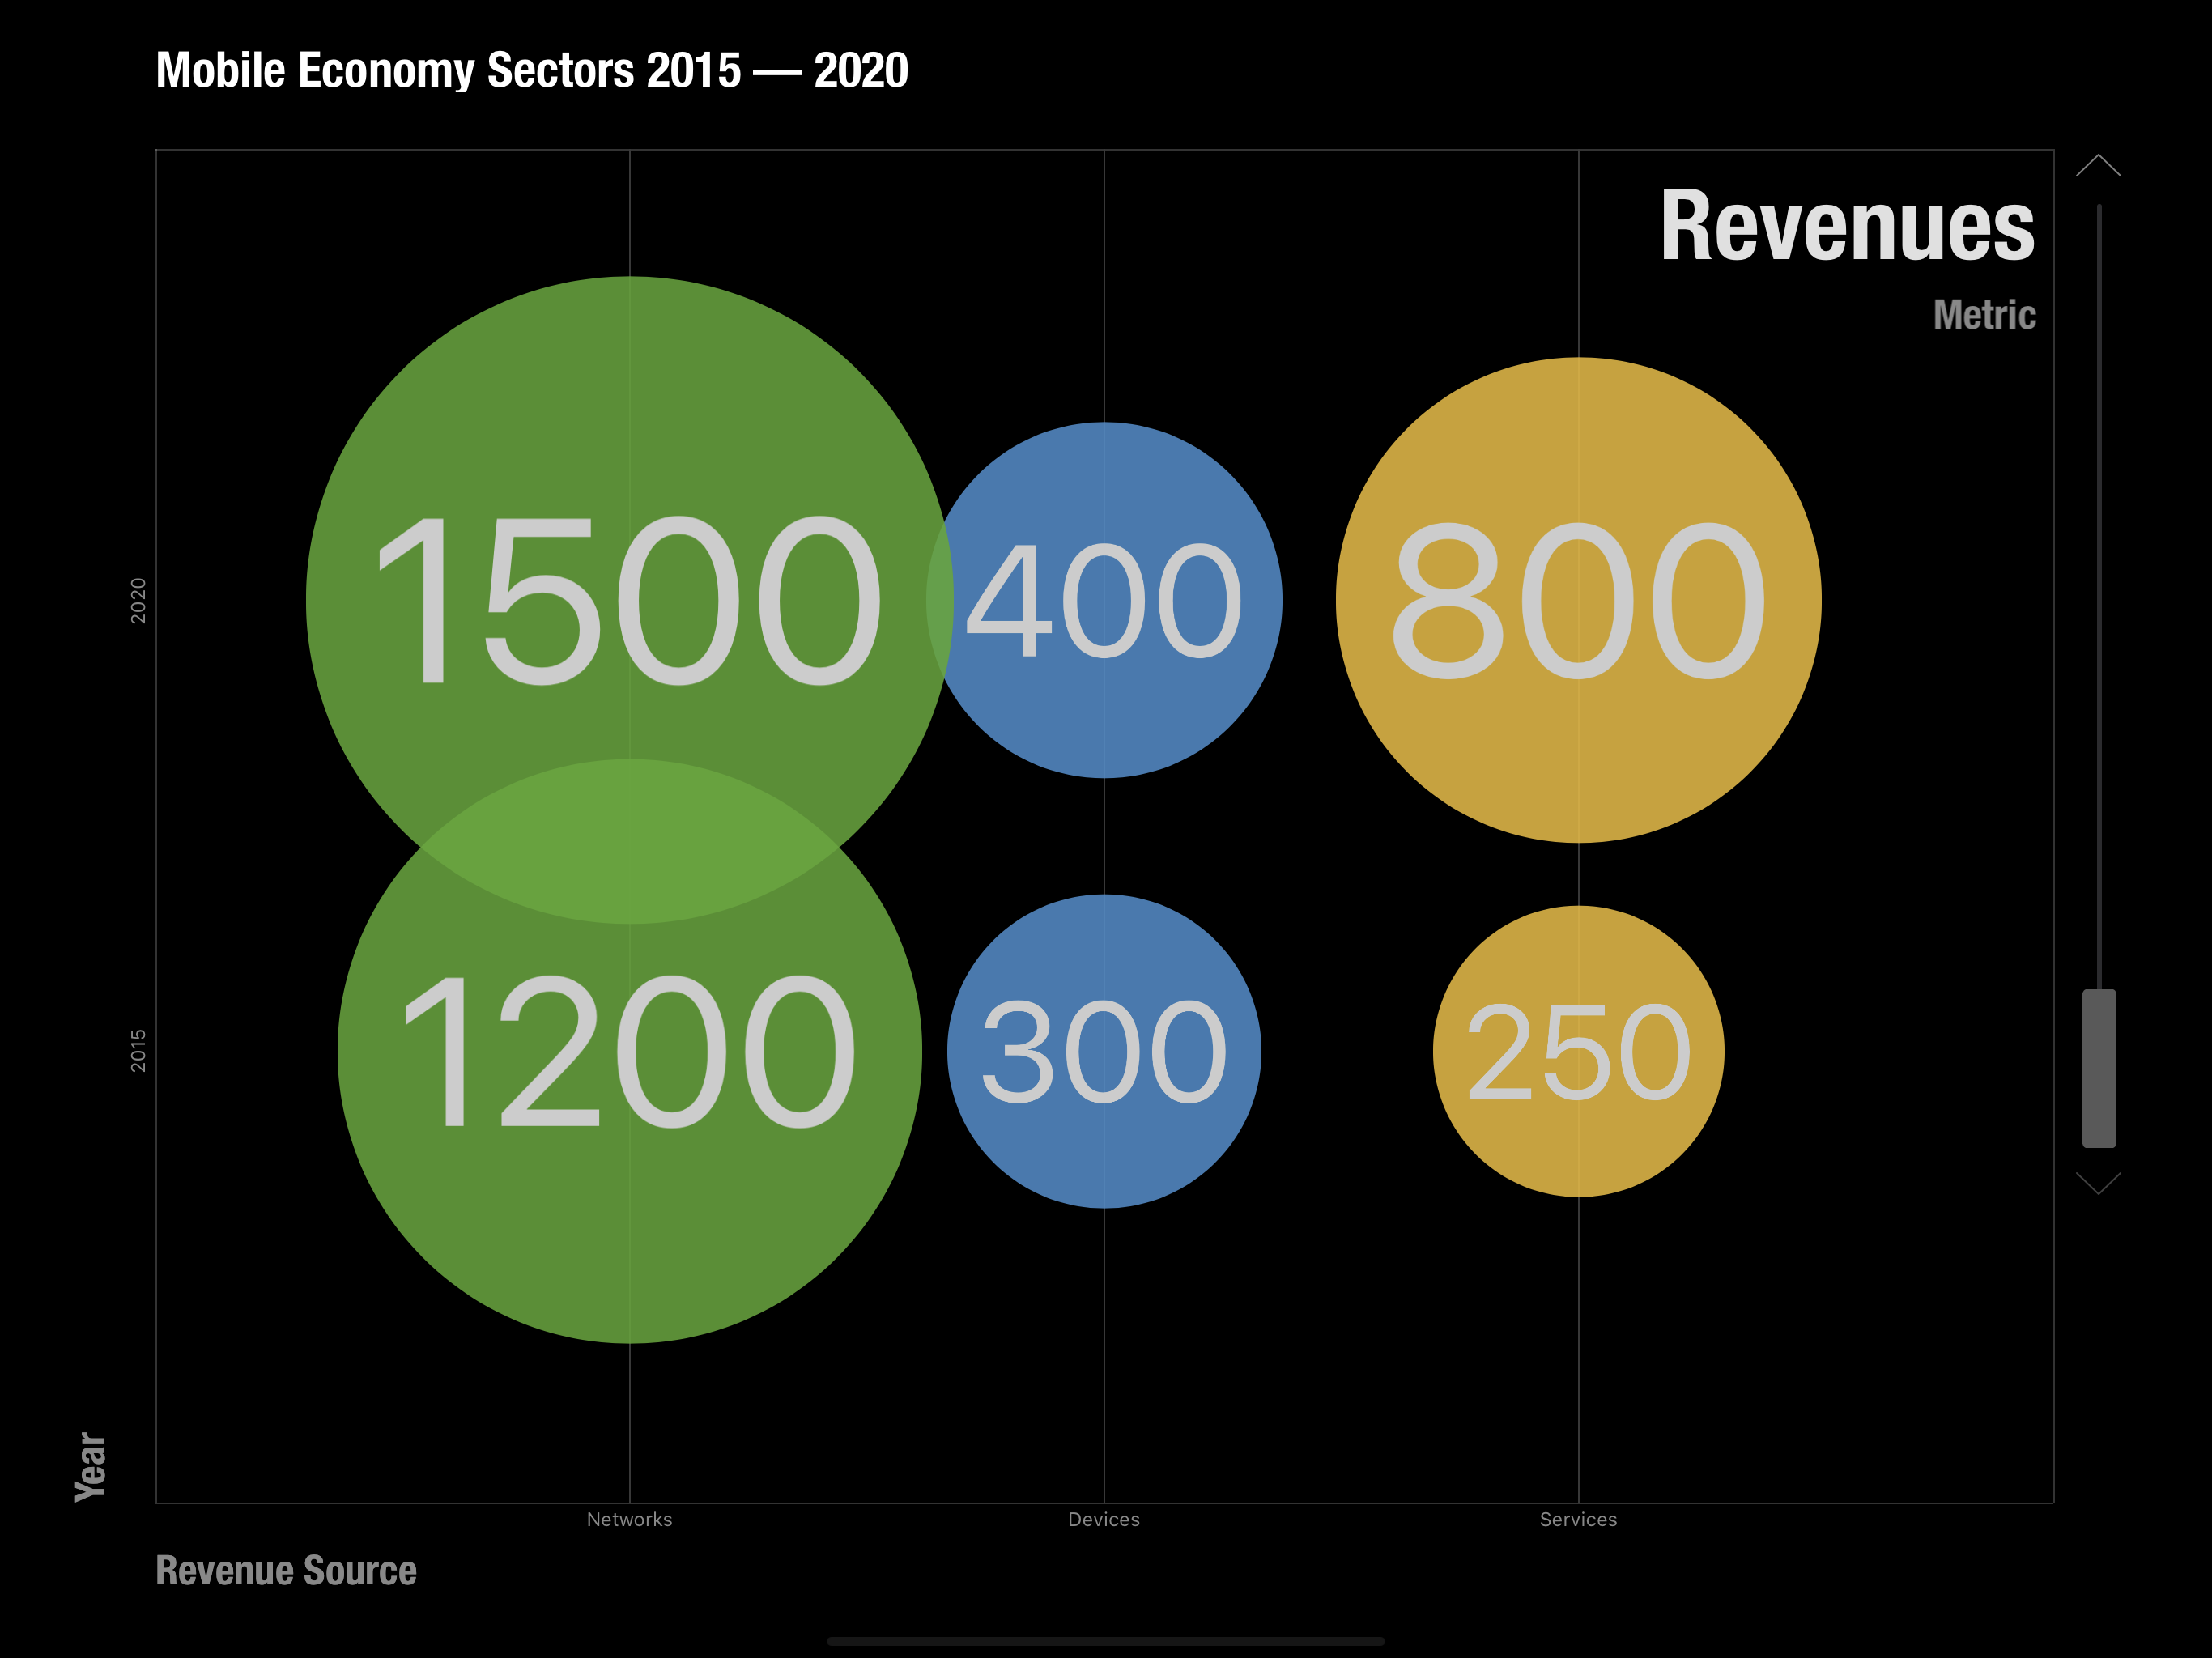
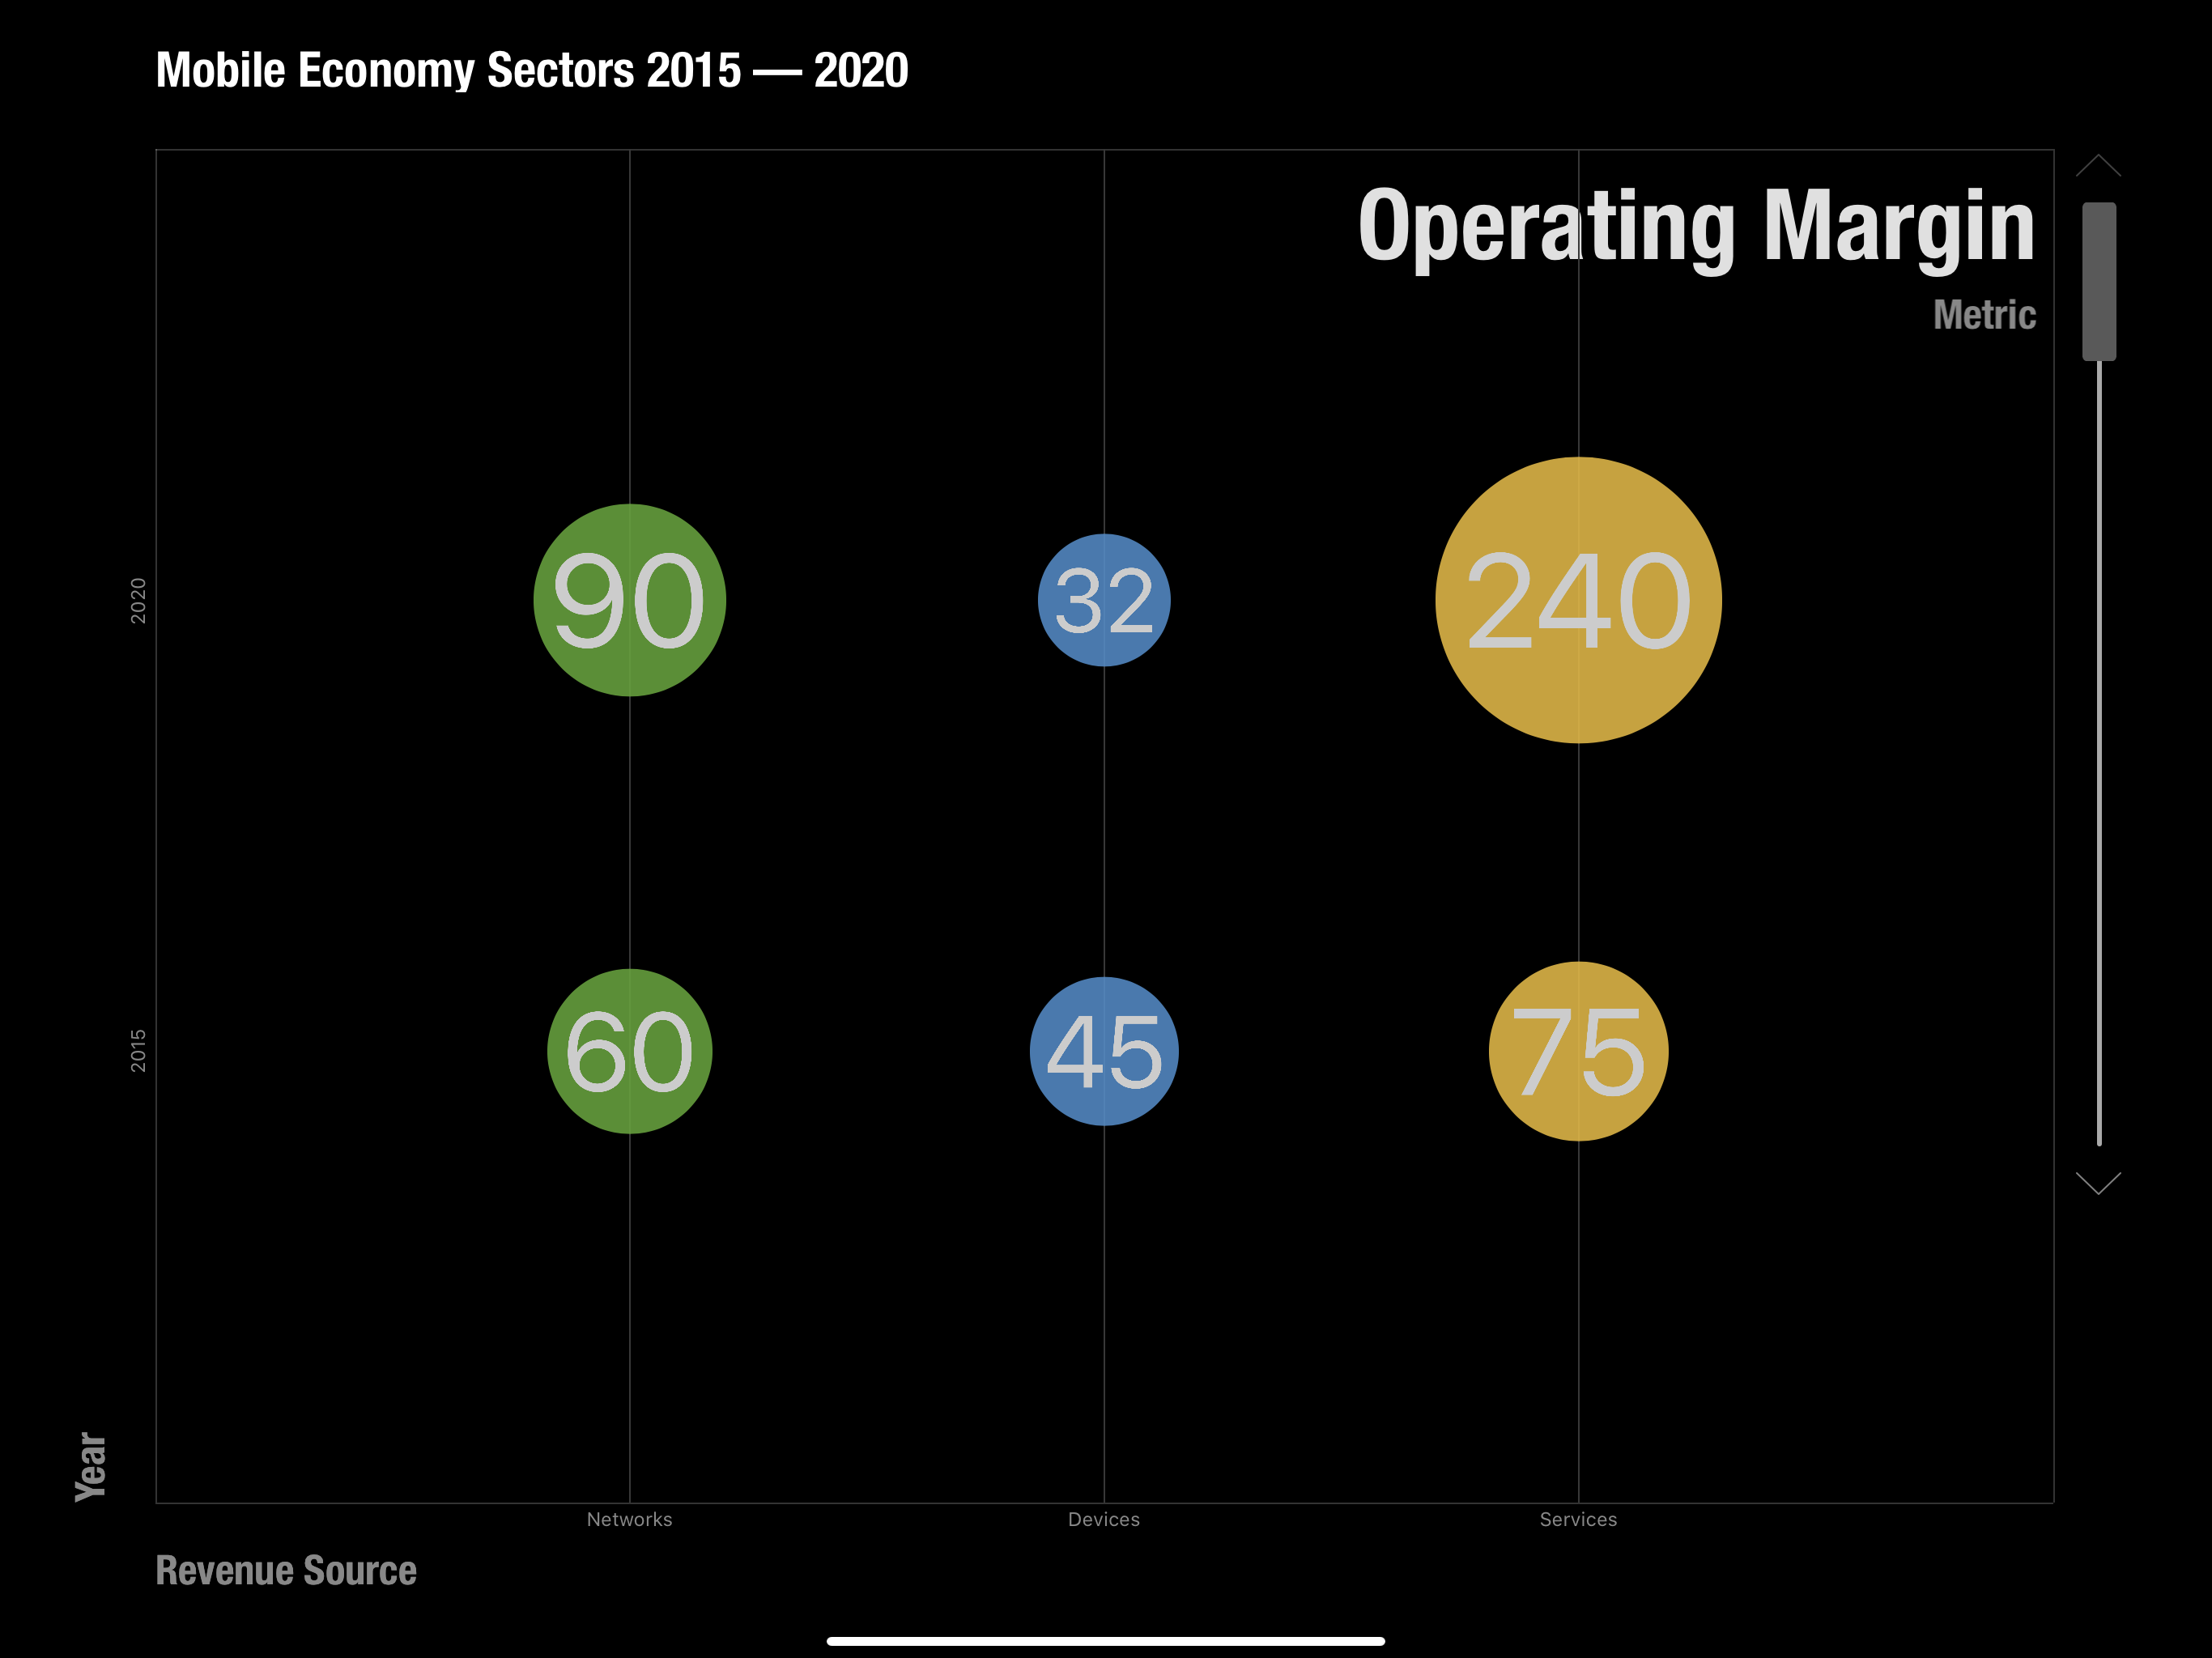
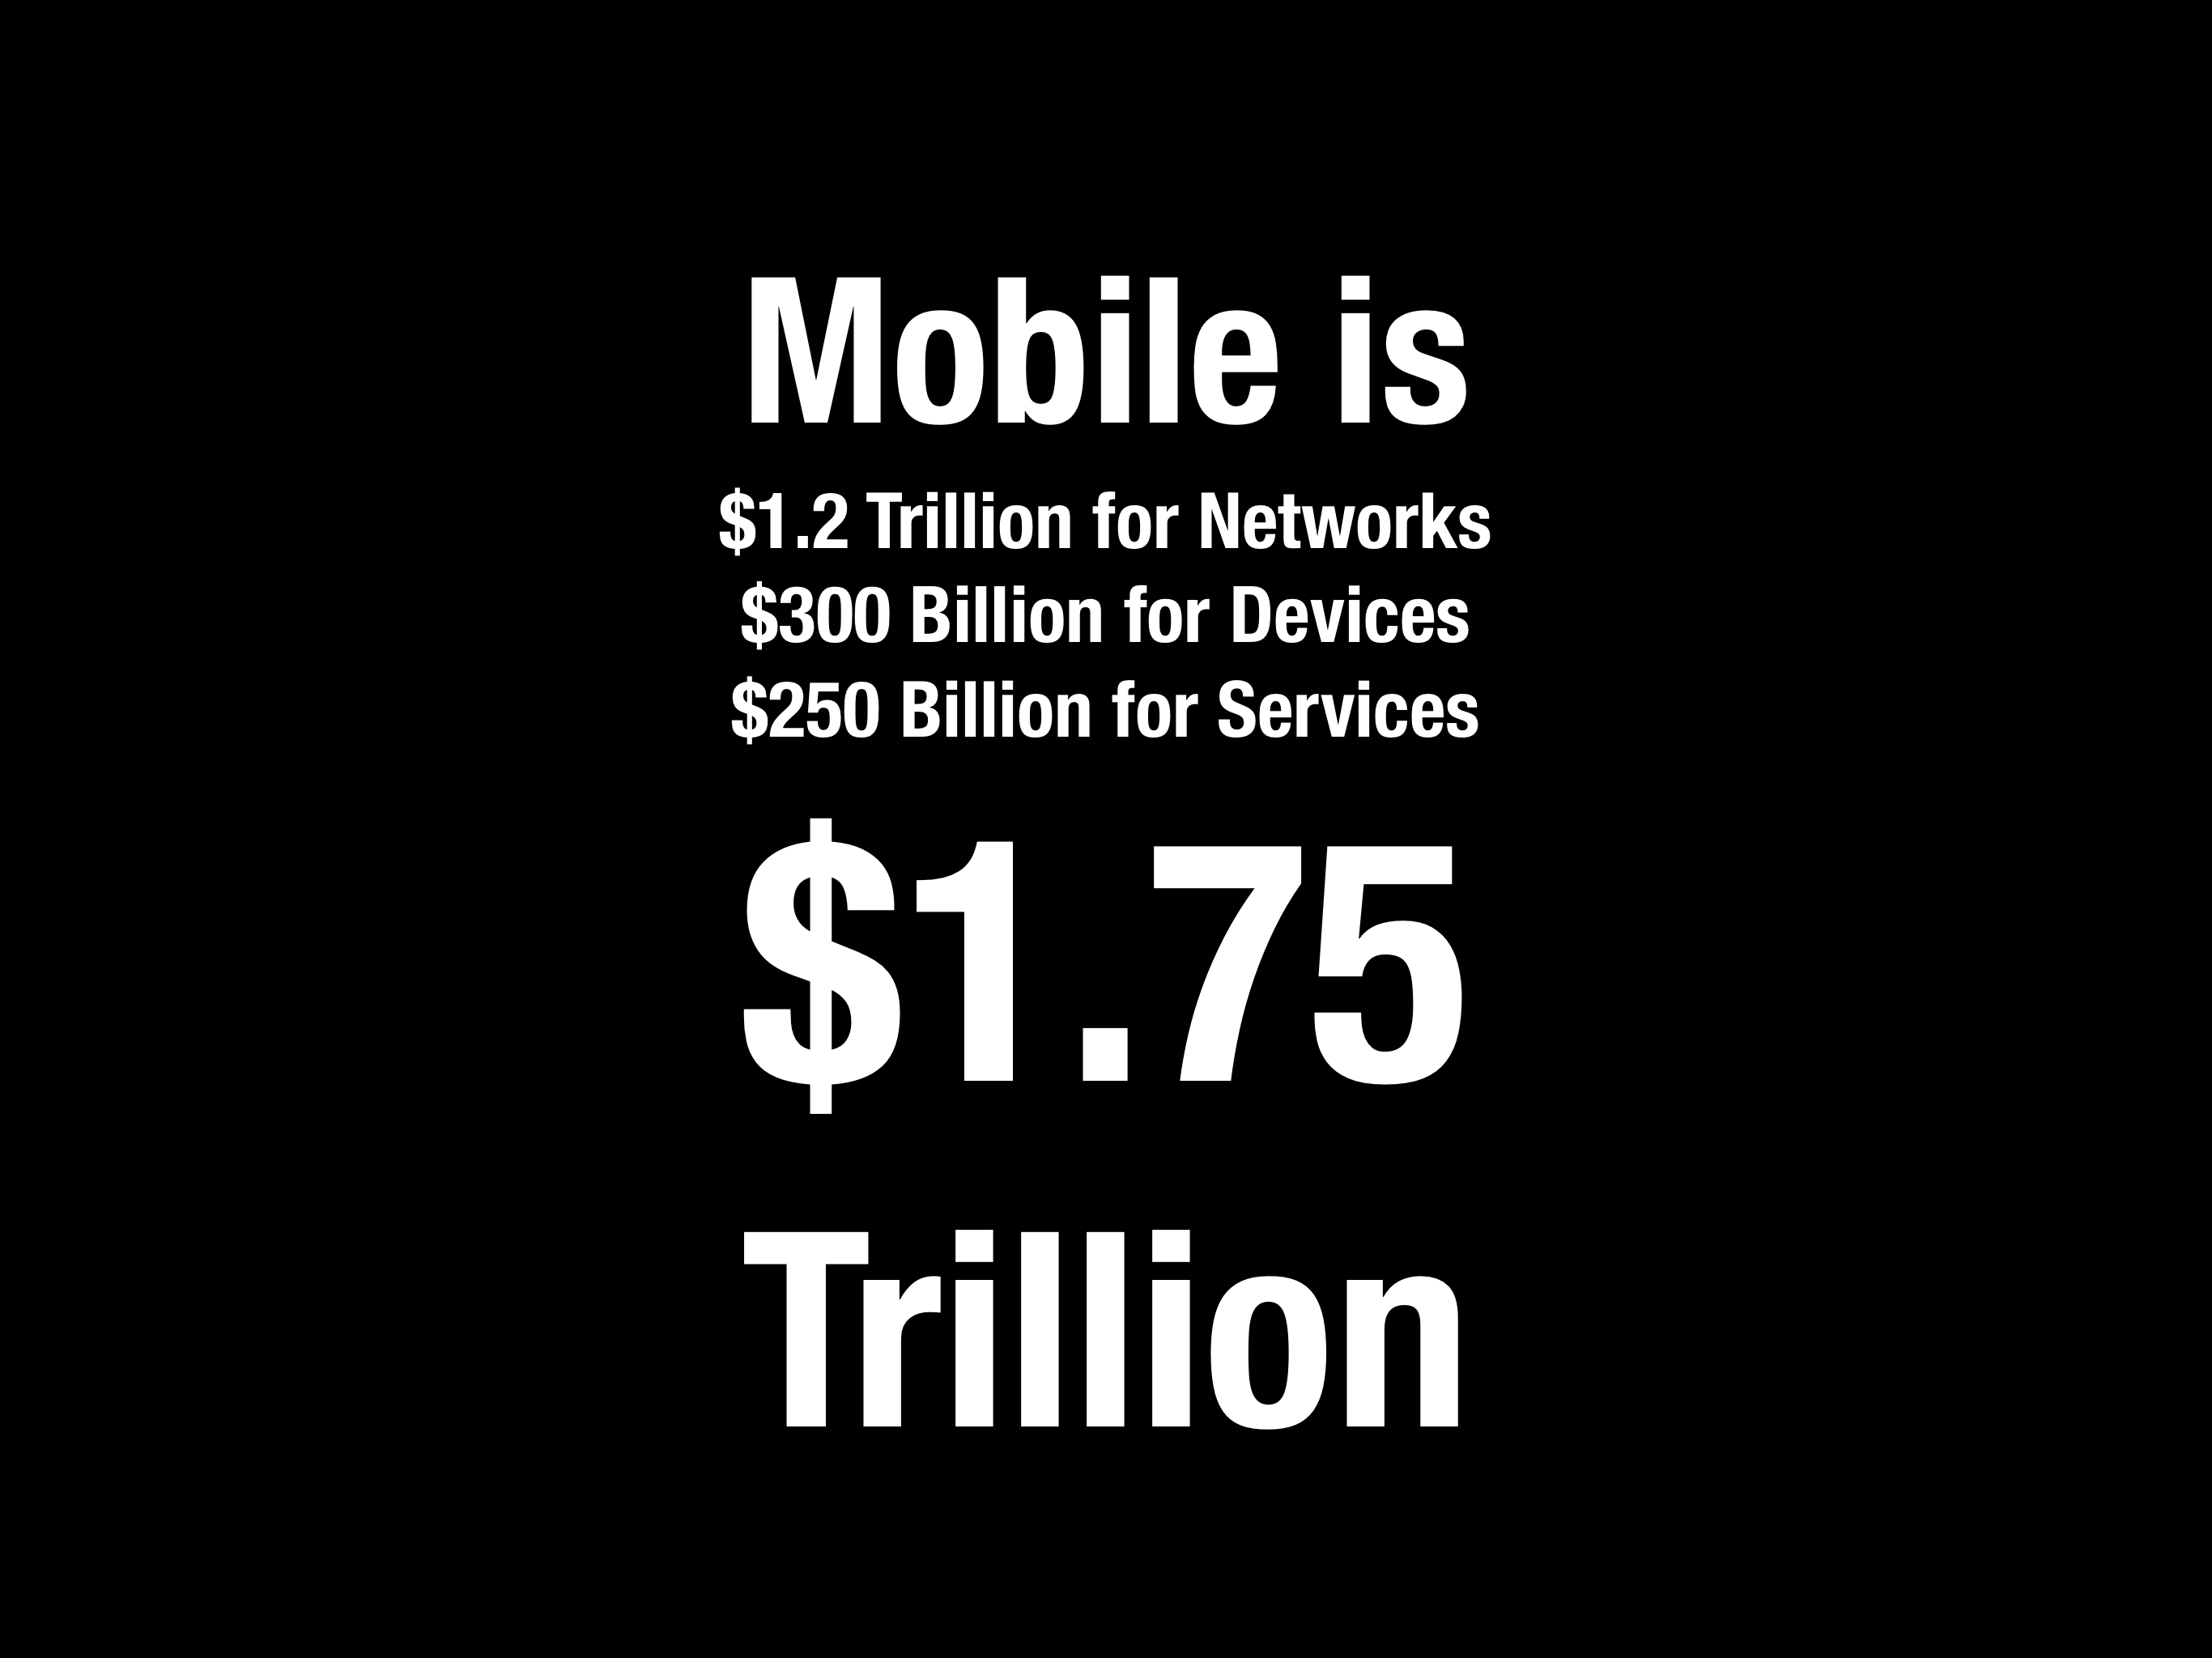
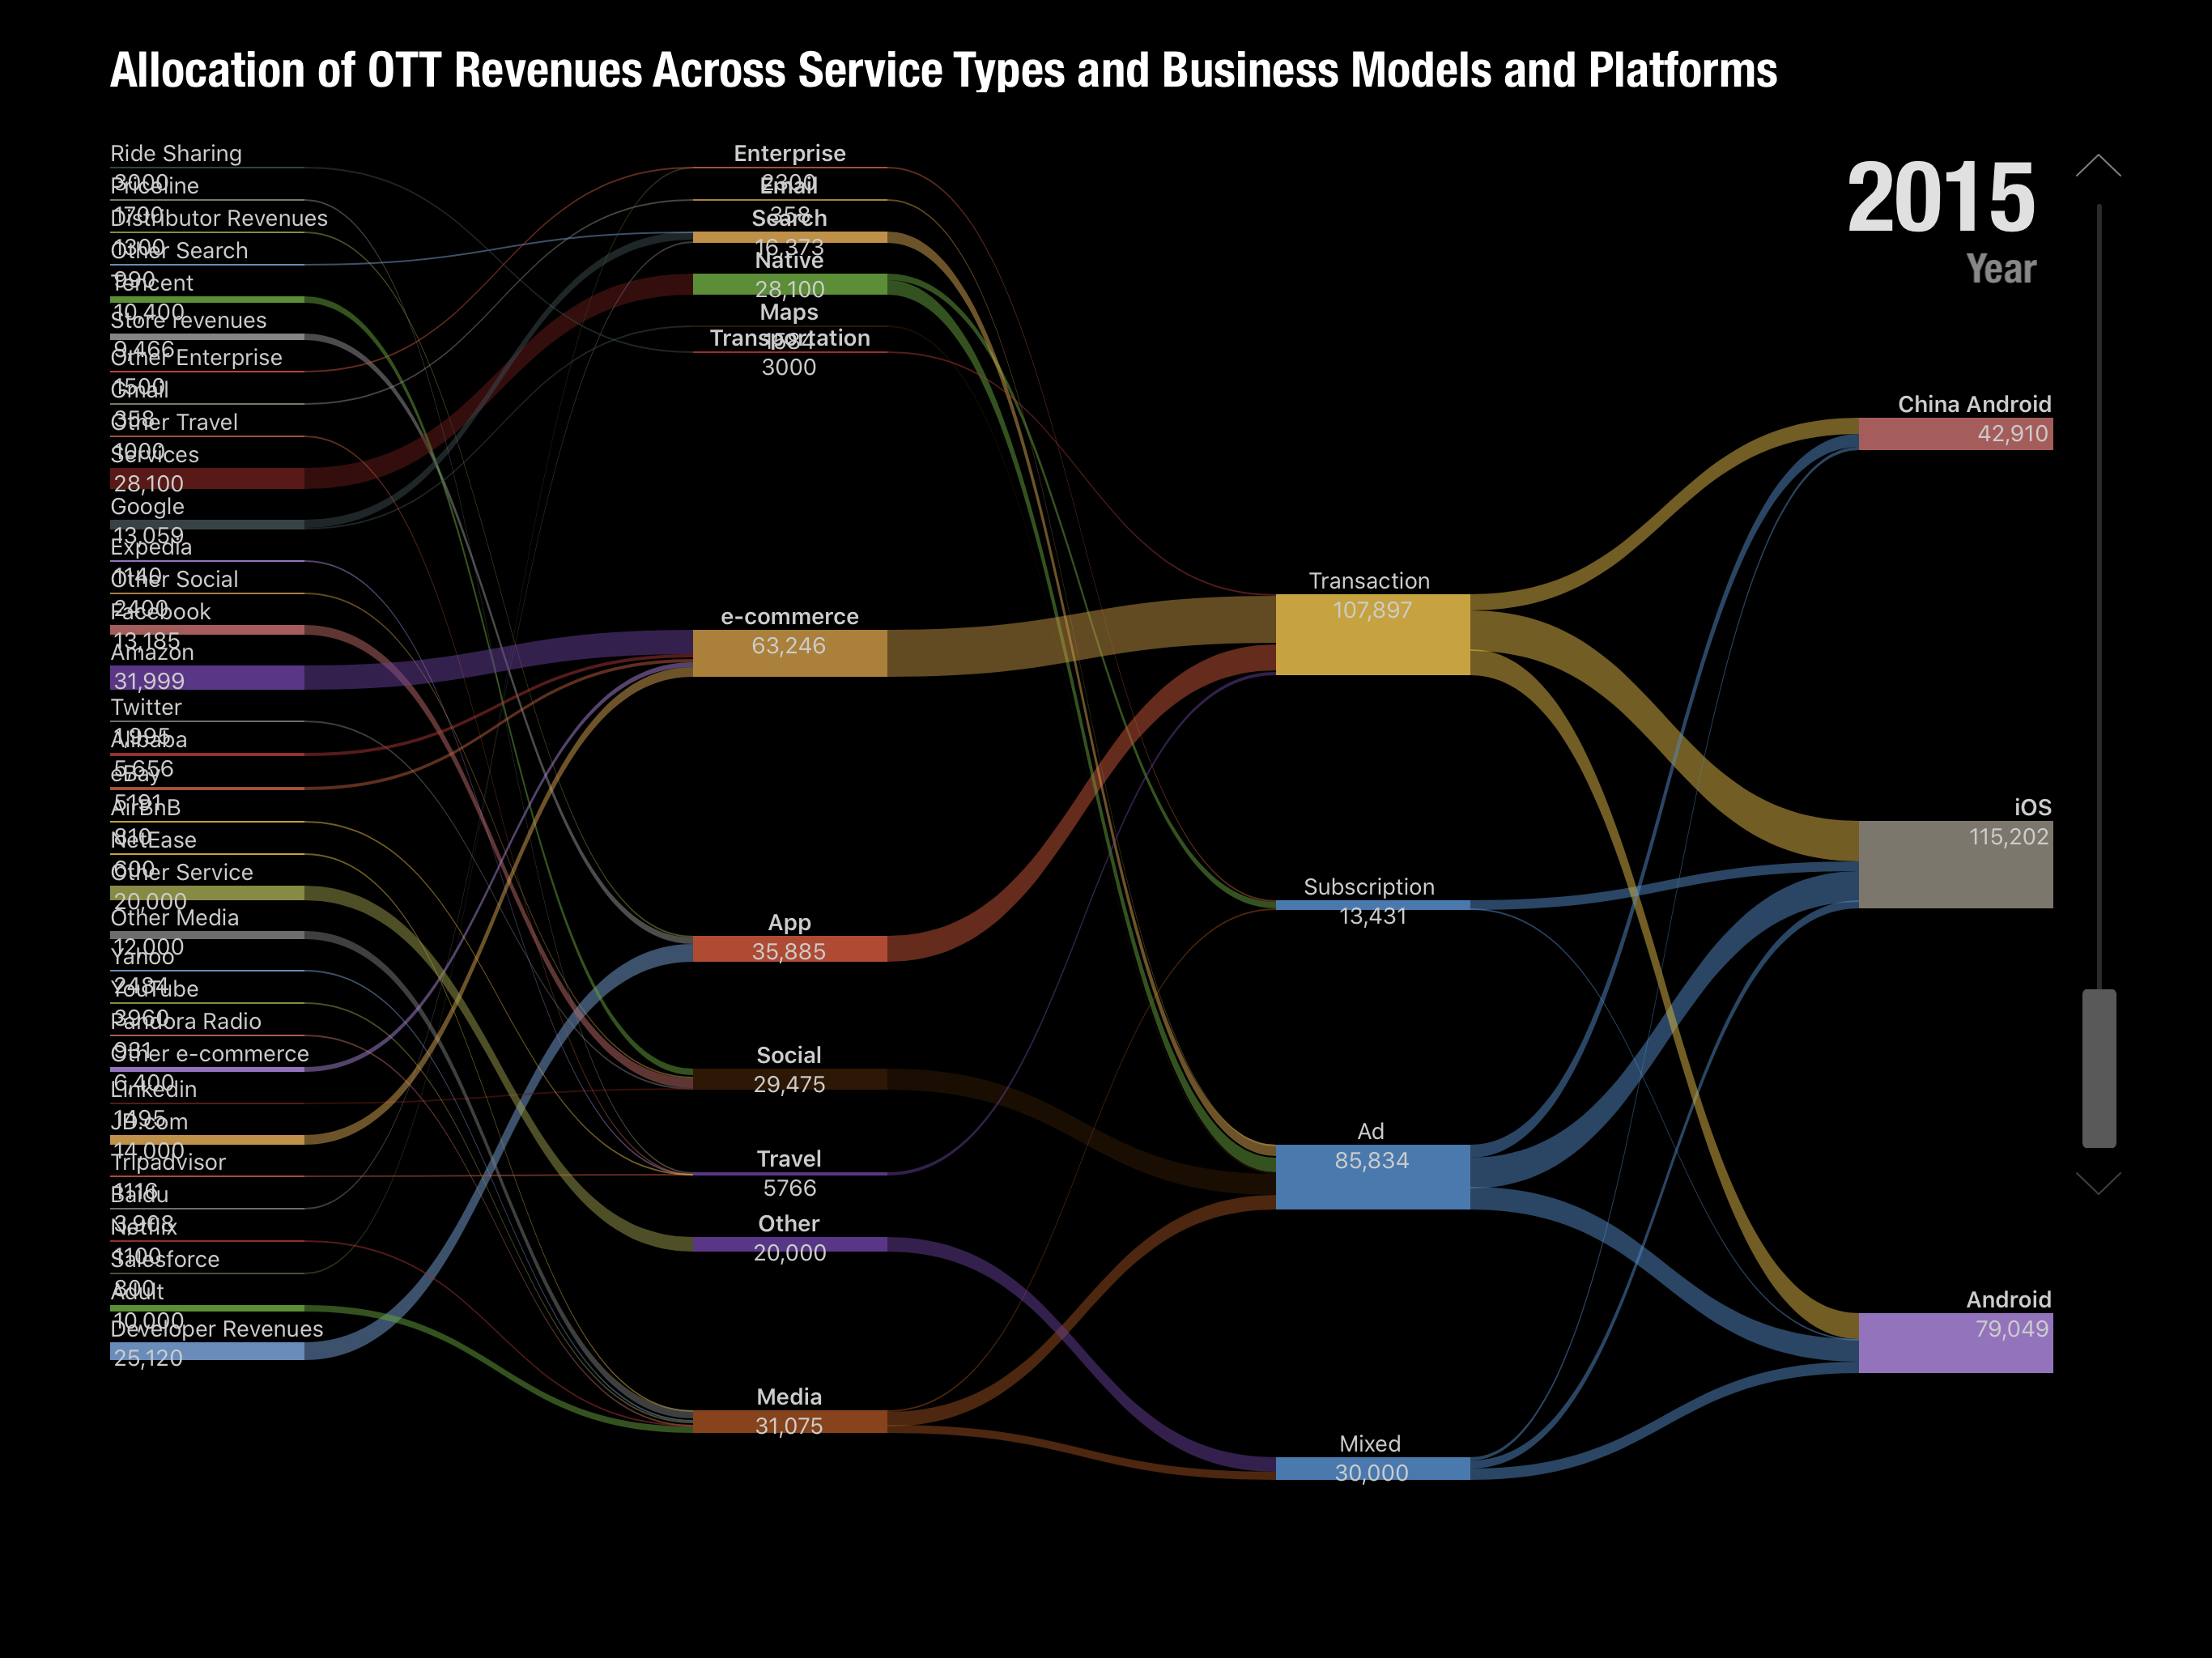
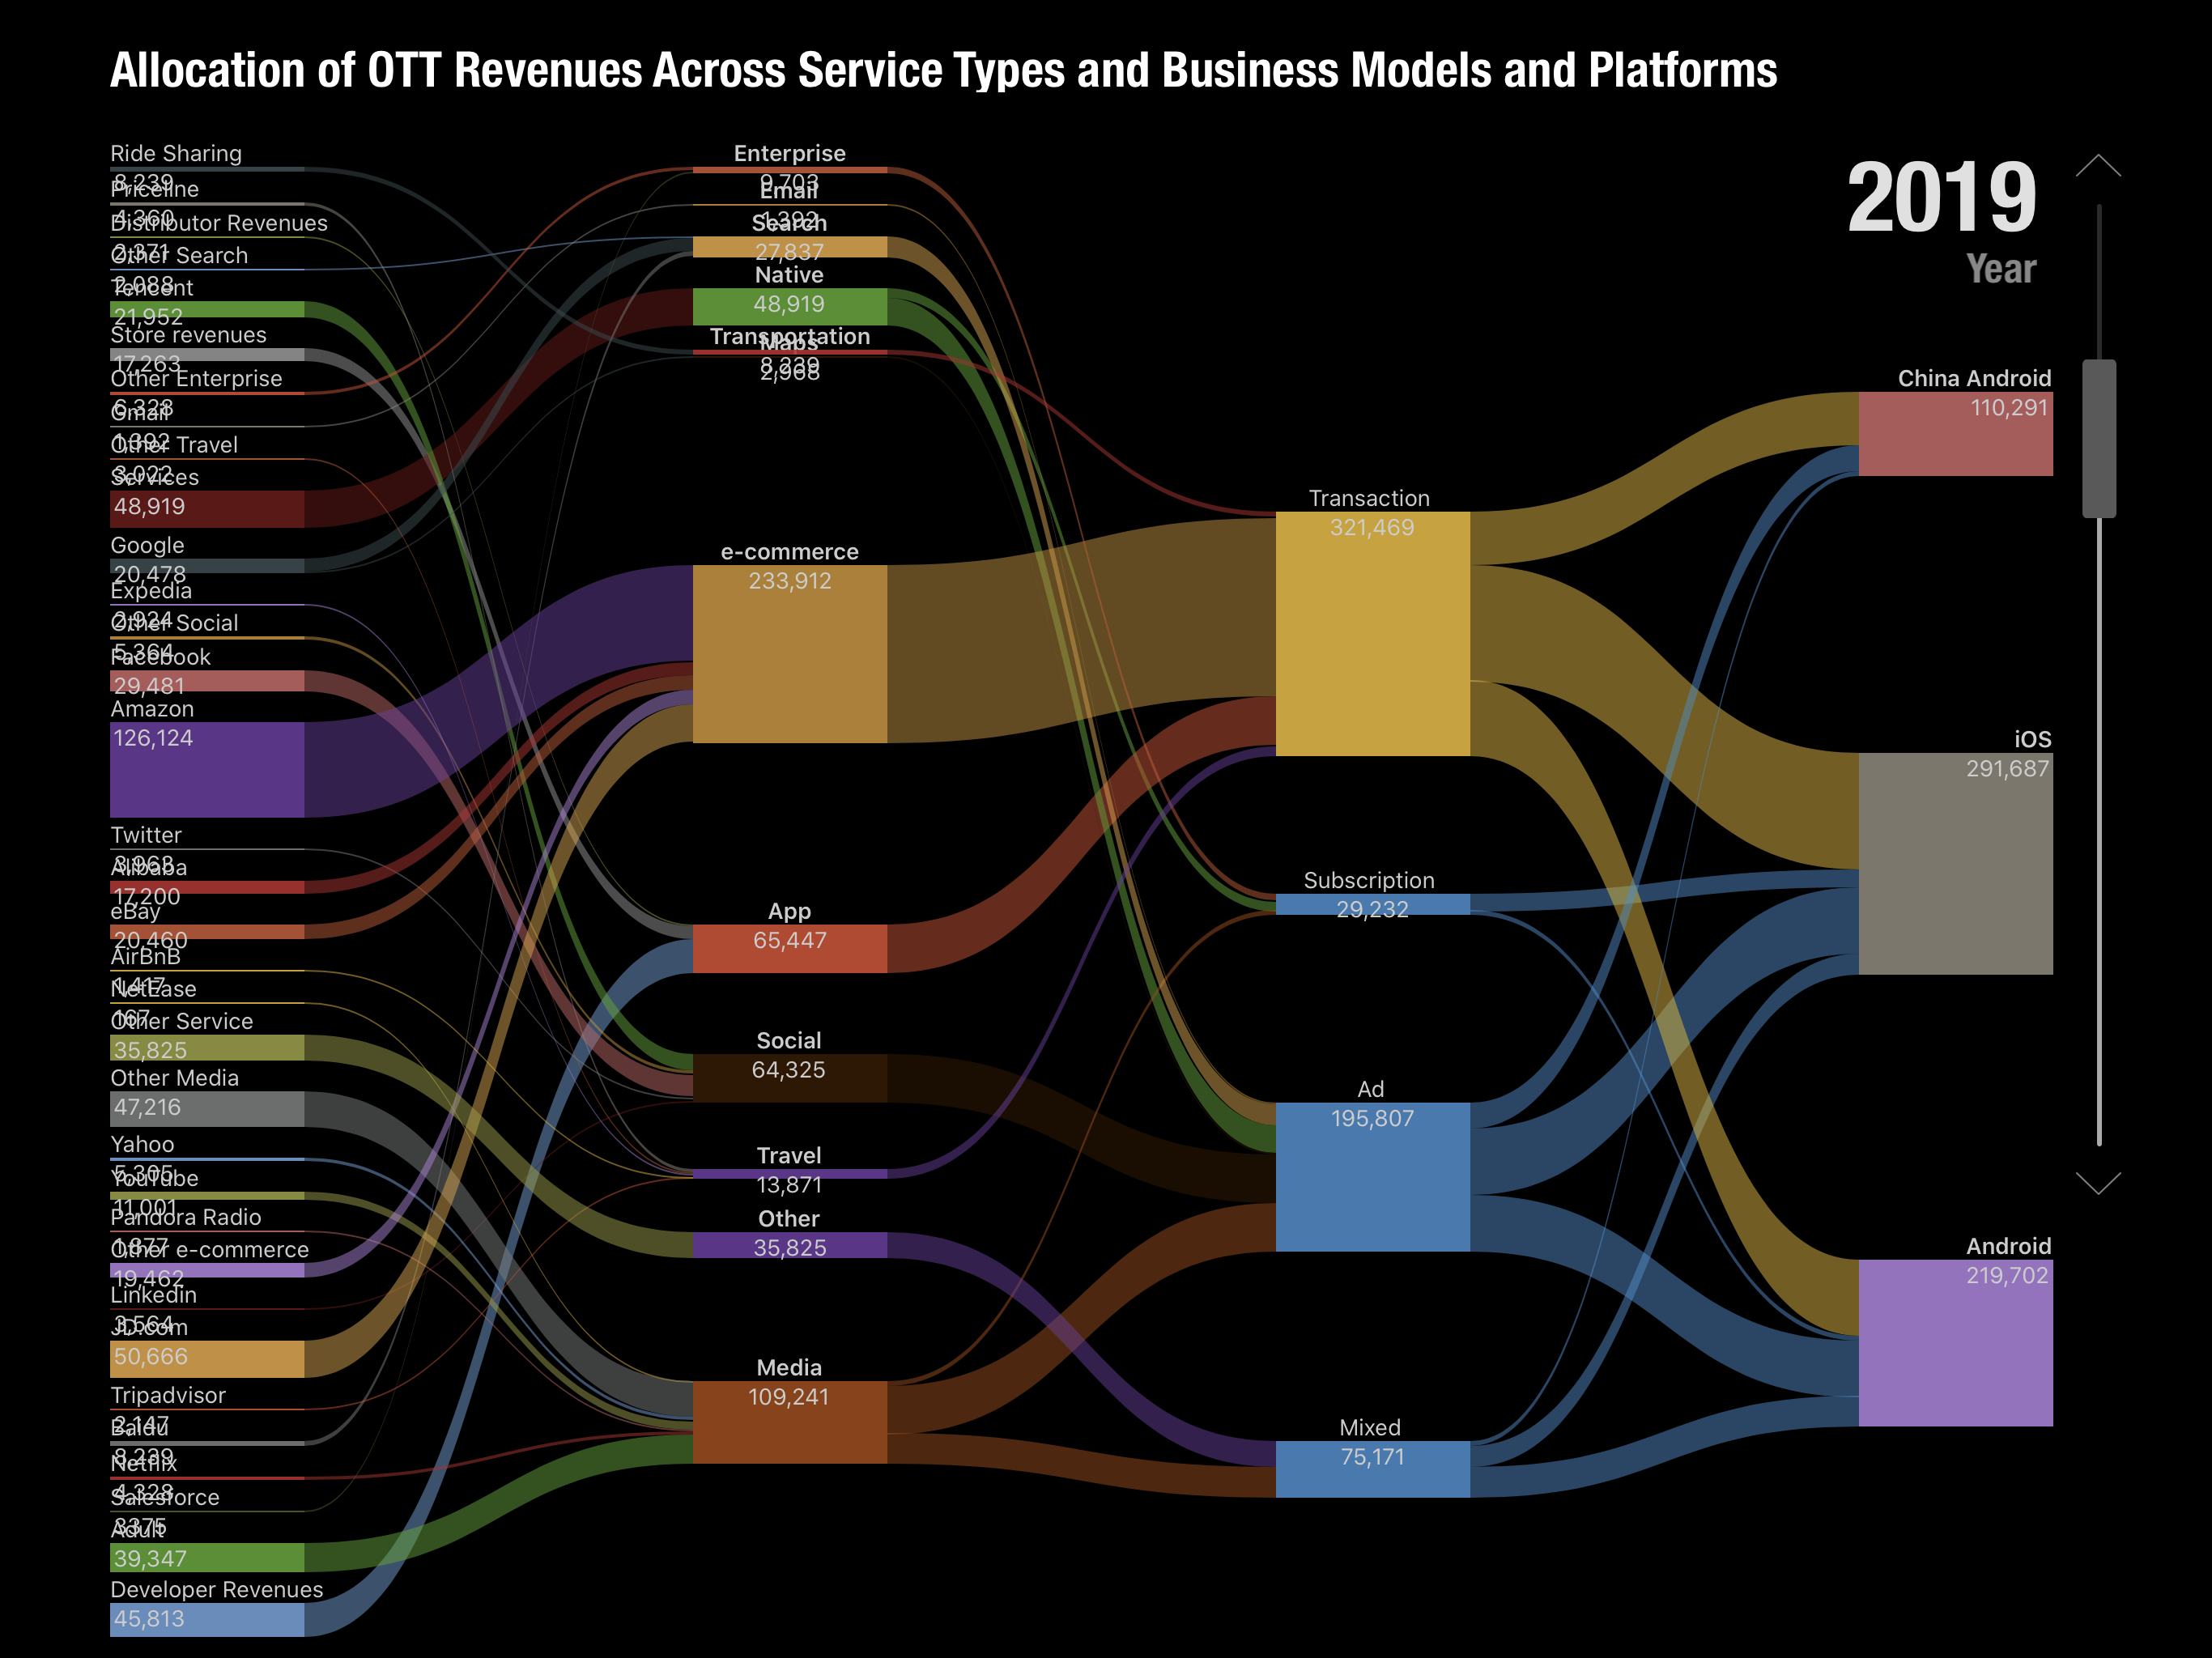
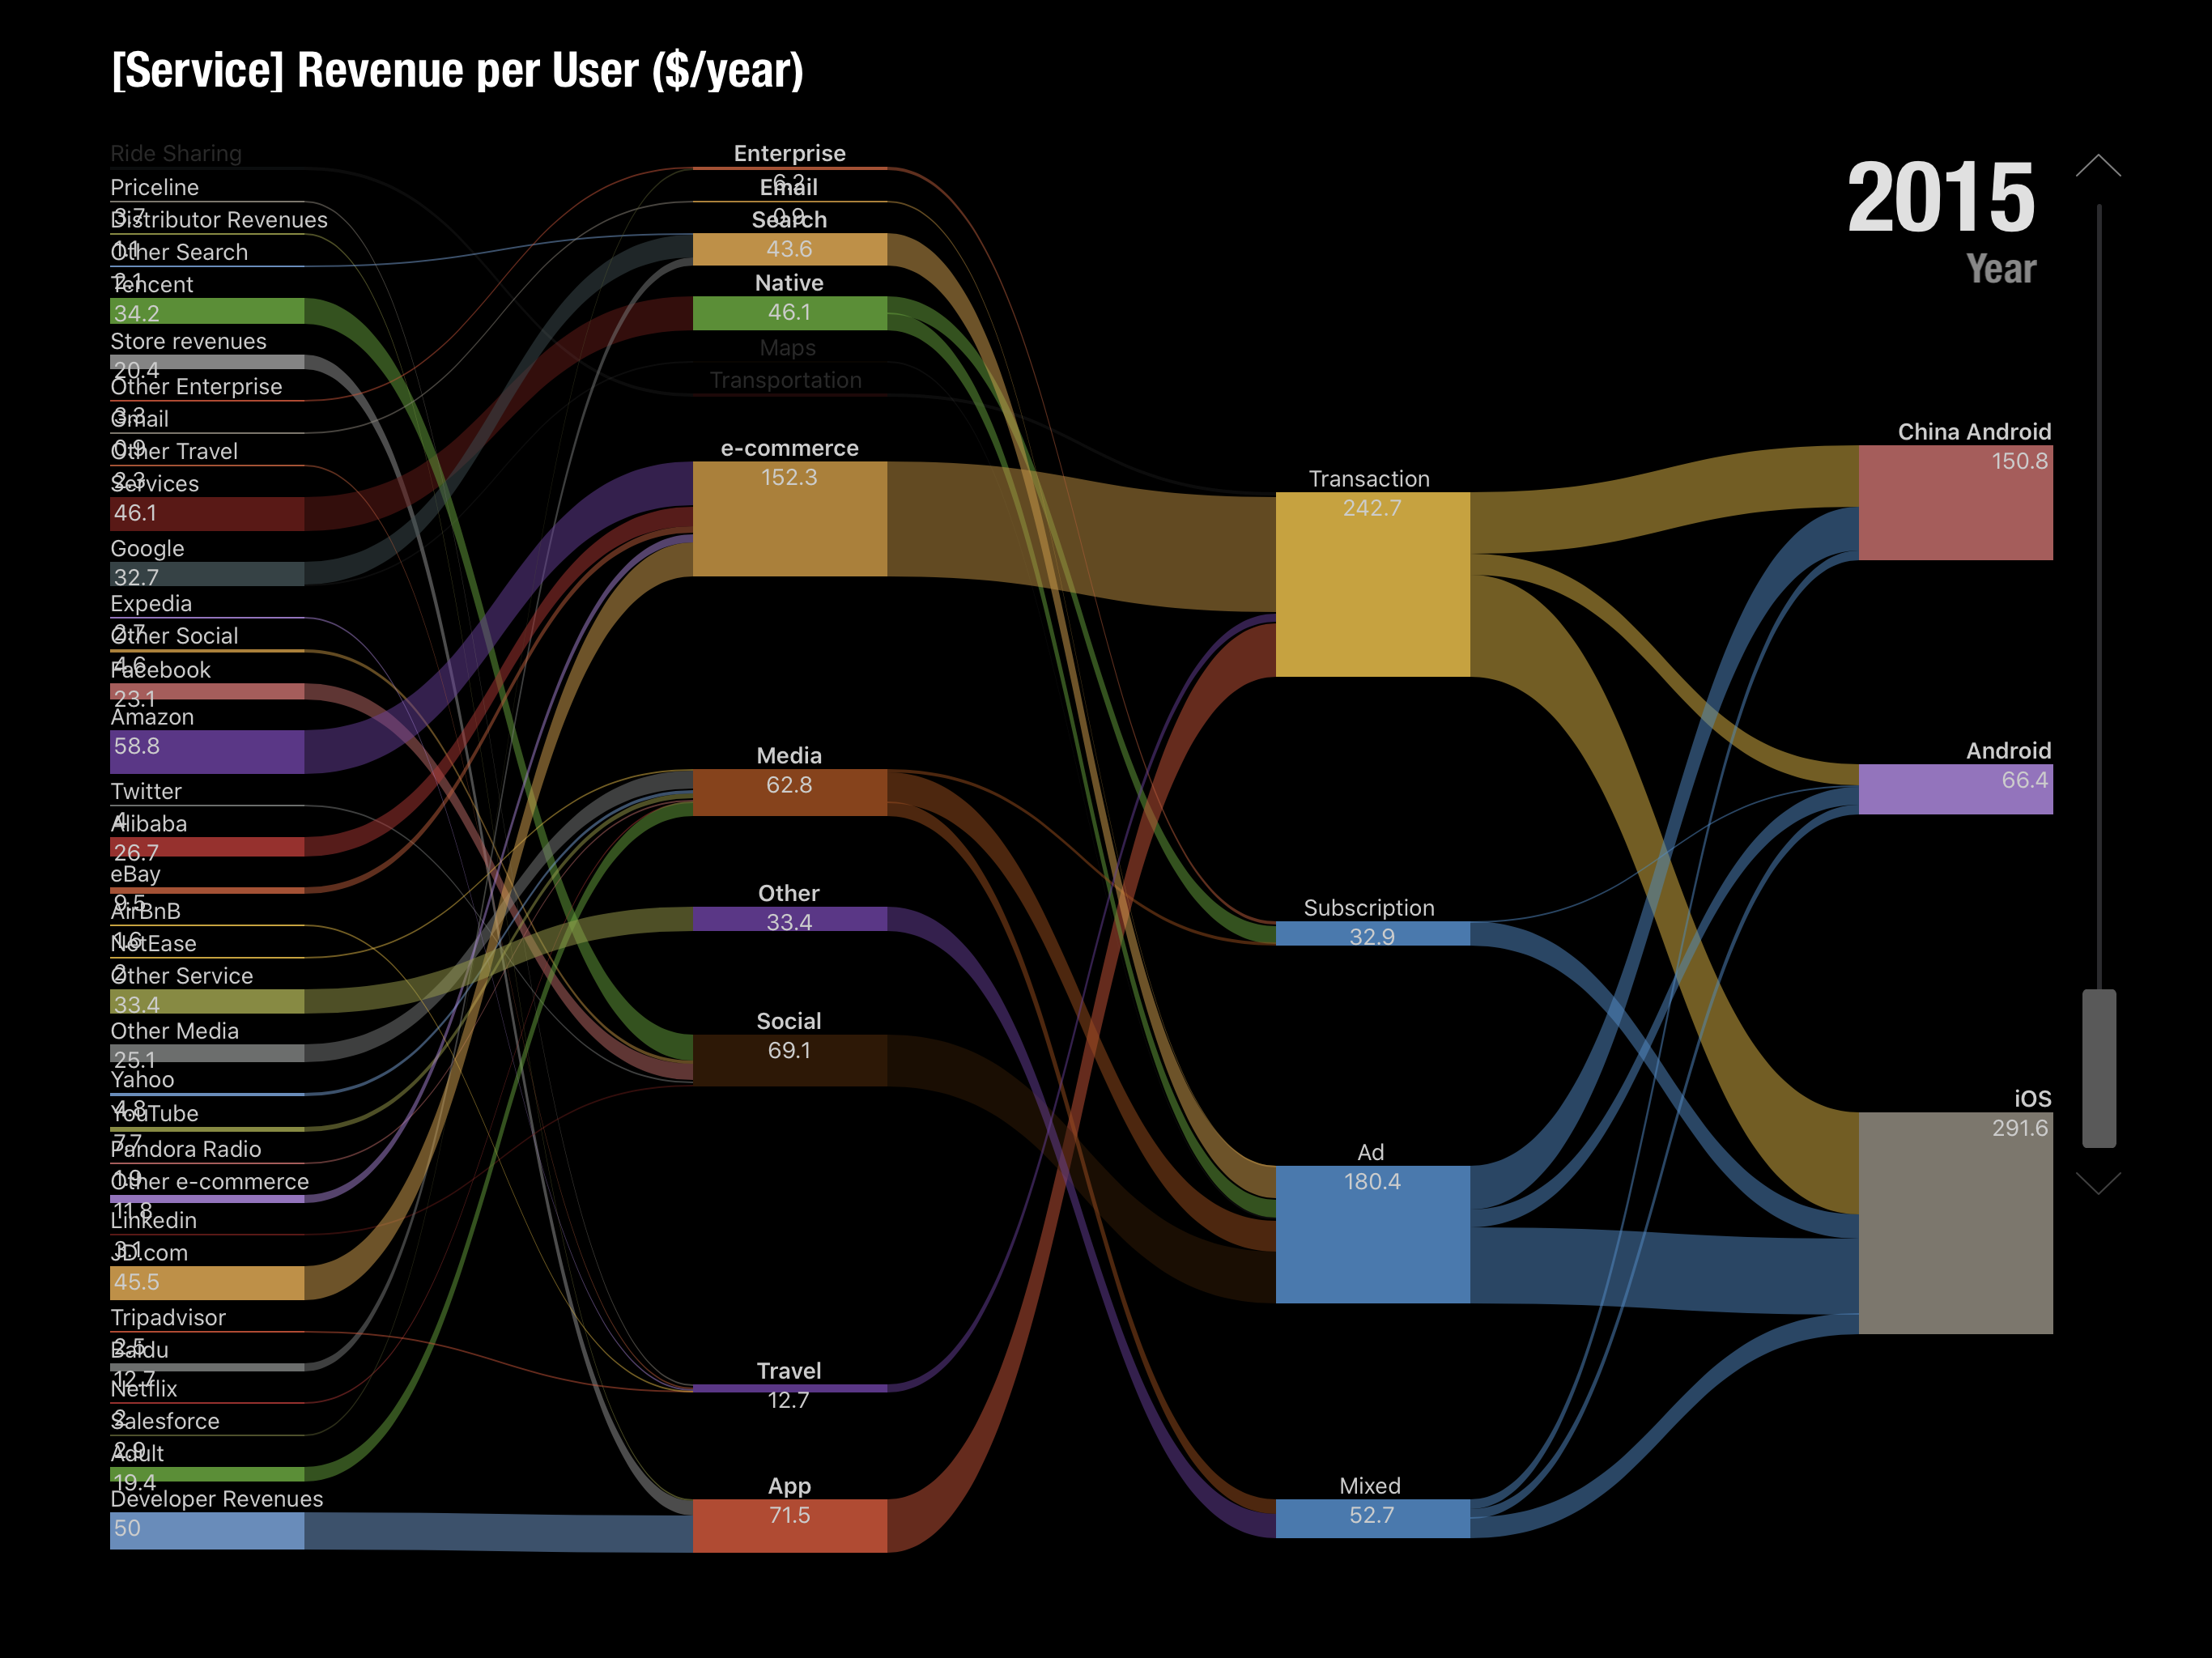
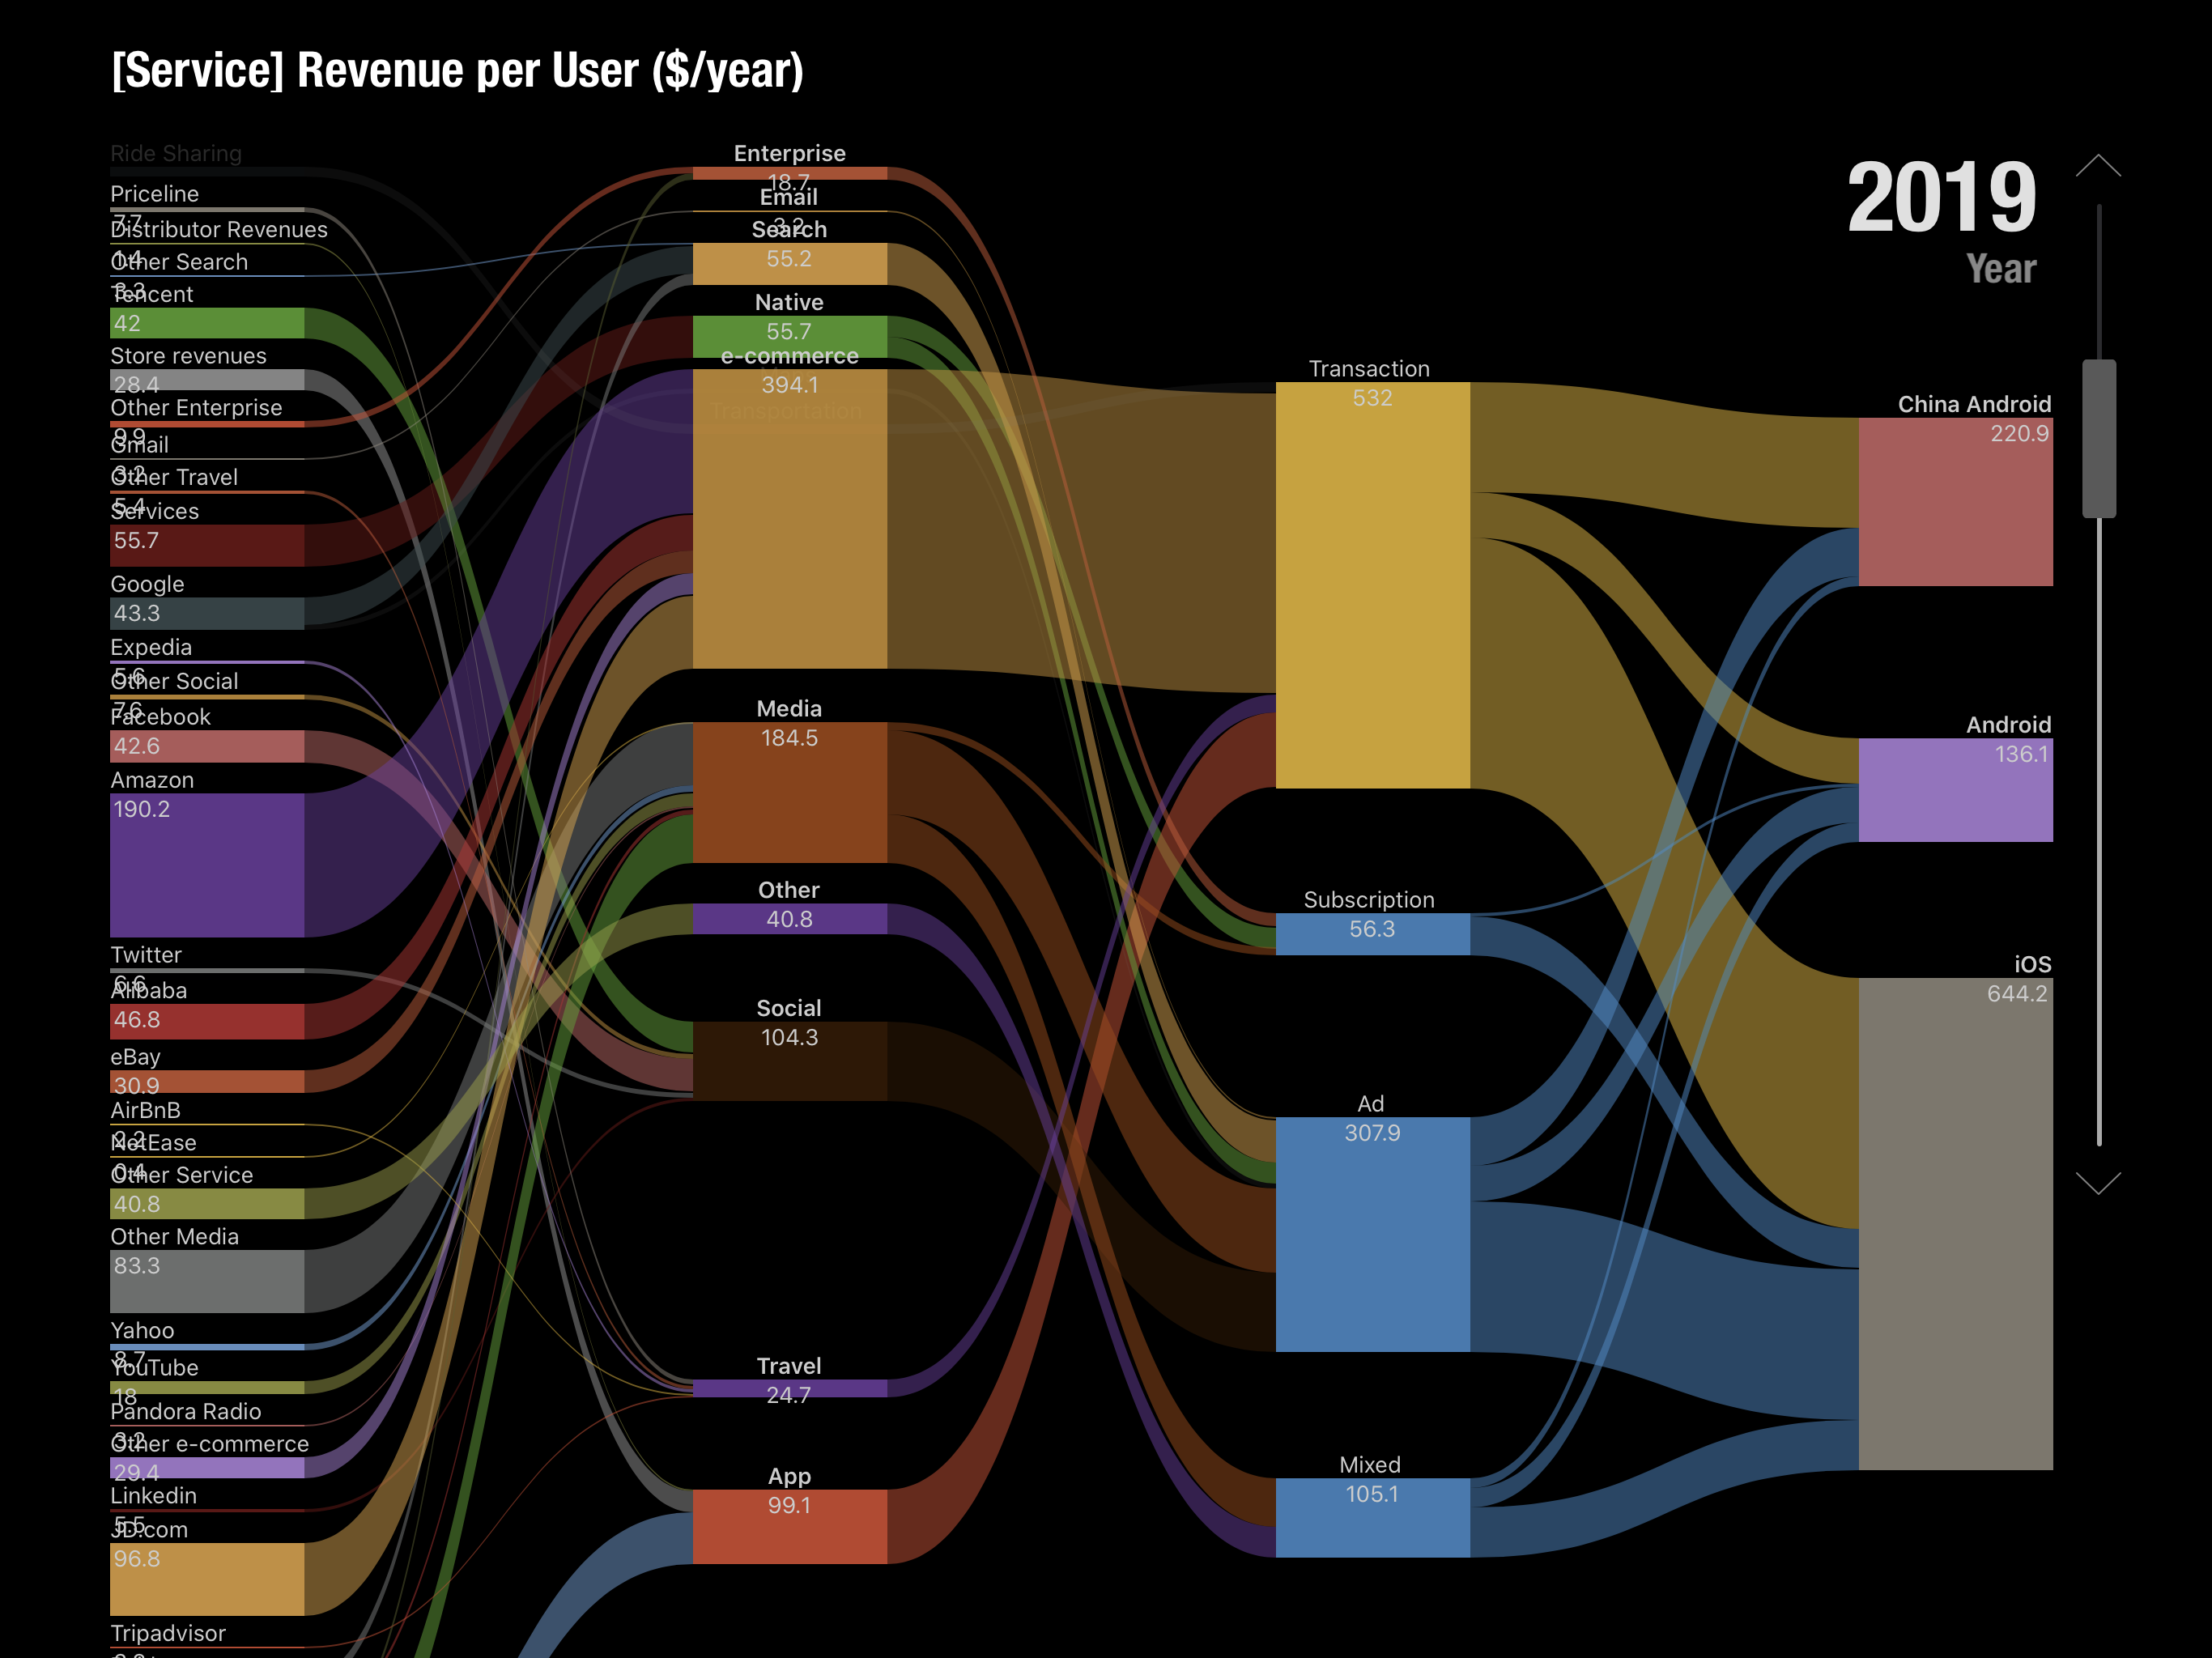
Revenues across Networks, Devices and Services 2015 to 2020 (estimated March 2016)Operating Income across Networks, Devices and Services 2015 to 2020 (estimated March 2016)Ecosystem composition (Third Party App, Native Apps, Other) 2015 to 2020, Android vs. iOS.Estimated mobile ecosystems total value by 2020 estimated in 2016.Over the top (OTT) service components by revenue model in 2015 estimated in 2016.Over the top (OTT) service components by revenue model in 2020 estimated in 2016.Allocation of OTT Revenues Across Service Types and Business Models and Platforms 2015 (estimated in 2016)Allocation of OTT Revenues Across Service Types and Business Models and Platforms 2019 (estimated in 2016)Composition of service revenues per user ($/year) for mobile platforms in 2015 (estimated in 2016)Composition of service revenues per user ($/year) for mobile platforms in 2020 (estimated in 2016)
Of course there are several potential errors in this methodology. The categories were not all inclusive. I used Social, Media, Search, Maps, email, Messaging, e-commerce, Travel, Enterprise, Storage, Transportation, Travel and Other as the top level categories. There are many products and services who would end up in Other. Moreover, these categories were anchored by the top companies in each category and the share of the top names was not always clear. Finally, the growth rates for these categories were based on historic trends which could change either way.
The online services ecosystem (all platforms) was thus estimated to be $450 billion in 2015, growing to $820 billion by 2019 and $914 billion by 2020.
The mobile split would vary by segment but would be roughly 75% by 2020 (25% would not be mobile). The final assumption was based on the split among the existing mobile platforms. I put a multiple of roughly 50% for iOS and 35% for Google Android and the rest for China Android.
Multiplying all these assumptions gave me a figure of $275 billion for the iOS portion of the global online services market in 2019. (Incidentally, Android was estimated at $207 billion and China Android $110 billion.) Note that this does not mean this was an expectation of Apple's revenues or that this was the opportunity of Apple obtaining any percentage of this revenue. It was simply the value of what would transact through iOS, a platform which would act as a commerce enabler. This was to be the size of the iOS "ecosystem" or co-dependency between Apple and the companies delivering through its platform.
Ecosystems are a powerful idea. As I recall, this term applied to mobile was coined by a Palm executive in the late 1990s when he referred to the value of all the apps built for the Palm Pilot. The biological term refers to the system of multiple species living in close proximity. It implies an equilibrium as each species benefits from the others and the environment. There might be predators and prey but biodiversity is the successful construct.
The idea of an ecosystem for a platform was also the core strength of Microsoft's Windows which created the network effects around it and it has been the goal of every platform since. The nature of computing and networking implies that these systems grow faster and are more resilient than the more traditional value networks of other businesses or industries.
Now this ecosystem was something we wished to highlight in 2016 as a core strength for Apple. It was not considered as such at the time and I thought putting a figure of $275 billion in 4 years' time was a way to highlight the potential. Time since has proven us right.
This week Apple highlighted the result of another research team who attempted to measure the iOS ecosystem. Their conclusion was that billings and sales facilitated by the Apple App Store Ecosystem in 2019 was $519 billion. More than twice the amount I had so optimistically forecast four years earlier.
The authors also emphasize that this is a conservative estimate and should serve as a baseline.
I feel partly vindicated about that figure as my attempt at a figure was intended to highlight the scope of the ecosystem and it is better to have underestimated it than overestimated it. The authors' methodology was also similar in being bottom-up summation of components by categories of services but the information available today is enhanced by the new data Apple made available on subs and Services revenues and install base.
Note that in the graph below the salient data points of subscribers (red triangles) had not begun until 2017 causing the acceleration in Services revenue (yellow line). Note also the additional square points representing install base.
This figure of more than half a trillion dollars of value transacted through iOS should give some pause. It it a very powerful figure that can be combined with the other data from Apple:
More than 1.5 billion active devices
More than 1 billion iPhone users
More than 500 million paid subscriptions
More than $1/day iPhone hardware revenues for Apple
The half-trillion per year on services implies between $335 and $520 in spending per user (likely closer to $500) per year. This would be in addition to the approximately $365/yr in hardware spending per user (which Apple books as hardware revenue). In the case of the iPhone there is yet more: the cellular network service which may average $350 per year.
To simplify, the "average Apple user" spends $1/day for each device, $1/day for the network and $1.4/day on items bought through the device. Adding a margin of error, that's between $3.4 and $4 per day each user spends. Oh, and there are about a billion such users.
The total spending enabled by iOS thus is close to $1.4 trillion/yr.
That's a significant amount. It's bigger than many industries. There are only about 12 countries with higher GDP (Spain is about the same.)
How does Apple benefit from this?
Apple captures 30% of billings through its App Store. My estimate for these billings were $67.9 billion in 2019 which means App Store billings were 13% of the 2019 ecosystem. Apple's 30% cut of Billings amounts to 3.8% for the whole ecosystem. It's hardly an oppressive number.
If Apple only captures 3.8% what use is this to Apple?
The last decade has seen Apple emerge as the world's largest company in terms of market capitalization, and not doing so with a wild multiple of revenue or earnings, quite the opposite. It did this by creating the world's greatest customer base. Not in absolute scale. Android and Facebook have larger customer bases with multiple billions of users.
No, Apple's one billion users are simply the best billion users. They are the most likely to stick with Apple and they are the most likely to buy more from Apple and—this is crucial—they are the most likely to buy everything else. Those other companies whose sales come from Apple customers have been taking note. They know that Apple customers are desirable customers and choose to target Apple customers, as much as they can. Associating your company with Apple makes a lot of economic sense.
I will admit however that my argument that Apple created a customer base is contrived. The fact is that Apple creates productsand services and those products are the root of its power to attract the right customers. By choosing to create the best products it coincidentally chooses to create the best customers. The power flows from product not from pricing or positioning. This is a lesson lost for many.
Developers and regulators might feel Apple's massive power is perhaps too much. In the last decade, the narration around Apple has shifted from Apple being perpetually "doomed" to it being too dominant. Although I'm sure there are some who will try to conflate the two declaring that dominance will inevitably result in doom, most critics of Apple went from laughing (at it) to crying (about its practices).
The argument that Apple should change its practices developed to price as it does, distribute as it does or design as it does because it was too successful or is "unfair" is getting the causality wrong. Dominance won't be altered by a few points of percentage change (on a tiny fraction of ecosystem transactions). Fairness won't be altered when there are thousands of business models and many remain to be invented. Case in point is pornography which is not permitted on the App Store but which exists in abundance thorough other access methods.
The argument is that Apple should be more generous. That it should decrease the "cut" it takes for distribution. Or that it should not enforce revenue split for the customers it exposes to others.
But this is problematic on many levels. The playing field for all developers needs to be level. The customer must be respected and access to that customer should be constrained or certainly metered. Abuses must be policed and that requires leverage.
These practices are inter-dependent and the effect multiplicative, not additive. Apple has a monopoly on iOS and on MacOS and WatchOS and iPadOS. It does this to control the experience, security and safety of the user. It's that control which created the customer in the first place. It should naturally control access to its hard-earned customers.
It does not monetize the distribution of content or apps unless the developer/creator directly charges for the product or service. Distribution is not cost free and to offer it for free is a subsidy which would create additional market and innovation disincentives. The loyalty of Apple users is evidenced by the 600 million paid subscriptions (end of year estimate) that are booked through the App Store. Developers benefit directly as a result.
One could argue that the abundance of services which don't distribute through the App Store is evidence that the system works as intended. Apple's App store front is its property and it reflects its core values.
Being on the shelf in the App Store means you operate on the terms of the shelf owner. If the rules are not agreeable then the half trillion dollars of ecosystem activity is testament to the availability of alternatives.
About a year and a half ago in Lasts Longer I noted that "keeping iPhones in use" became a top priority for Apple's design for sustainability. I considered this provocative because it prioritizes usage and users over units sold, in contrast to how the company was perceived by investors. This new focus was reinforced by the company's dropping of unit shipments data and the addition of Services data including subscriptions count and gross margins.
Apple effectively transformed itself into a services company with customer acquisition, subscriptions (measured by average revenue per user) and retention/satisfaction as key operating metrics. The 1.5 billion active devices and ~1 billion active iPhones and 500 million paid subscriptions are the new data points rather than units sold.
To succeed with this new Lasts Longer strategy, one of the objectives should be that devices become more durable and their durability should in-turn result in more minutes of use and thus more return on initial purchase price. But how can we measure this? We don't have precise data on the use time. We have some anecdotes but no official data. We do know the iOS operating system is now designed to work on older hardware but that does not give us a measure of what is in use.
Luckily we now have an indicator that can help: Bank My Cell published a new data set on various used phone prices. This is a gold mine.
The data consists of prices for about 220 used phone models that changed hands in 2019. The prices are given for the beginning of the year (earliest date when the model was sold) and the end of the year (latest date when the model was sold.)
It's thus possible to see how various models from a number of companies changed in price during the year. The date of initial release of the phones is also given (though initial selling price isn't. It's a bit tricky to determine initial selling price because the model may have been sold for an extended period of time and discounted through that period.)
What we do have allows comparisons between different manufacturers to see, especially for recent (late) models, just how big the drops have been in prices.
I recommend reading the original post to see some of the comparisons between brands. In addition I chose to illustrate some of the differences with the graphs below.
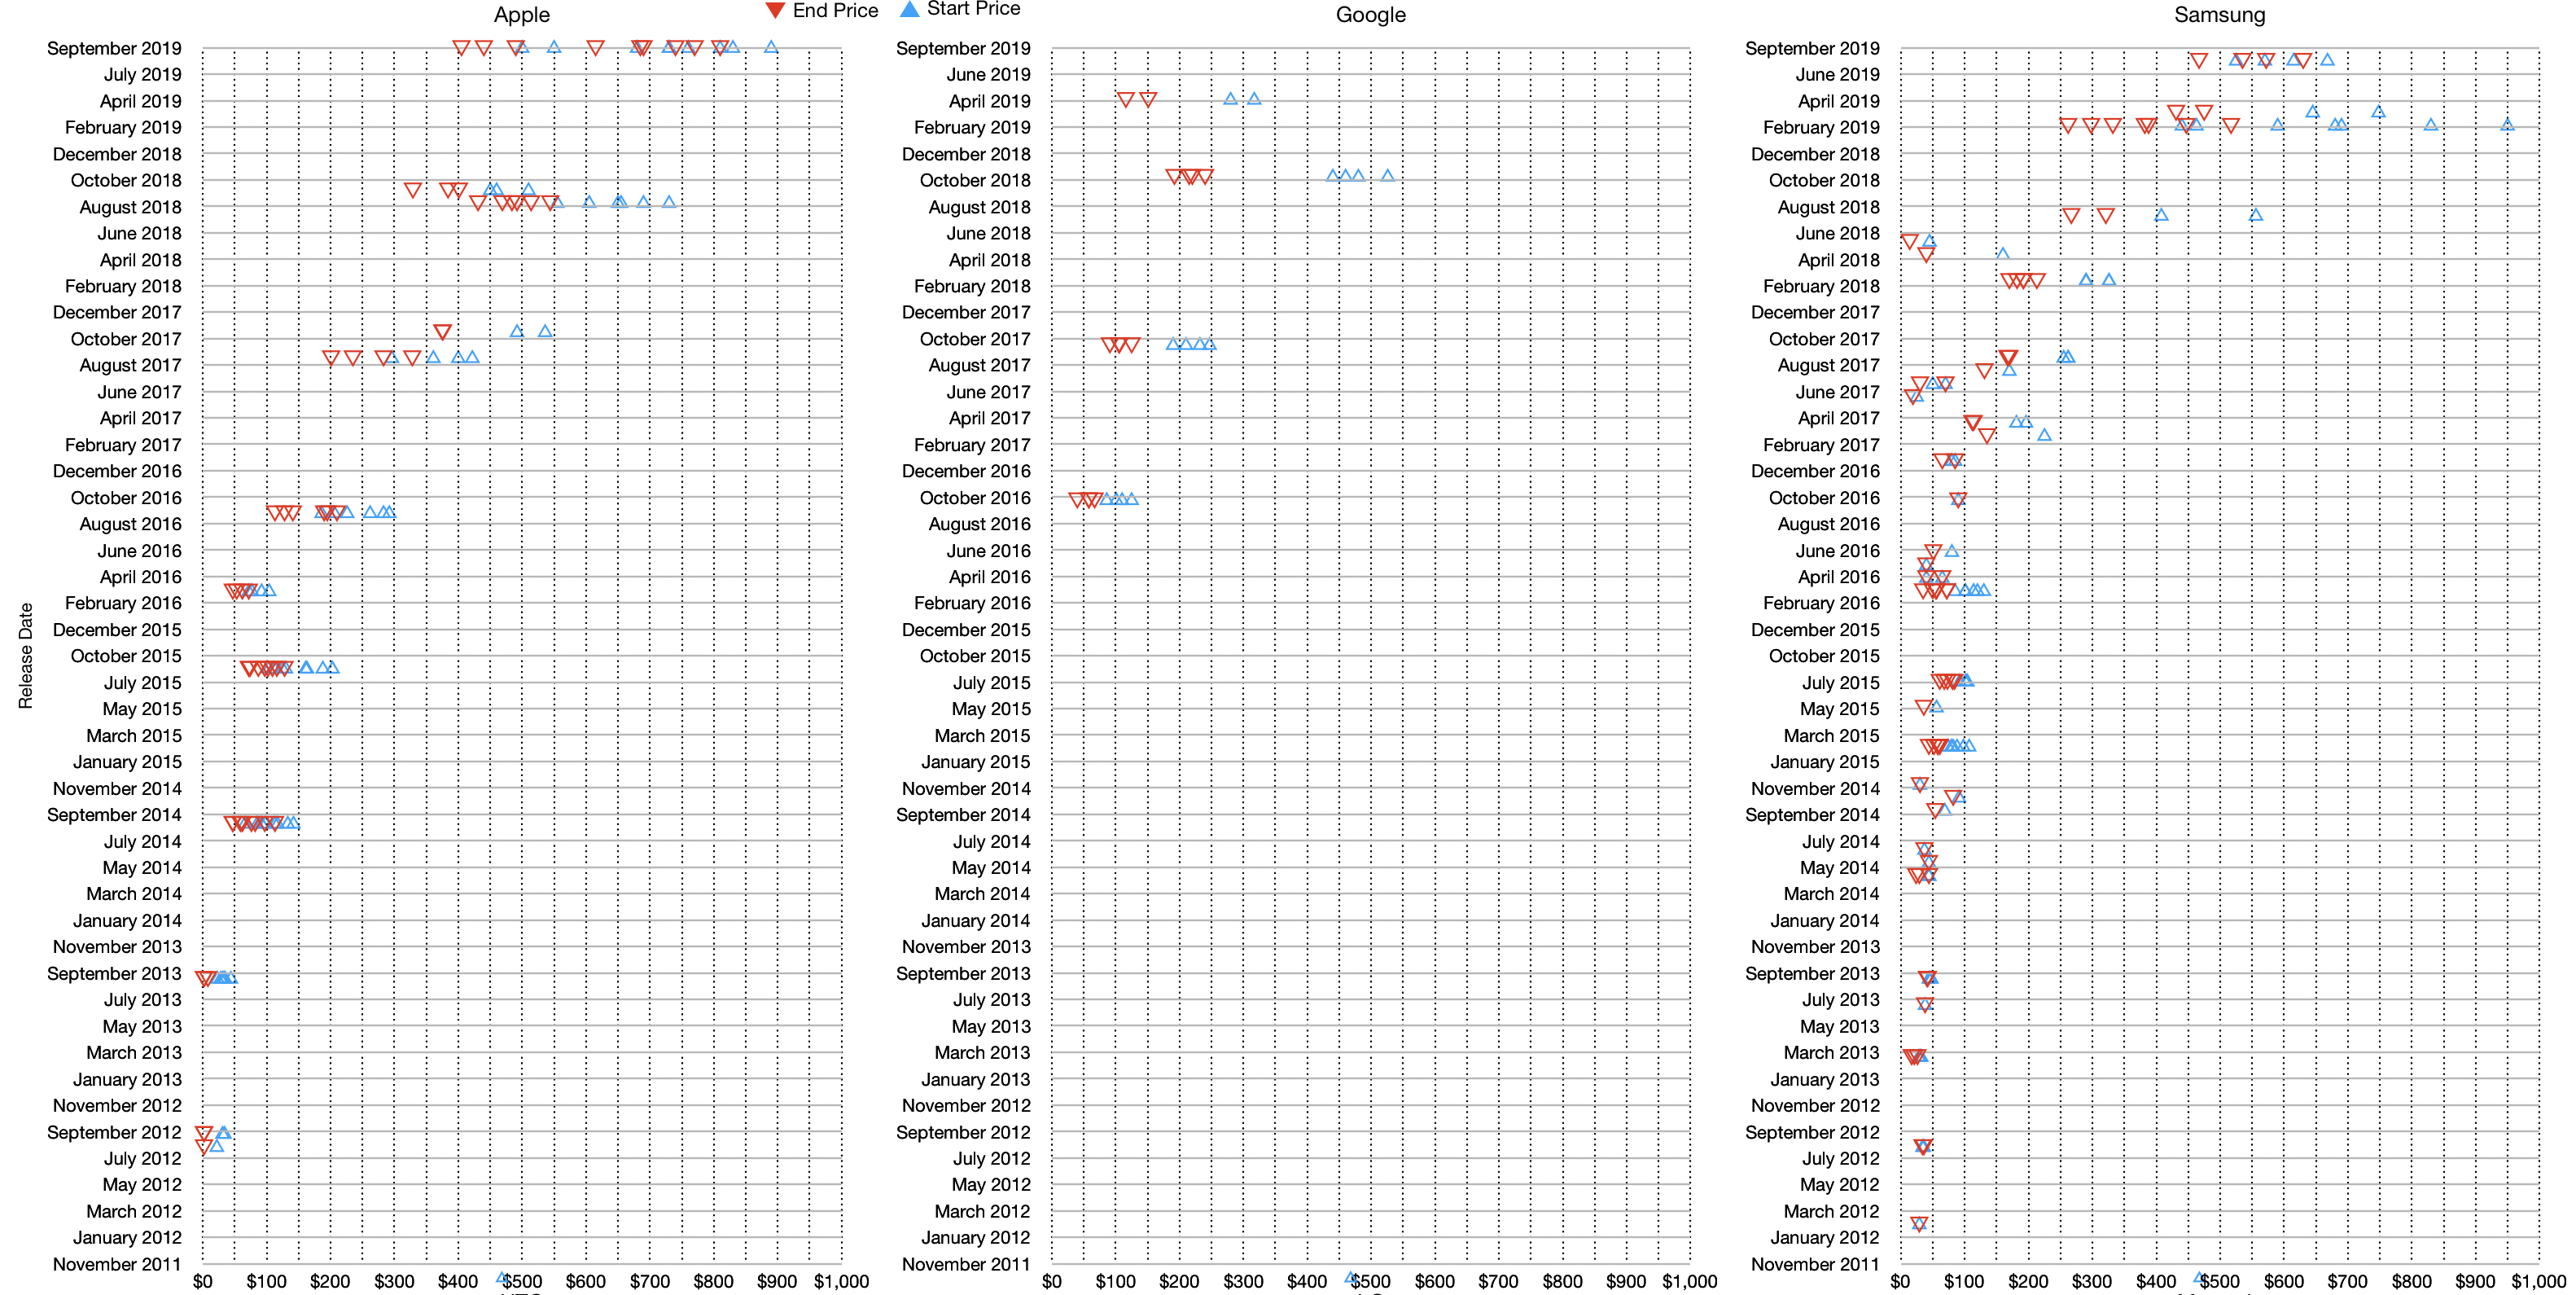
These graphs show phone model prices at the beginning of 2019 (blue) vs. the end of 2019 (red). The models are not individually identifiable but they are shown by the year of introduction. So, in the case of the iPhone, the 2019 cohort (those released around September 2019) are the top line, then the 2018 group is shown in the second line and on down. Thus the oldest iPhones traded during 2019 were iPhones 5, initially released in 2012.
To read the graph, you can scan each line to see the gap between the red and blue triangles to see how much the phones roughly fell in value. The comparison above is between Apple, Google and Samsung.
Here are some patterns I noticed:
Google phones had larger drops during the year than equivalent iPhones. Just how much the drops were is listed by the original post: "Google lost an average of -51.68% between Jan-Dec 2019. The Pixel 3 (2018) was the fastest depreciating and highest value loss at -56.70% (-$267)".
The overall picture of Samsung's phones is hard to discern. Flagship Android phones ($700+) dropped in value roughly twice as fast as Apple's. But the the overall picture is messy. Budget phones are mixed with premium and the average pricing seems to quickly go near zero.
iPhones have a more valuable "mid-range" for models more than 2 years old. Android phones fall hard in the mid range and cluster around zero quickly. This is the heart of the "old but valuable" proposition.
Depreciation rates might seem academic but depreciation is an indicator of a real perception of value and that in itself is a reflection of utility. Users are likely to pay for a used product only if they think it can still be useful in proportion to the price. New product buyers might pay for other things like prestige, status signaling or just wanting to be first. But used buyers are more mindful of what the product can do--they are less likely to benefit from signaling.
Analogously, the used car market often shows the underlying quality or reliability of a car model. If a luxury car plummets in value it means that it becomes a huge burden to late usage, usually due to servicing costs. In previous decades luxury cars were also durable cars but with complexity they became money pits.
In the used phone market hardware repair and maintenance are less consequential but there is a concern for software support, security and privacy. The serviceability of the battery, the camera quality and the fit and finish of the body matter.
Buyers are not stupid. The market speaks words of wisdom. A phone that is worth more will reflect more inherent utility. Remember that a phone is unlocked more than 80 times a day. If it has 4 years of use then it get unlocked 116,000 times. That's not "uses" but unlocks. Actual usage in terms of taps, swipes, or glances could be triple that figure. There are phones on the list that are 7 years old. It's not unreasonable to assume that a moderately well used iPhone has enabled a quarter million interactions.
Remember that phones are used all day, every day. At home and at work. In cars and in planes.
Even on weekends, and on holidays. And even when you're "social distancing".
In fact, the more physically isolated you are the more likely you are to rely on the phone as your social lifeline. In difficult times the product people turn to first and last isn't one of luxury or frivolity. It's a product that keeps you informed, connected, lets you help others and may even keep you alive.
It's in difficult times that the true character of a product shines through. The smartphone, derided, mocked and blamed for all kinds of societal ills is what we turn to first to avoid getting ill.
During 2016 Apple services revenues were $25.6 billion. In January 2017, just after the end of that year, Tim Cook said "We feel great about this momentum, and our goal is to double the size of the services business in the next four years".
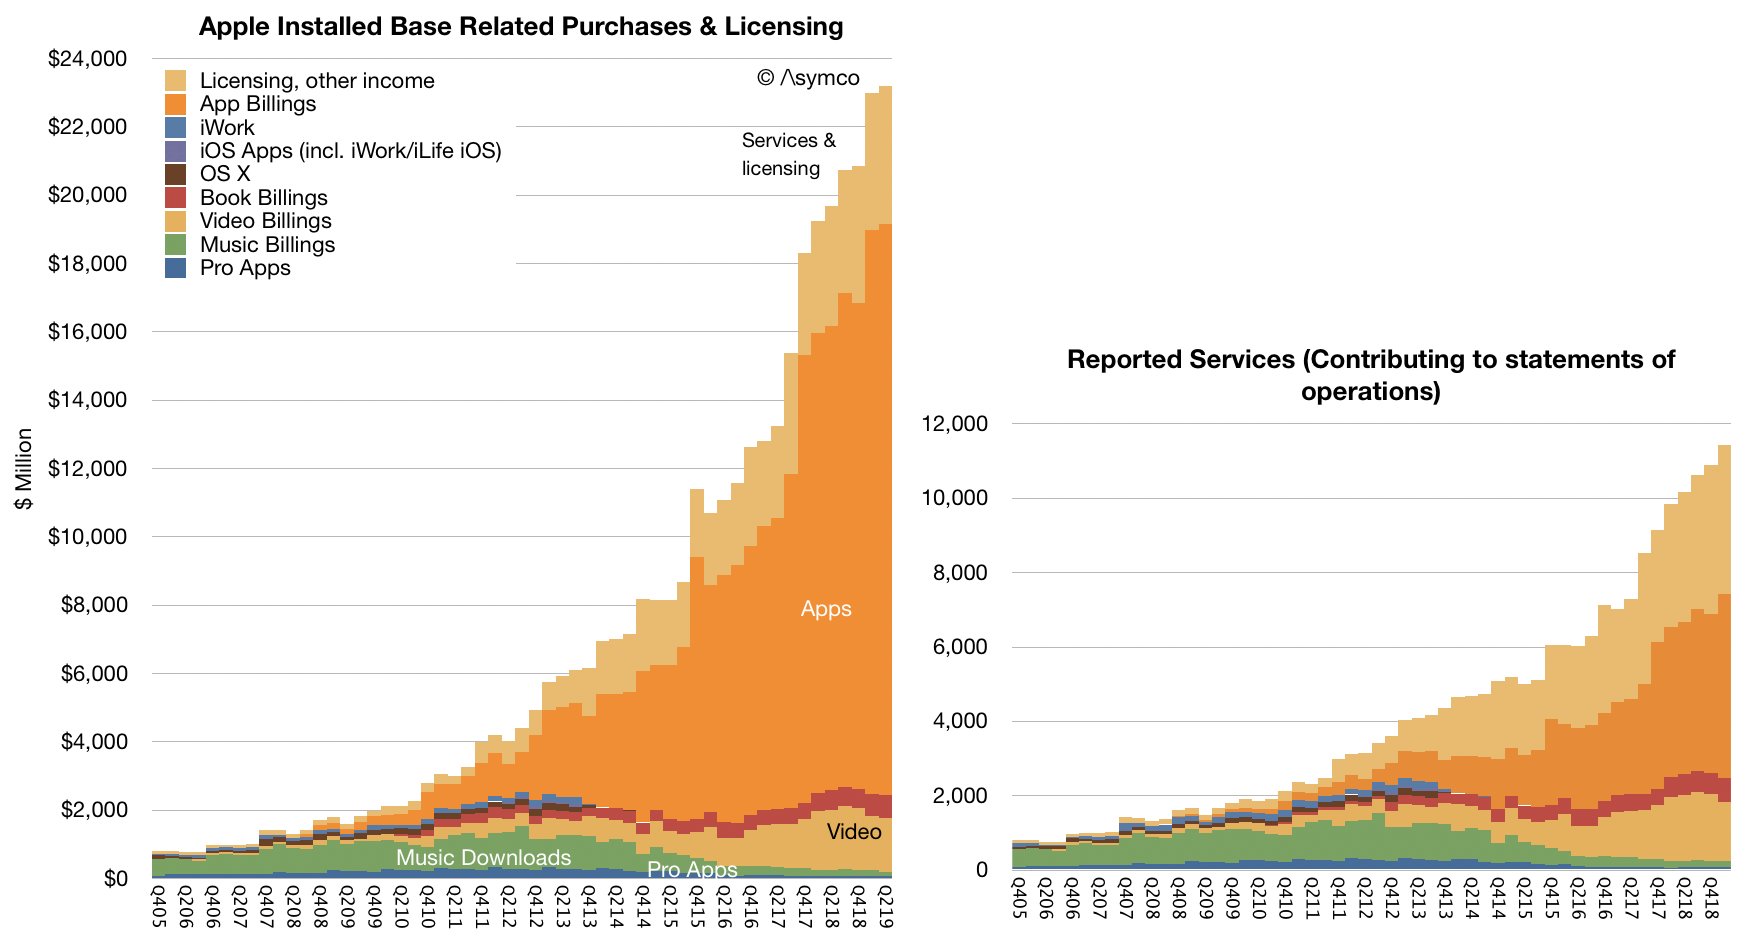
If Apple were to hit that target, during calendar year 2020, Apple's services revenues should exceed $50 billion. In 2017 they were $32 billion, in 2018 they were 41.5 billion and so far this year they are 23 billion. If, as has been the case during 2017 and 2018 (see graphs below,) Apple were to maintain 30% growth in Services during the rest of this year they will have revenues of $51 billion in 2019; reaching the doubling tarted a year sooner than predicted.
Apple will have doubled Services in 3 years to a level equivalent to a Fortune 63 company (right behind Goldman Sachs).
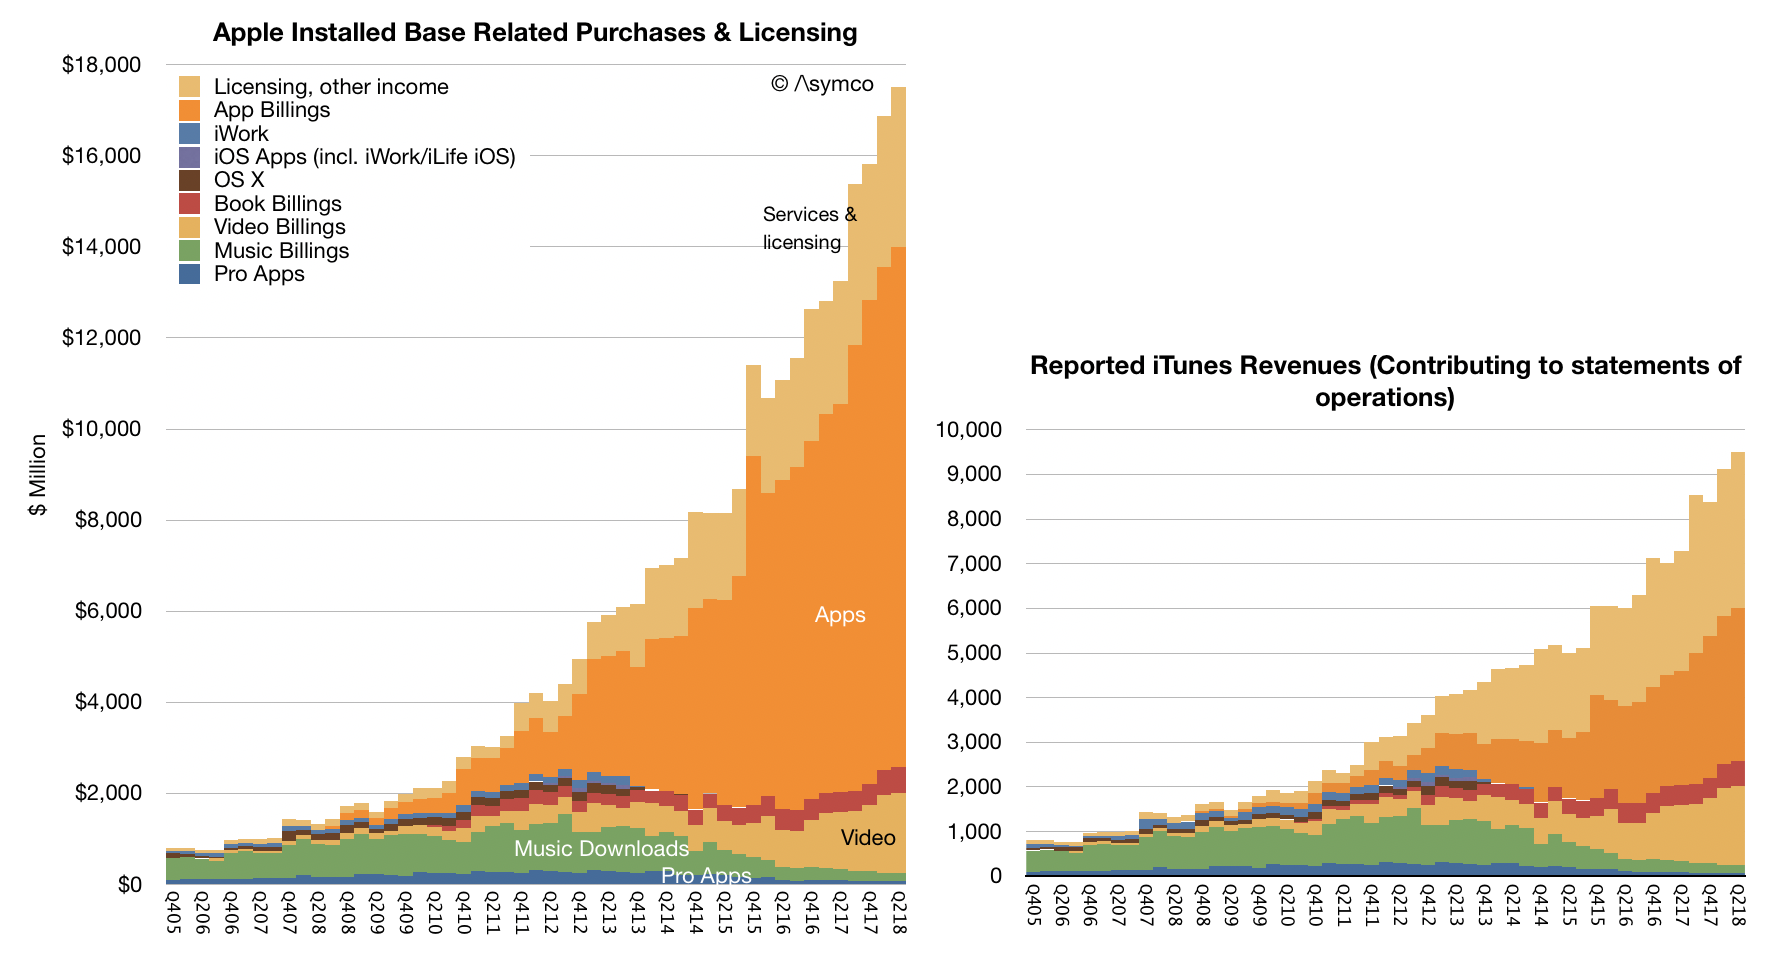
Keep in mind that the reported revenues are not billings or what consumers actually spend. That figure is at a run rate of over $71 billion. You can see the difference between billings and reported revenues in the graphs above.
So what made this possible and what is the source of growth in the future?
As my estimates above show, the growth came from apps and licensing and other revenues. Apps include many third-party subscriptions and licensing includes Google TAC and other income includes Apple's own subscription services and a few additional items like Apple Pay, AppleCare and iCloud.
What Apple is launching this year will boost this even further with TV+, Card, Arcade and News+. These are a new set of specific services that, apart from Card, will require subscriptions and will deliver Apple-specific content. Unlike previous Music and TV offerings, what Apple has embarked on is a high degree of involvement in the content creation process. These will be Apple TV shows, Apple video games and Apple-directed News feeds.
This is quite the watershed moment. Apple, a company dedicated to providing tools to content makers and content consumers, choosing to be involved in the lottery-like game of choosing and backing winners in creative works.
Can a company with good taste about devices and software successfully extend that capability to content? That seems to be the question many are asking: How good is Apple at creating hits? The process of hit creation is difficult but it's not completely random. There are many individuals who have skills or taste. And Apple's approach seems to be to hire people with such skills. These "executives" then proceed to attach people with great track records in hits and who may have the star power to attract audiences. It's not a matter of complete guesswork. It's actually the approach most "streamers" have: They hire studio executives, attach talent to projects and spread bets.
This is why there has been a rush by streamers to secure programs and A-listers. There might be a variety of subscriptions users are likely to pay for but there is a fixed number of bankable names in the business.
But let's pause here to think more deeply about what is happening. Without much notice, we are seeing a content world where distributors are locking up talent and creating a studio model where production, talent and distribution and display are under one roof. This is exactly where the movie industry was in the so-called golden age of Hollywood. The era of the studio system. An era that ended with divorcement—the complete separation of exhibition interests from producer-distributor operations or the forced divestiture of theaters by production/distribution.
Another observation to be made is that the bundling and binding of content into specific distributors creates a walled garden effect. This extends beyond video content to games (a larger business than film, at least at the box office, see below) and to apps. Arcade games are Apple-exclusive. Many apps which depend on Watch, AR and other unique technologies become exclusive, and of course unique titles.
As far as consumers are concerned this might be just fine. There are very implicit lock-in effects of ecosystems, from UX muscle memory, switching costs for data, network effects from friends/family/co-workers in the same system. The extension of this to cultural content, news curation, music curation and privacy curation could be the comfortable default for many.
In this world-view the proposition Apple offers is very attractive. Look at the preference vacationers have toward packaged experiences. Look at the popularity of cruises. Look at the way features are packaged in cars. Look at meal delivery and the packaging of ingredients into something you can cook at home. Look at fitness and the packaging of instruction with the exercise venue. The examples are plentiful.
A garden is lovely after all. The walls are there to keep danger and chaos away as much as to keep you in it. The constraints simplify as much as they restrict. Though it may be contrary to some modular and interoperable utopias which paralyze with choice, we might well be experiencing a triumph of the walled garden.
The iPhone is the most successful product of all time.
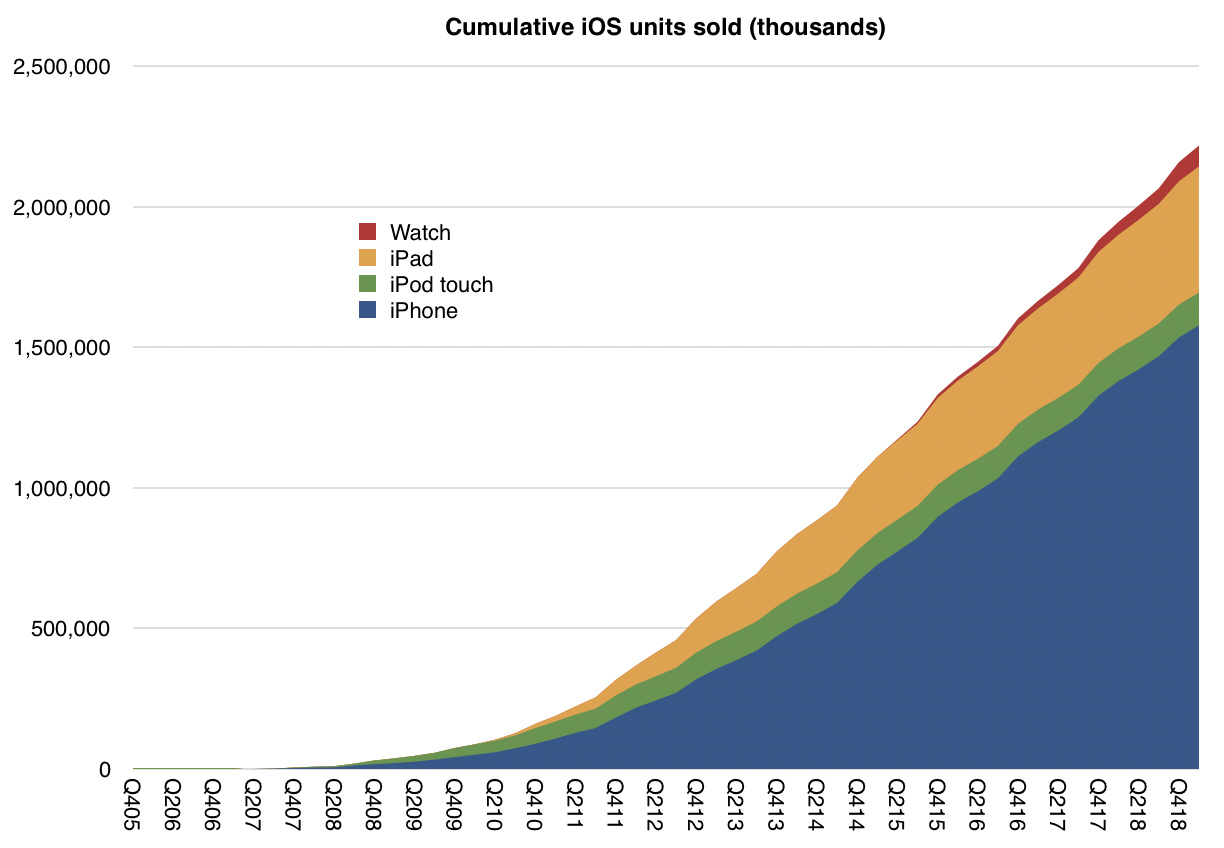
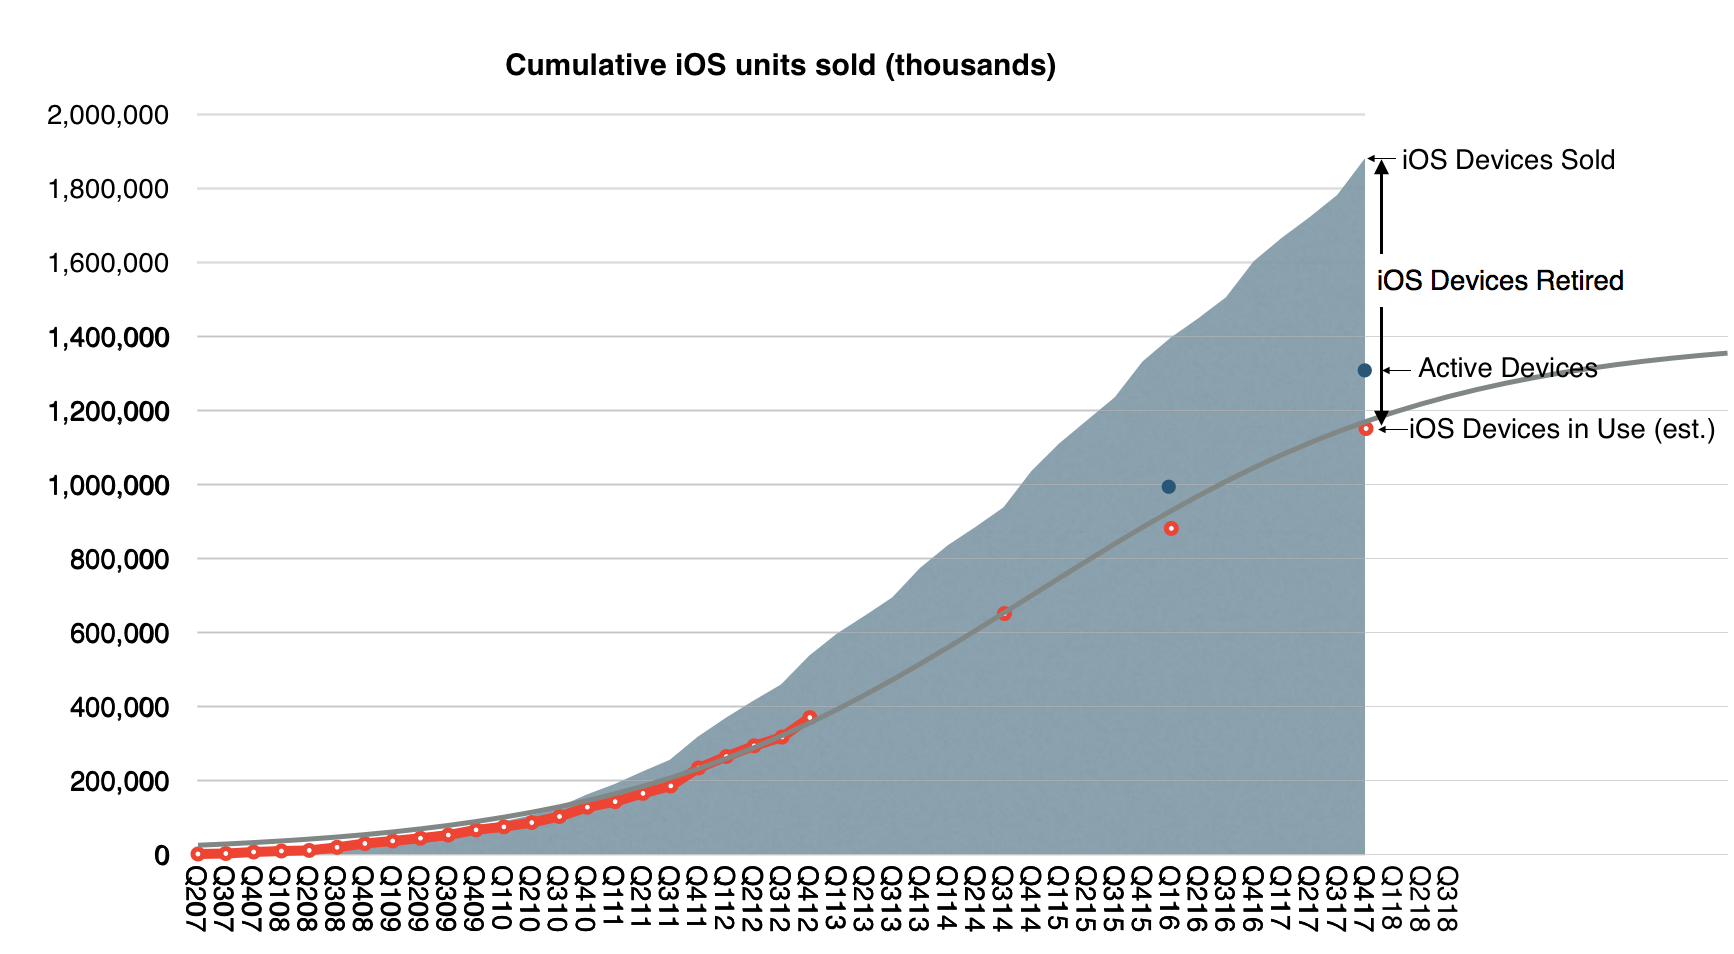
Over 1.6 billion have been sold. Including the iOS products it spun off, the total is over 2.2 billion. Of those 2.2 billion sold, 1.5 billion are still in use.
There are about 1 billion iPhone users.
Economically speaking, iPhone sales have reached one trillion dollars. ((The milestone of $1 trillion iPhone revenues was reached in the fourth quarter 2018 during which time the stock price of Apple fell by 40%.))
Since the iPhone launched, Apple's sales have totaled $1.918 trillion. Of those trillions about one half a trillion was accumulated in the form of income.
Of that half trillion in income, $360 billion was paid out to shareholders ((As a result, the number of outstanding shares has decreased by 29%)). and $131 billion was paid in taxes.
This sounds like a good business, but no business is good if it is static. What makes a business great is dynamism. The idea is to constantly maneuver for a new or enhanced way of doing business as technologies enable entrepreneurs to fundamentally change how value is captured or allocated.
The iPhone story isn't static, the "pivots" or change in direction are several:
The App Store, a platform for collaborative innovation where millions of developers are offered the chance to improve the product.
Accessories, a licensing model for third-party hardware that works with the iPhone
Distribution through multiple channels
Integration with other Apple Products
The marketing of older products alongside new ones at reduced prices
An expanded product portfolio with a broader range of prices
Trade-in and financing options
Each of these initiatives contributed to the iPhone growth story but the biggest change in business model was the addition of services. Apple Services grew out of the iTunes business that pre-dates the iPhone and was established to provide content for the iPod.
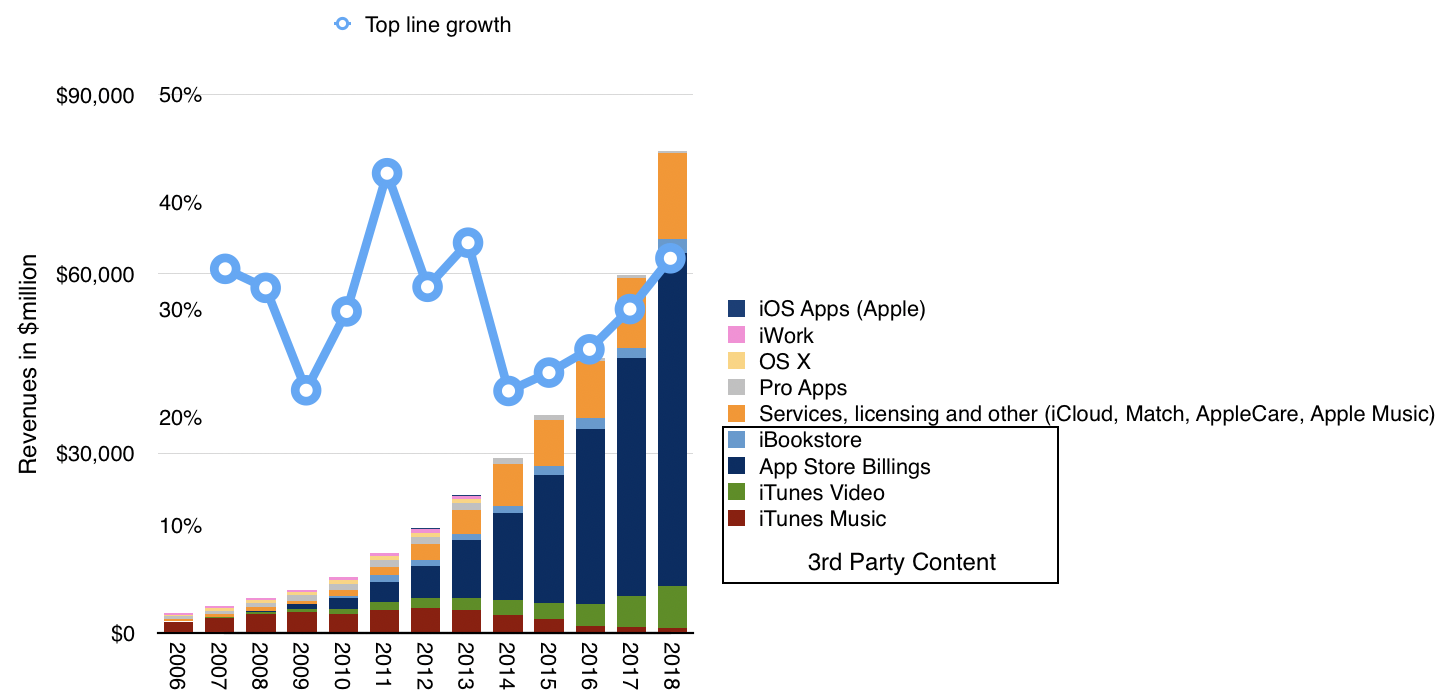
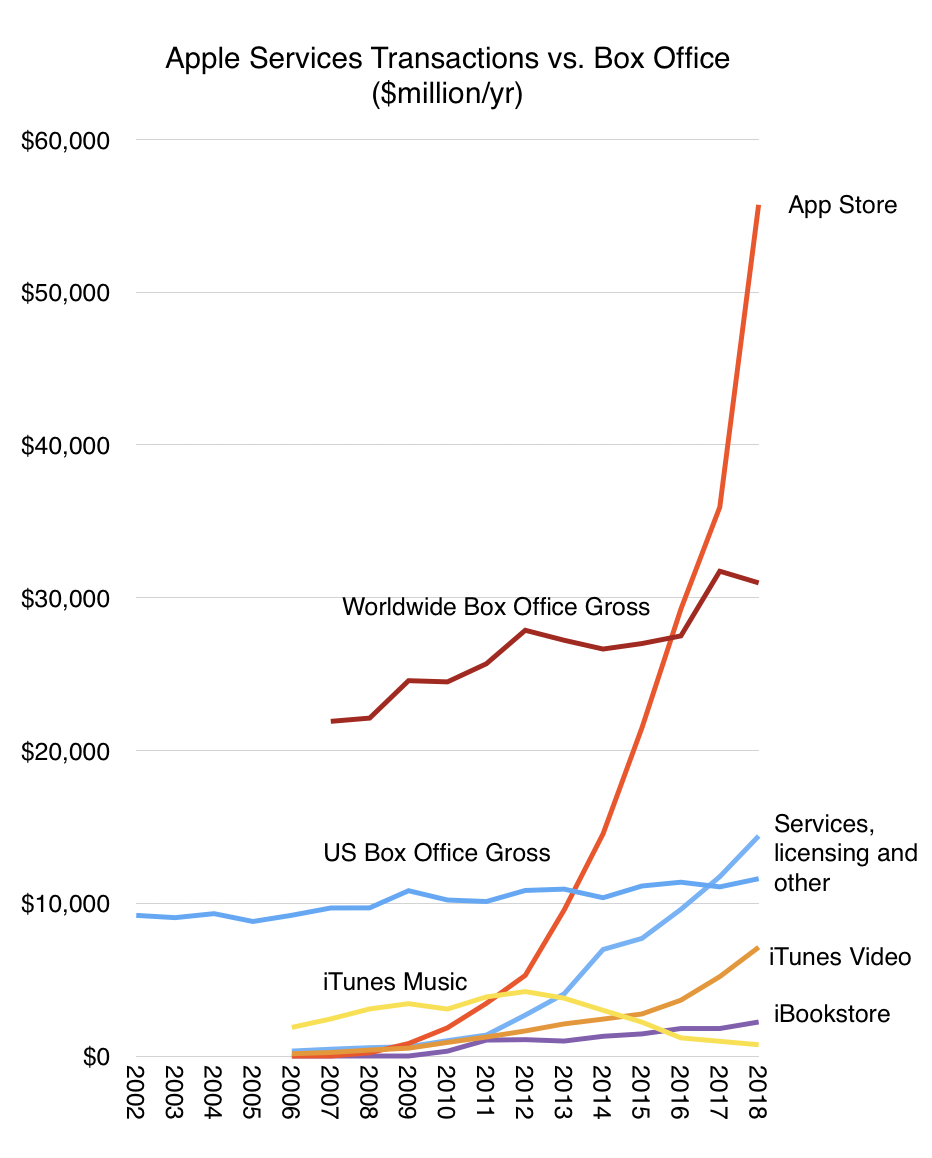
In 2006, the year before the iPhone launched, Apple customers spent $3.3 billion on iTunes, Software and Services. By 2018 the spending rate was $80.5 billion/yr. It's very possible that this year's spending rate will reach $100 billion/yr. This new division is simply called Services today and consists mainly of third-party apps and third-party content sales as well as licensing.
Recently Apple launched a set of new services that it will offer itself. This includes television, films, financial services and news. Apple already has a music service of its own and file storage (iCloud) both of which are offered as subscriptions.
Apps are also allowed to offer paid subscriptions, and that total has reached 390 million, growing at 30 million a quarter with an expected total of 500 million by 2020. That amounts to one subscription for every other iPhone in use.
Some would argue that even with a $43 billion revenue rate, ($80 billion billing rate) ((The difference is in the way Apple accounts for App Store revenues: declaring only the 30% portion of sales that it keeps as revenues, and not including the 70% that is paid out to developers. The "billing rate" is what consumers spend, the "revenue rate" is what Apple reports.)) Apple's business is still a hardware business and that comes with low margins, potential for disruption, non-recurring revenues and cyclicality.
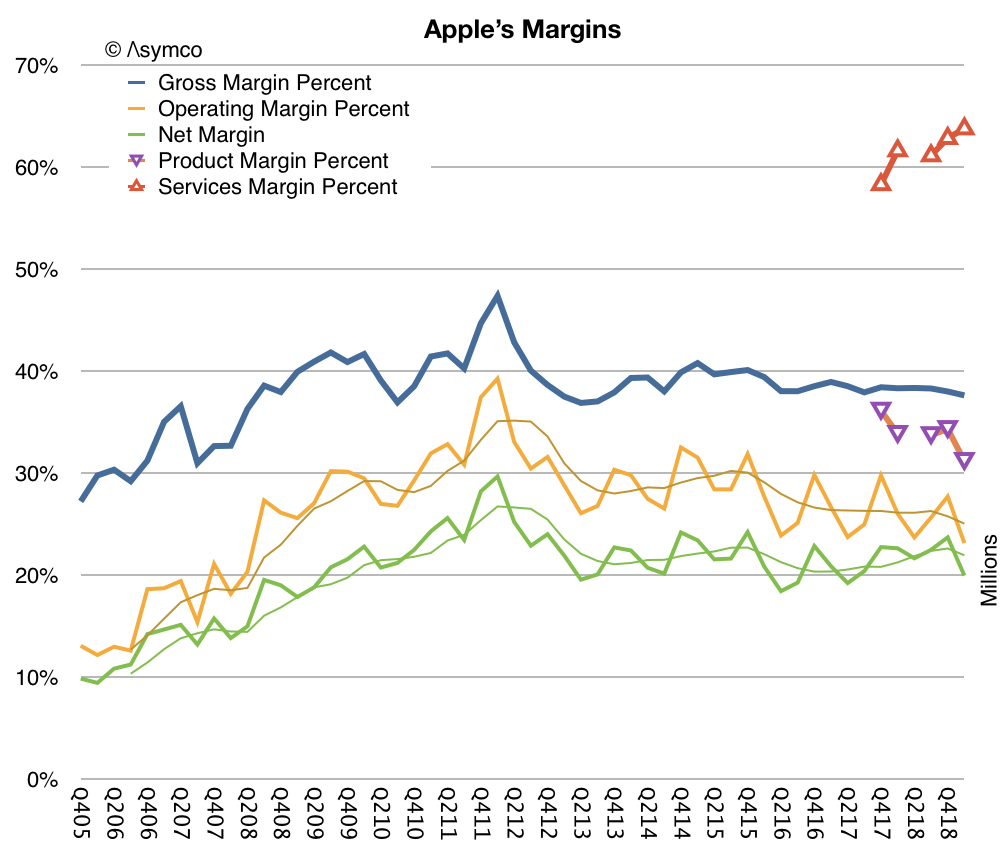
This is not the case. Apples's business has high margins (64% gross margin for services, 34% for products), has been resilient over 12 years while attracting hundreds of imitators at lower price points, and has loyalty and satisfaction which results in more than 90% re-purchase rates. Cyclicality is driven by seasonality and product lifespans, not competition.
This common misconception of Apple is why it continues to be valued at a deep discount to not only peer companies who are services oriented (Google, Facebook, Microsoft and Amazon) but also at a discount to the overall market (the S&P 500).
Apple, since its inception, has always been oriented around its customers, not its products. The questions asked by management are "what can the company do to deliver experiences and satisfaction" rather than "what products can the company build".
Every company is bound by its capabilities but the best companies re-shape these bounds because they are defined by priorities.
A priorities-driven company habitually re-designs its processes and its resources. A resources- or process-driven company re-designs its priorities as its capabilities change.
Moving as it does between computers, devices, software, services, retail, logistics and manufacturing means that it's not classifiable as an "x" company where "x" is an industry sector. Rather, the company should be classified by the set of problems it seeks to solve (e.g. communications, community, productivity, creativity, wellbeing).
This disconnect between what people think Apple sells and what Apple builds is as perplexing as the cognitive disconnect between what companies sell and what customers buy.
Companies sell objects or activities that they can make or engage in but customers buy solutions to problems. It's easy to be fooled that these are interchangeable. ((They are only correlated. Purchase decisions are not *caused* by a product's existence. The real cause is a combination of need and supply and time and circumstance of purchase.))
Conversely Apple offers solutions to problems that are viewed, classified, weighed and measured as objects or activities by external observers. Again, it's easy to be fooled that these are the same.
This analysis is, of course, applicable to any company. Here I'm using Apple as a lens. This is because it's just so much easier to tell this story with the narratives and anti-narratives that are so widely disseminated.
In the latest Apple Earnings report, Apple announced a few details that are relevant to the forecast of the business:
The global active installed base for iPhone reached an all-time high at the end of December, surpassing 900 million devices. This represents growth y-o-y in each of five geographic segments, and growth of almost 75 million in the last 12 months alone
There are now over 360 million paid subscriptions across the Services portfolio, an increase of 120 million versus a year ago. Apple expects to surpass 500 million in 2020.
The installed base grew to 1.4 billion devices by the end of December. This includes all-time highs for each of the main product categories and all five of their geographic segments.
I added all these data points to the previous reported figures related to installed base, subscriptions and Services revenue.
Note that all the data sets show a linear growth path. Most prominent is the paid subscriptions line which is growing at exactly 30 million per quarter. The new projection of 500 million by 2020 is exactly in-line with this projection.
Note also that active devices and iPhones are on similar trajectories. The figure for active iPhones is interesting because it very closely relates to active users. It's extremely likely that 900 million active iPhones means 900 million active iPhone users. An iPhone is useful if it has a data plan associated and it's a costly proposition for most people to have multiple devices and multiple data plans.
This close relationship between iPhone usage and iPhone users means that we can approximate the entire unique user base for Apple. There might be "10s" of millions of users who use Apple devices but don't use iPhones but there might also be multiple iPhones for some users ((I would be inclined to assume that there are more non-iPhone Apple users than multiple iPhone users.))
So it's very likely that the total Apple user base is between 900 and 1 billion. If it's not 1 billion now then it's very likely it will be 1 billion within 12 months.
In May 2010 I made the prediction that Apple would reach a billion users in 5 to 8 years. The prediction was based on the first 100 million iOS users. The company reached one billion active devices in a bit over 5 years and is about to reach 1 billion users 8 years since.
Apple stated in the latest conference call that very little of Services revenues depends on the any previous quarter's unit sales confirming that Services is driven almost entirely from the user base. With almost a billion users, 90+% loyalty rate, 95% satisfaction, 120 million paid subscriptions and 75 million new users/yr, the analysis of Apple as a services company is becoming interesting.
In June of this year Apple reported that it had paid a total of $100 billion to developers. That is the 18th such figure given in the 10 year history of App Store, making the progress of payments and hence revenue and spending easily trackable.
The other regularly reported figure is the business segment revenue where App sales are currently allocated. Now called "Services" this omnibus segment includes many other sources of revenues such as:
Digital Content (Books, Music downloads, Video downloads--including TV shows and movies and movie rentals.)
AppleCare, Apple's extended warranty service.
Apple Pay, transaction fees
Apple Pro Apps, including Final Cut, Logic Pro, Motion, Aperture
Licensing including "Made for iPhone/iPad"
One-time settlements of various lawsuits.
Other Services revenues which include
Apple iCloud-related services
Music Match
Music subscriptions
Other third party subscriptions (commissions)
Third party licenses
This combined Services segment is significant with $35 billion revenues in the last 12 months. This is quite a jump from 2016 when Services had crossed $25 billion. At the end of 2016 Apple said it expected Services revenue to double by 2020. With a growth rate since then of 25% the company is on track to reach its target one year early. ((To calibrate this consider that Facebook revenues for the last 12 months were $48 billion and it now has a market capitalization of $468 billion or 41% that of Apple whereas Services consists of about 14% of Apple's total revenues.))
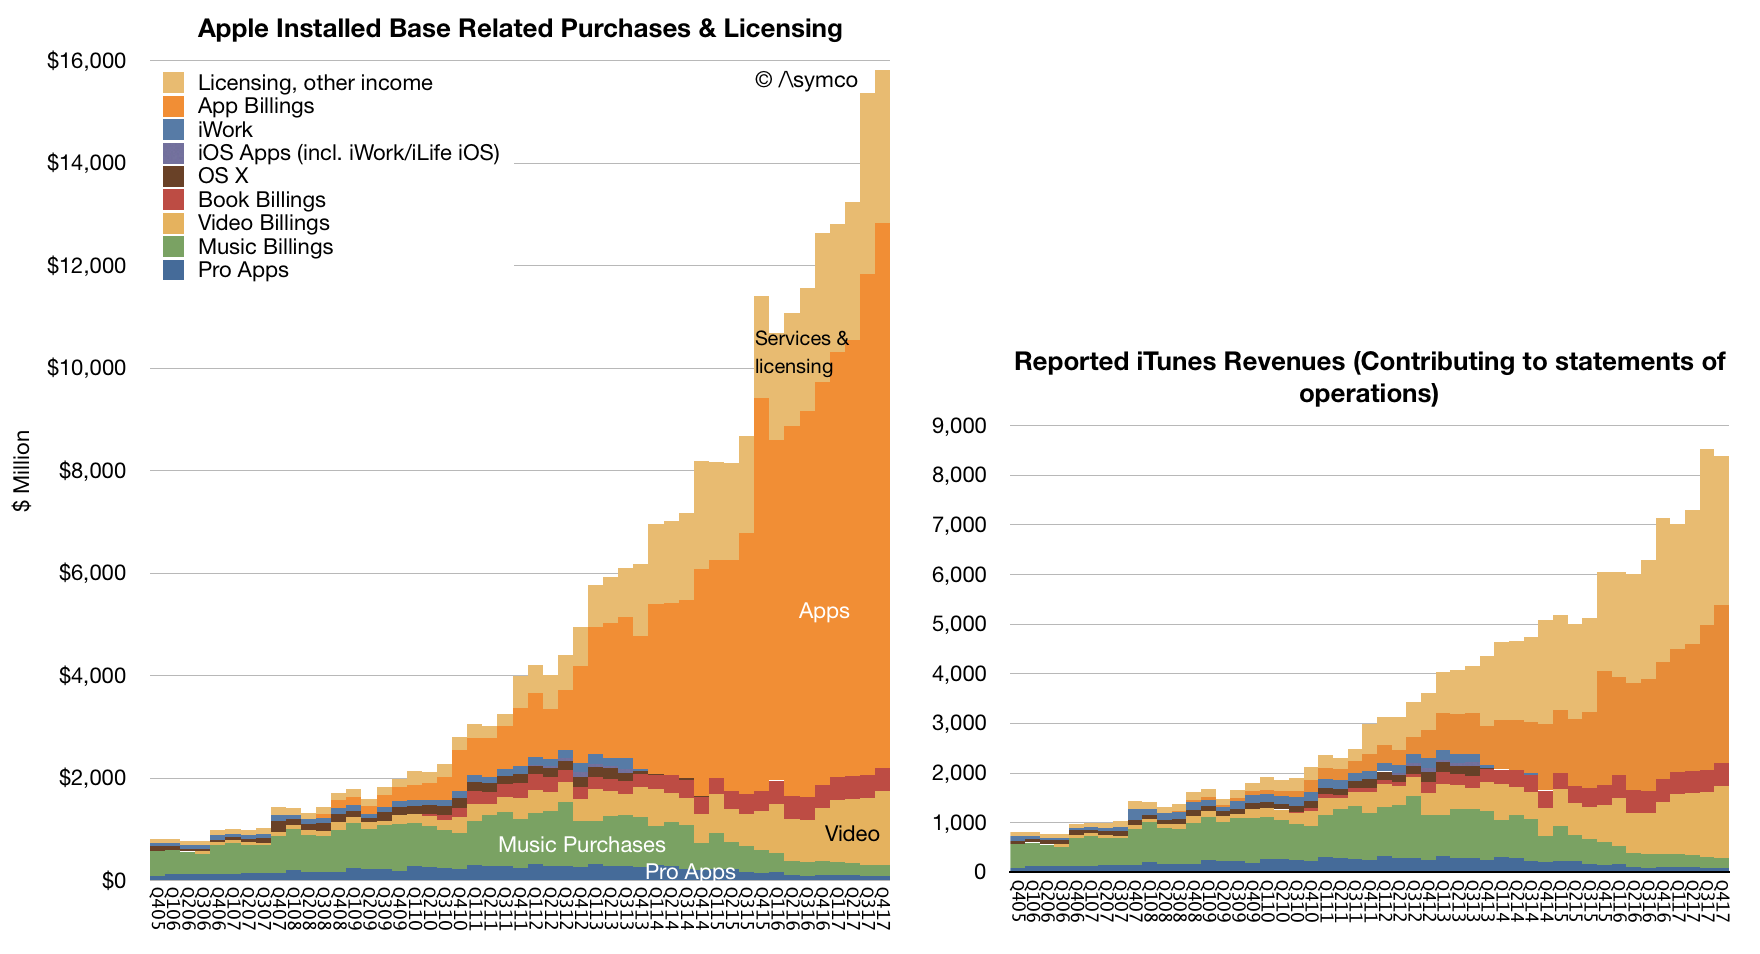
Consumer spending on Apple services includes more than what it books as revenue since only the (typically) 30% of App Revenues is considered Apple's revenue. Including the payments to developers, Services generated over $65.5 billion/yr in billings. This will reach $100 billion/yr in 2 years. The difference between reported revenues and consumer spending is shown in the following graphs.
I described the visibility into App Store revenues (which is the orange area in the graphs above) but the other sub-segments of Services are much more difficult to ascertain. Of special interest is Other Services which includes very high margin services. As part of that there is a peculiar source of revenues: Google.
It's known that Google pays Apple for the default placement of Google search within Safari on iOS and Mac OS. That payment is registered by Google as a "Traffic Acquisition Cost" or TAC. TAC is essentially payment for distribution where what is granted by the distributor is access to queries (traffic.) This way Apple acts as distributor for Google. So, for that matter, does Firefox which also receives TAC payments.
What is peculiar is that the amount of TAC paid by Google to Apple is becoming staggering.
A few years ago Google was paying over 20% of its revenues as TAC. Recently that ratio rose to 23%. Bernstein analyst Toni Sacconaghi estimated that Google paid Apple $1 billion in 2014 as TAC and that payments to Apple were about $3 billion in 2017. Now Goldman Sachs analyst Rod Hall estimates Google could pay Apple $9 billion in 2018, and $12 billion in 2019.
This is starting to look interesting but is it believable?
My own estimate of Apple's Other Services (which includes TAC revenues) is a run rate of $15 billion for calendar 2018. This makes $9 billion (60%) from Google quite challenging but not impossible. The remaining $6 billion needs to account for Apple's own cloud and subscription service revenues.
Does this make sense given Google's spending? TAC payments to distribution partners in Q2 were $3 billion. The $9 billion/yr assumption implies a $2.25B/quarter payment to Apple. That would be 75% of Google's distribution costs. That also sounds reasonable given the high utilization of iOS relative to any other platform.
An increase to $12 billion for next year is also quite a claim but it certainly is possible. I don't have a basis for making this estimate but the assumption of growth leads me to conclude that the payments are tied to actual traffic generated.
In other words the two companies have an agreement that Apple is paid in proportion to the actual query volume generated. This would extend the relationship from one of granting access for a number of users or devices to revenue sharing based on usage or consumption.
Effectively Apple would have "equity" in Google search sharing in the growth as well as decline in search volume.
The idea that Apple receives $1B/month of pure profit from Google may come as a shock. It would amount to 20% of Apple's net income and be an even bigger transfer of value out of Google. The shock comes from considering the previously antagonistic relationship between the companies.
The remarkable story here is how Apple has come to be such a good partner. Both Microsoft and Google now distribute a significant portion of their products through Apple. Apple is also a partner for enterprises such as Salesforce, IBM, and Cisco. In many ways Apple is the quintessential platform company: providing a collaborative environment for competitors as much as for agnostic third parties.
The following is a transcript of the comments from Tim Cook (CEO) and Luca Maestri (CFO) at Apple's Q1 2018 Earnings Conference Call February 1, 2018. I color coded my interpretation of the comments into four categories:
Grey: Background and promotional commentary
Red: Strategy and signals of what management considers important and may include data beyond the regularly reported numbers.
Green: Financial data
Black: Commentary.
Blue: My commentary, in brackets.
For a quick read of Apple's strategy, read the Red text. These comments are not repeated in financial reports. Highly recommended.
For a quick read of Apple's financial performance, read the green text (which are replicated in financial reports). Read this if you don't want to wade through the financial reports.
For marketing or product material, read the grey text.This is sometimes unique but also repeats product launch information.
---- Tim Cook: Thanks, Nancy and thanks everyone on the call, and welcome to everyone today. Before we dive into the quarter, I'd like to take a moment to talk about a significant milestone we recently crossed.
Apple's active installed base reached 1.3 billion devices in January and is at an all-time high for all of our major products. 1.3 billion devices represents an astonishing 30% growth in just two years. It speaks to the strength and reliability of our products and our ecosystem, as well as the loyalty, satisfaction and engagement of our customers. It's also fueling tremendous growth in our services business, which I’ll talk about a little later in the call. [This is probably Apple's most important number. For at least the next 20 years this is the key performance metric and it can be used to derive company's valuation. A summary of the history of active devices vs. units sold is shown in the graph below:]
Turning to the December quarter. We're thrilled to report Apple's biggest quarter ever, which set new all-time records in both revenue and earnings. We generated revenue of $88.3 billion, which is above the high-end of our guidance range, and it is up almost $10 billion or 13% over the previous all-time record we set a year ago.
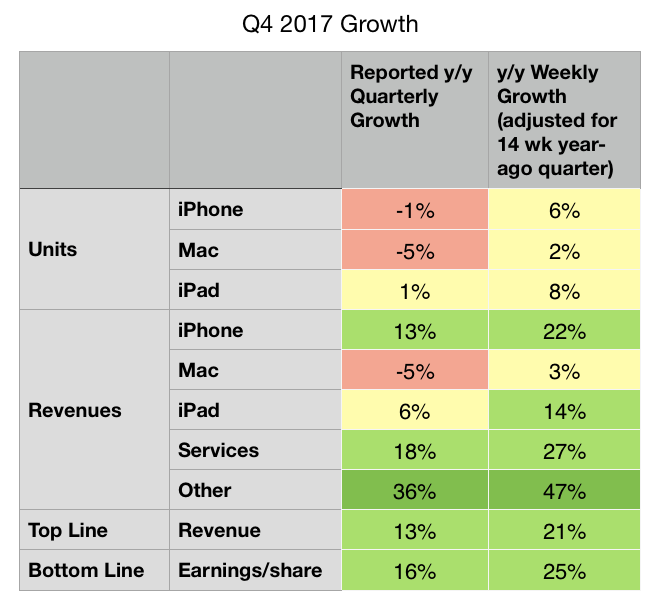
It's also our fifth consecutive quarter of accelerating revenue growth with double digit growth in each of our geographic segments around the world. What makes us even more remarkable is that the quarter we're reporting today was 13-weeks long, while the year ago quarter was 14-weeks. When we look at the average revenue per week in the December quarter this year compared to last year, our growth was a stunning 21%. [The 13-week vs. 14-week year-on-year comparison is repeated several times. The summary differences are shown in the table below:]
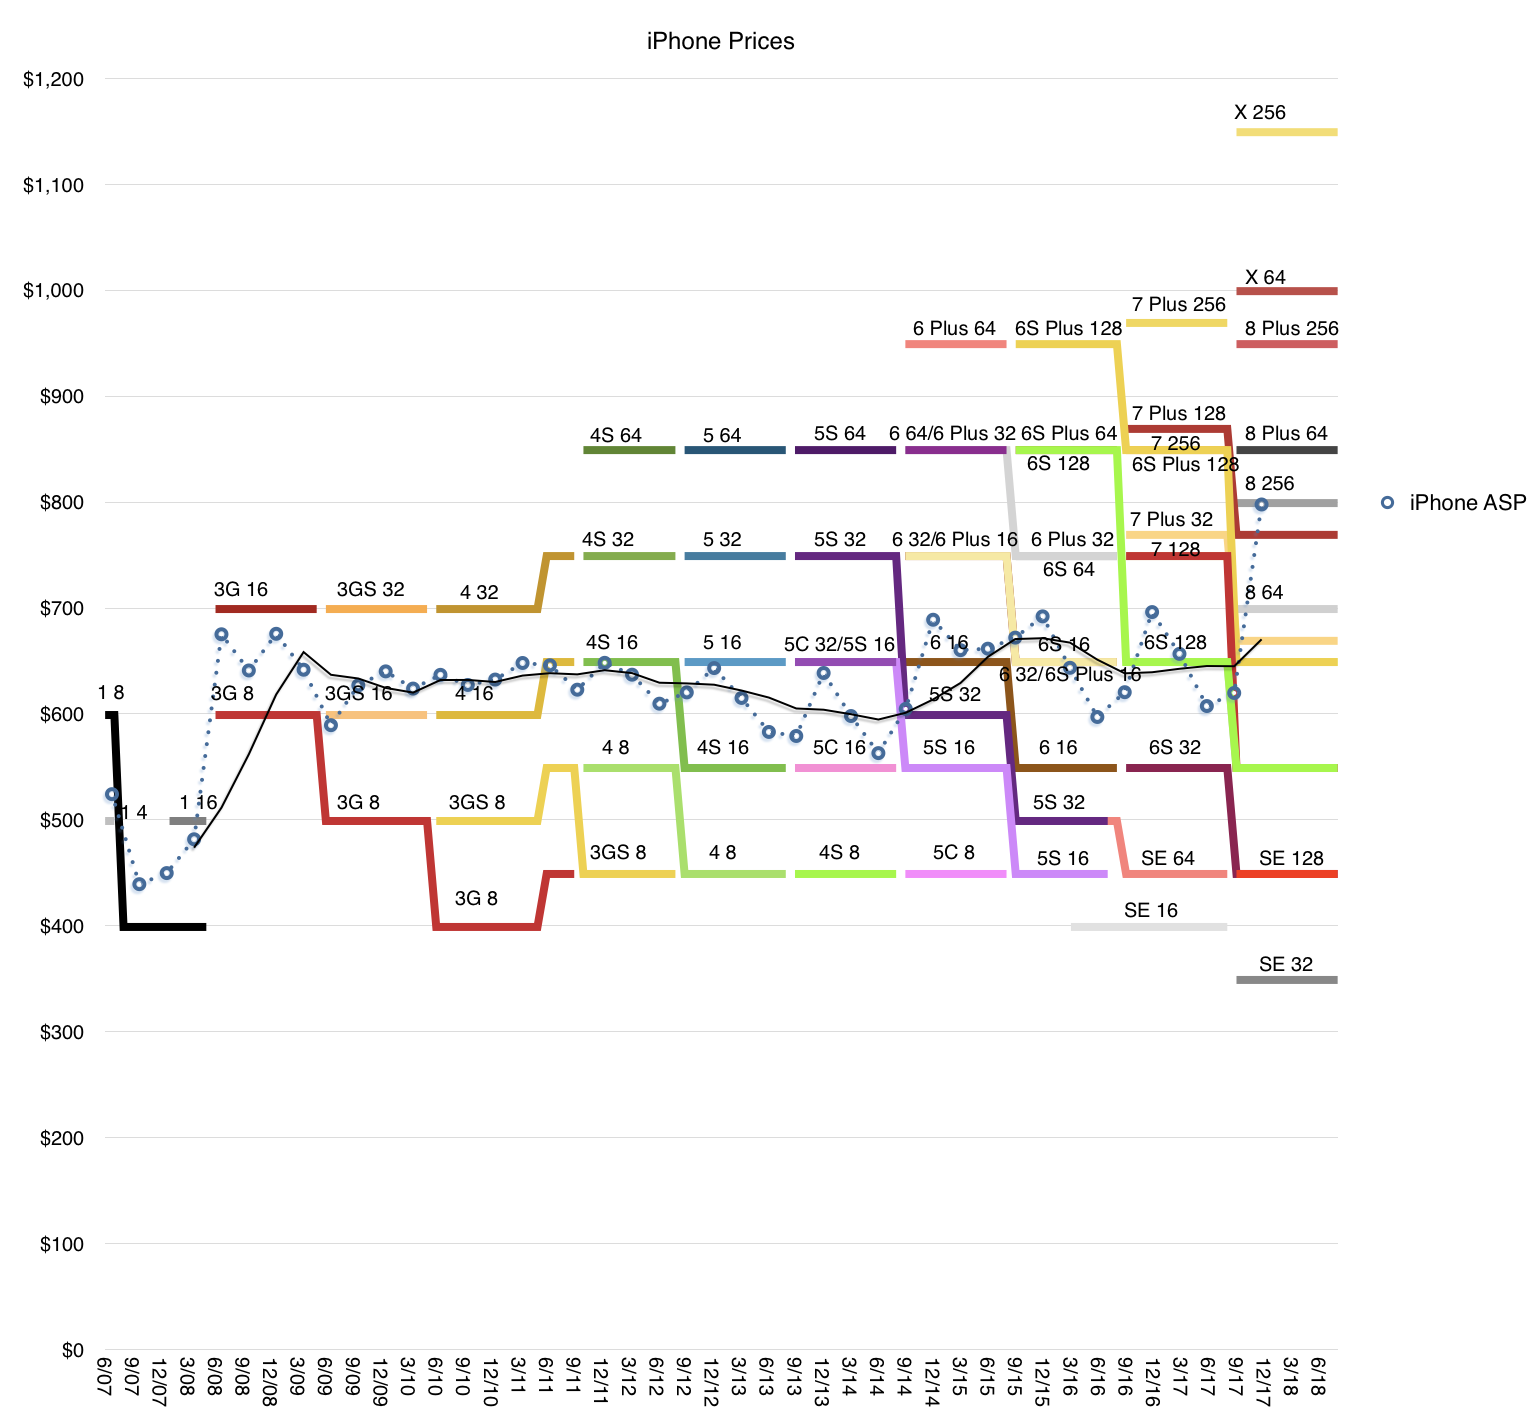
Our growth was broad-based and a key driver was iPhone, which generated its highest revenue ever. iPhone X was the best-selling smartphone in the world in the December quarter according to Canalys, and it has been our top selling phone every week since it launched. iPhone 8 and iPhone 8 Plus rounded out the top three iPhones in the quarter. In fact, revenue for our newly launched iPhones was the highest of any lineup in our history, driving total Apple revenue above our guidance range. [The iPhone X is a huge hit. It drove the average selling price $100 higher y/y. This is not only unprecedented for Apple but for the entire Industry. The average smartphone sells for less than $300 while iPhones sold for $800. The gap is widening. The following graph shows the product mix and the average resulting price.]
I want to take a moment to recognize the tremendous amount of work that went into creating iPhone 10. Our teams carried out an extremely complex launch from both an engineering and operations perspective, executing an outstanding product ramp that required years of research and development; one that introduced innovative features like an edge-to-edge Super Retina Display and the TrueDepth Camera, which enables face ID. Our customers love these new features and the new gestures like simply swiping up from the bottom, which make using iPhone even more intuitive and enjoyable.
Our team has put the technology of tomorrow in our customers’ hands today, set a standard for the next decade of smartphones and we are very proud of their achievements.
It was another very strong quarter for services with revenue of $8.5 billion, up 18% over last year, and we’re on pace to achieve our goal of doubling our 2016 services revenue by 2020. The number of paid subscriptions across our services offerings passed 240 million by the end of the December quarter, that’s an increase of 30 million in the last 90 days alone, which is the largest quarterly growth ever. [Services has been growing relentlessly for over a decade. This steadiness of growth makes is a juggernaut. Apple is increasingly speaking about subscriptions as the key metric and 240 million is reaching record territory. The rise of Services is shown below (both revenues and consumer spending.)]
We had an all-time record quarter for the App Store with our best holiday season ever. We’re seeing great excitement around augmented reality with customers now enjoying over 2,000 ARKit enabled app, spanning every category in the App Store. In December, when Pokémon GO released its new augmented reality features built with ARKit, it jumped the top of the App Store charts. Last week, on a stop in Toronto, I met developers who are hard at work on creative applications using ARKit from art appreciation to ecommerce, and I was very impressed with what I saw.
Just for months after ARKit launched to the public, we’ve already released ARKit 1.5 in beta to developers around the world, and the response has been tremendous. Augmented reality is going to revolutionize many of the experiences we have with mobile devices. And with ARKit, we’re giving developers the most advanced tools on the market to create apps for the most advanced operating system running on the most advanced hardware. This is something only Apple can do.
In addition to the App Store, several other services had their biggest quarter ever, including Apple Music, iCloud and Apple Pay, all of which saw growth in both active users and revenue.
Apple Pay has reached an important milestone in the U.S. As a result of 50% year-over-year growth in merchant adoption, it’s now accepted at more than half of all American retail locations, which includes more than two-thirds of the country’s top 100 retailers. Now available in 20 markets, global Apple Pay purchase volume more than tripled year-over-year and we’re delighted to be expanding to Brazil in the coming months. [There are no absolute data points on Apple Pay but we do have some scattered growth data. The US data is cited here but in my experience it's more popular in select countries like UK where users are using it habitually]
Today, you can use Apple Pay to take the subway in Guangzhou, China, see a concert at London’s Wembley Stadium or buy a souvenir in Yosemite National Park. In the U.S., we launched Apple Pay Cash in December, and it’s off to a terrific start. Millions of people are already using it to send and receive money with friends and family quickly, easily and securely; to split a bill, pay someone back, or send last minute gift right from the messages app.
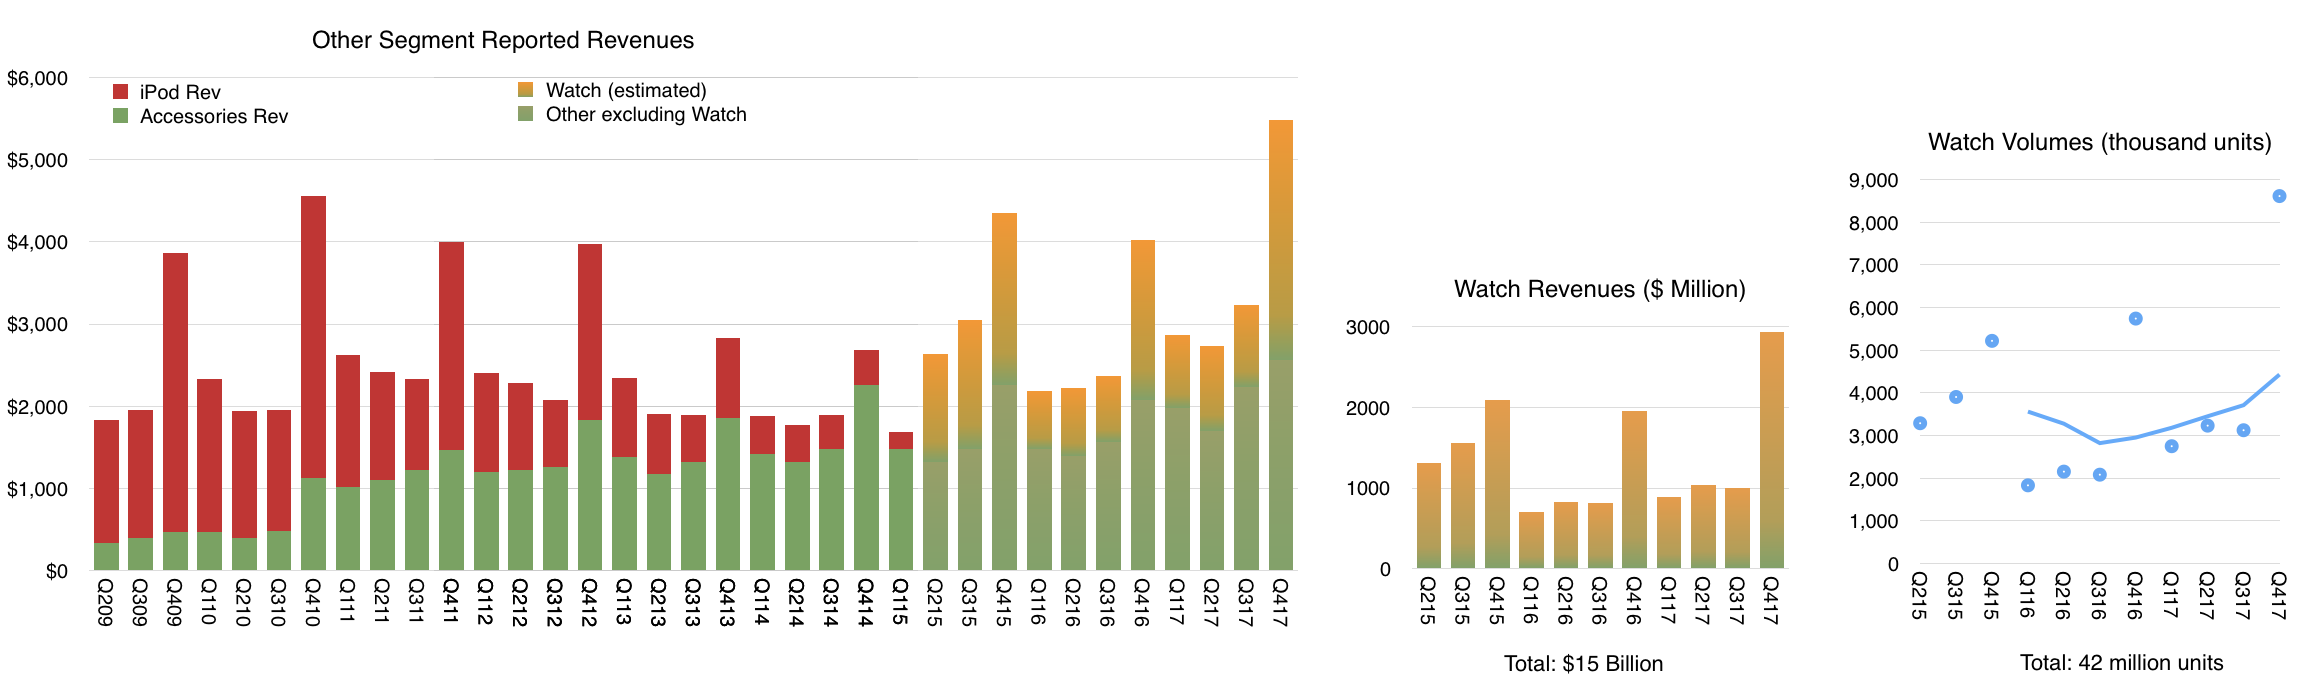
It was our best quarter ever for the Apple Watch with over 50% growth in revenue and units for the fourth quarter in a row and strong double-digit growth in every geographic segment. Sales of Apple Watch Series 3 models were also more than twice the volume of Series 2 a year ago. Apple Watch is the most popular, smart watch in the world and gained market share during the quarter based on the latest estimates from IDC. [Apple Watch is growing consistently. The following graph shows my estimates of volume (total 42 million to date) and revenues (total $15 billion) based on all available data and commentary from management.]
It was the third consecutive quarter of growth for iPad revenue, thanks to the strength of both iPad and iPad Pro. Based on the latest data from IDC, we gained share in nearly every market we track with strong outperformance in emerging markets.
Worldwide, almost half of our iPad sales were the first-time tablet buyers are those switching to Apple, and that’s true in some of our most developed markets, including Japan and France. In China, new and switching users made up over 70% of all iPad sales.
For Mac, we launched the all new, iMac Pro in mid-December. It’s an entirely new product line designed for our Pro users who love the all-in-one design of iMac and require workstation class performance. It's the fastest, most powerful Mac ever, delivering incredible computational power, for simulation and real time 3D rendering, immersive VR and complex photography audio and video projects. Worldwide, 60% of our Mac sales were the first time buyers and switchers and in China, that number was almost 90%.
We're looking forward to getting HomePod in customers’ hands beginning next week. HomePod is an innovative wireless speaker, which delivers stunning audio quality wherever its placed in the home, thanks to the advanced Apple engineered hardware and software.
Together with Apple Music, HomePod gives you instant access to one of the world's largest music catalogs. And with the intelligence of Siri, it’s a powerful assistant you control through natural voice interaction. We're very happy with the initial response from reviewers who've experienced HomePod ahead of its launch, and we think our customers are going to love this new product.
We believe one of the key issues of the 21st century is education. And because of that, we've strengthened our commitment and investment into initiatives like everyone can code. To find the innovators of the future, we need to nurture the students of today. Our App Development with Swift curriculum, which is available free on iBooks, has been downloaded more than 1.2 million times worldwide with almost half of those coming from here in the United States. It’s also being taught in dozens of community colleges across the country, putting practical skills in the hands of today’s jobs seekers.
I was in London two weeks ago as we announced that the program was expanding to more than 70 colleges and universities in Europe. Millions of students around the world will have the opportunity to add Swift to their coding vocabulary and gain skills that are essential for today’s economy.
This is an exciting time at Apple and with the best lineup of products and services we've ever had and a set of initiatives that show how business can be a force for good in the world. We could not be more excited about our future.
Now, for more details on the December quarter results, I'd like to turn over the call to Luca.
Luca Maestri: Thank you, Tim. Good afternoon, everyone. Our business and financial performance in the December quarter were exceptional, as we set new all-time records for revenue, operating income, net income and earnings per share.
Starting with revenue, we’re reporting an all-time record, $88.3 billion, up nearly $10 billion or 13% over the prior record set last year. It is our fifth consecutive quarter of accelerating revenue growth. As you know, the December quarter a year ago spanned 14-weeks compared to 13-weeks this year, which is important to consider as we have set the underlying performance of our business this year. When we look at average revenue per week, our growth rate was even higher at 21% with growth across all product categories for the third consecutive quarter.
Our results were terrific all around the world with double digit revenue growth in all our geographic segments, an all-time quarterly record in the vast majority of markets we track, including the U.S., Western Europe, Japan, Canada, Australia and Korea, as well as Mainland China, Latin America, The Middle East, Central and Eastern Europe, and India.
In Greater China, we were very happy to generate double digit revenue growth for the second quarter in a row and in emerging markets outside of Greater China, we saw 25% year-over-year growth.
Gross margin was 38.4% at the high end of our guidance range. Operating margin was 29.8% of revenue. Our net income was $20.1 billion an all-time record, and up $2.2 billion over the last year. Diluted earnings per share were $3.89 also an all-time record and cash flow from operations was very strong at $28.3 billion.
During the quarter, we sold 77.3 million iPhones, the highest number ever for a 13-week quarter. Average weekly iPhone sales were up 6% compared to December quarter last year with growth in every region of the world despite the staggered launch of iPhone 10. We established all-time iPhone revenue record in nearly every market we track with double-digit growth in all of our geographic segments. iPhone ASP increased to $796 from $695 a year ago, driven primarily by the launch of iPhone 10 and the success of iPhone 8 and 8 Plus.
We exited the December quarter towards the lower end of our target range of five to seven weeks of iPhone channel inventory with less than 1 million more iPhones in the channel compared to the December quarter a year ago, in line with our growth in average weekly unit sales. Customer interest and satisfaction with iPhone are very, very strong for both consumers and business users.
The latest data from 451 Research indicates U.S. customer satisfaction ratings of 96% or higher across iPhone models. In fact, combining iPhone 8, iPhone 8 Plus and iPhone 10, consumers reported an amazing 99% satisfaction rating. And among business customers planning to purchase smartphones in the next quarter, 77% planned to purchase iPhone. Our customers are also incredibly loyal with Kantar's latest U.S. research, reflecting a 96% iPhone loyalty rate, the highest ever measured. [Customer satisfaction is the second most important figure after active user base. Combining these two figures yields the recurring revenue value of the company. Remember what Deming said: the most important measurements for a company's value are the multipliers of a satisfied customer and a dissatisfied customer--these numbers never appear on any financial report but they are applied to all the numbers on every report].
Turning to services. We had a terrific quarter with revenue of $8.5 billion, up 18% year-over-year and up 27% in terms of average revenue per week; that is an acceleration to the 24% services growth run rate that we experienced in the September quarter.
The App Store set a new all-time revenue record. The Store’s all-new design is off to a fantastic start with quarterly store visitors, transacting accounts and paying accounts, reaching new all-time highs. During the week beginning December 24th, a record number of customers made purchases or downloaded Apps from the App Store, spending over $890 million in that seven-day period, followed by $300 million in purchases on New Year’s day alone.
And according to App Annie’s latest report, the App Store continues to be the preferred destination for customer purchases by a very wide margin, generating nearly twice the revenue of Google Play. Across all our services offerings, paid subscriptions reached $240 million with growth of 58% over last year and they were a major contributor to the overall strong growth in services revenue. [Apple has half the user base of Google Android. This is based on Google's May 2017 report of 2 billion active devices vs. the 1.3 billion that we just got from Apple. And yet these users collectively spend twice as much on apps. This ratio of "half the users, twice the spending" has been cropping up in individual developer anecdotes and can also be seen in other metrics of engagement and consumption. This should not be surprising as it conforms to the Pareto distribution of economic value.]
As Tim mentioned, it was our best quarter ever for Apple Watch. And when we add to this us from Beats and AirPods, our total revenue from wearables was up almost 70% year-over-year. In fact, wearables were the second largest contributor to revenue growth after iPhone, which is impressive for a business that started only three years ago. In total, our other products category set a new all-time record with quarterly revenue exceeding $5 billion for the first time. [Wearables now includes more than watches but watches are likely still the dominant product.]
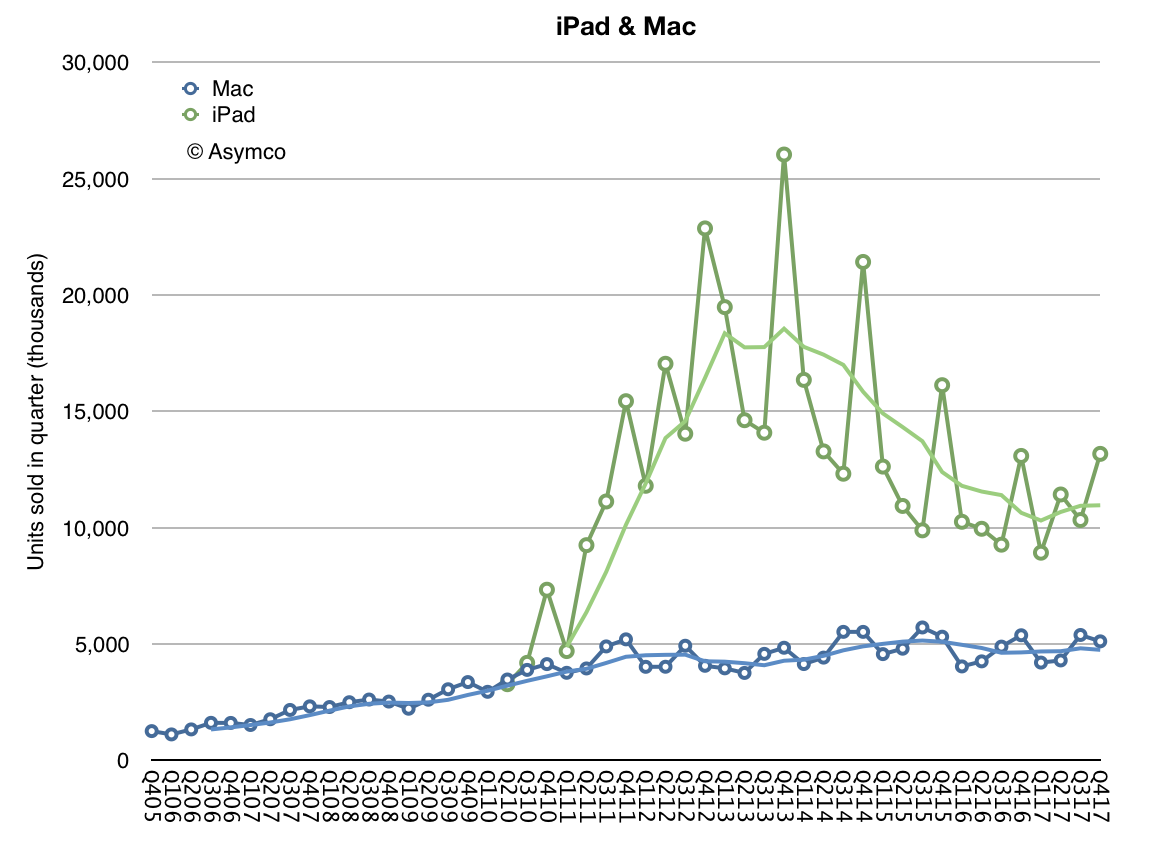
Next, I’d like to talk about the Mac. We sold 5.1 million Macs during the December quarter, which translates to a 2% year-over-year increase in average sales per week. Mac performance was particularly strong in emerging markets with unit sales up 13% year-over-year and with all-time records in Latin America, in India, Turkey and Central and Eastern Europe. On a worldwide basis, the active install base of Macs was up double-digits year-over-year to a new record.
It was also another growth quarter for iPad. We sold 13.2 million units with average iPad sales per week up 8% over last year’s December quarter. iPad sales grew strong double-digits in many emerging markets, including Latin America, the Middle East, Central and Eastern Europe and India, as well as developed markets, including Japan, Australia and Korea. The active install base of iPad has grown every quarter since its launch in 2010, and it reached a new all-time high in December, thanks to extremely high customer loyalty and large numbers of first-time iPad users. [iPad is clearly recovering from a long decline. ASPs are rising as it's being positioned as a PC alternative. Its low end functions are being absorbed by large screen iPhones.]
NPD indicates that iPad had 46% share of the U.S. tablet market in the December quarter, up from 36% share a year ago. And the most recent surveys from 451 Research found that among customers planning to purchase tablets within 90 days, 72% of consumers and 68% of business users planned to purchase iPads. Customer satisfaction is also very high with businesses reporting a 99% satisfaction rating for iPad.
We are seeing great traction in enterprise as businesses across industries and around the world standardize on iOS. For example, Intesa Sanpaolo, one of Europe’s leading banks, has chosen iOS as the mobile standard for its entire 70,000 employee base in Italy; choosing iOS for its security, user interface, accessibility and reliability, Intesa Sanpaolo will deploy native apps to improve employee productivity in customer support, human resources, and marketing across the company.
And LensCrafters, one of the largest optical retail brands in North America, will be using over 7,000 iPad Pros to enable digital eye exams and digital optical measurements in a personalized and interactive experience. We’re also rolling out a new initiative, called Apple AtWork to help businesses implement employee choice programs more easily and offer Apple products company-wide.
Resources from both Apple and our channel partners will enable enterprise IT and procurement teams to buy or lease Apple products more efficiently, streamline the setup of iPhone, iPad, and Mac, and deliver a seamless onboarding experience for employees. We launched the program with CDW in the U.S. last week, and we would be expanding to more channels and regions later this year.
The December quarter was extremely busy for our retail and online stores, which welcomed 538 million visitors. Traffic was particularly strong during the four-weeks following the launch of iPhone 10, up 46% over last year. And across the quarter, our stores conducted over 200,000 today at Apple sessions, covering topics including photography, music, gaming, and app development, and art and design. Just last weekend, we opened our first store in Seoul, Korea and we’re looking forward to opening our first store in Austria in a few weeks. These newest openings will mark the expansion of our retail store presence to 21 countries.
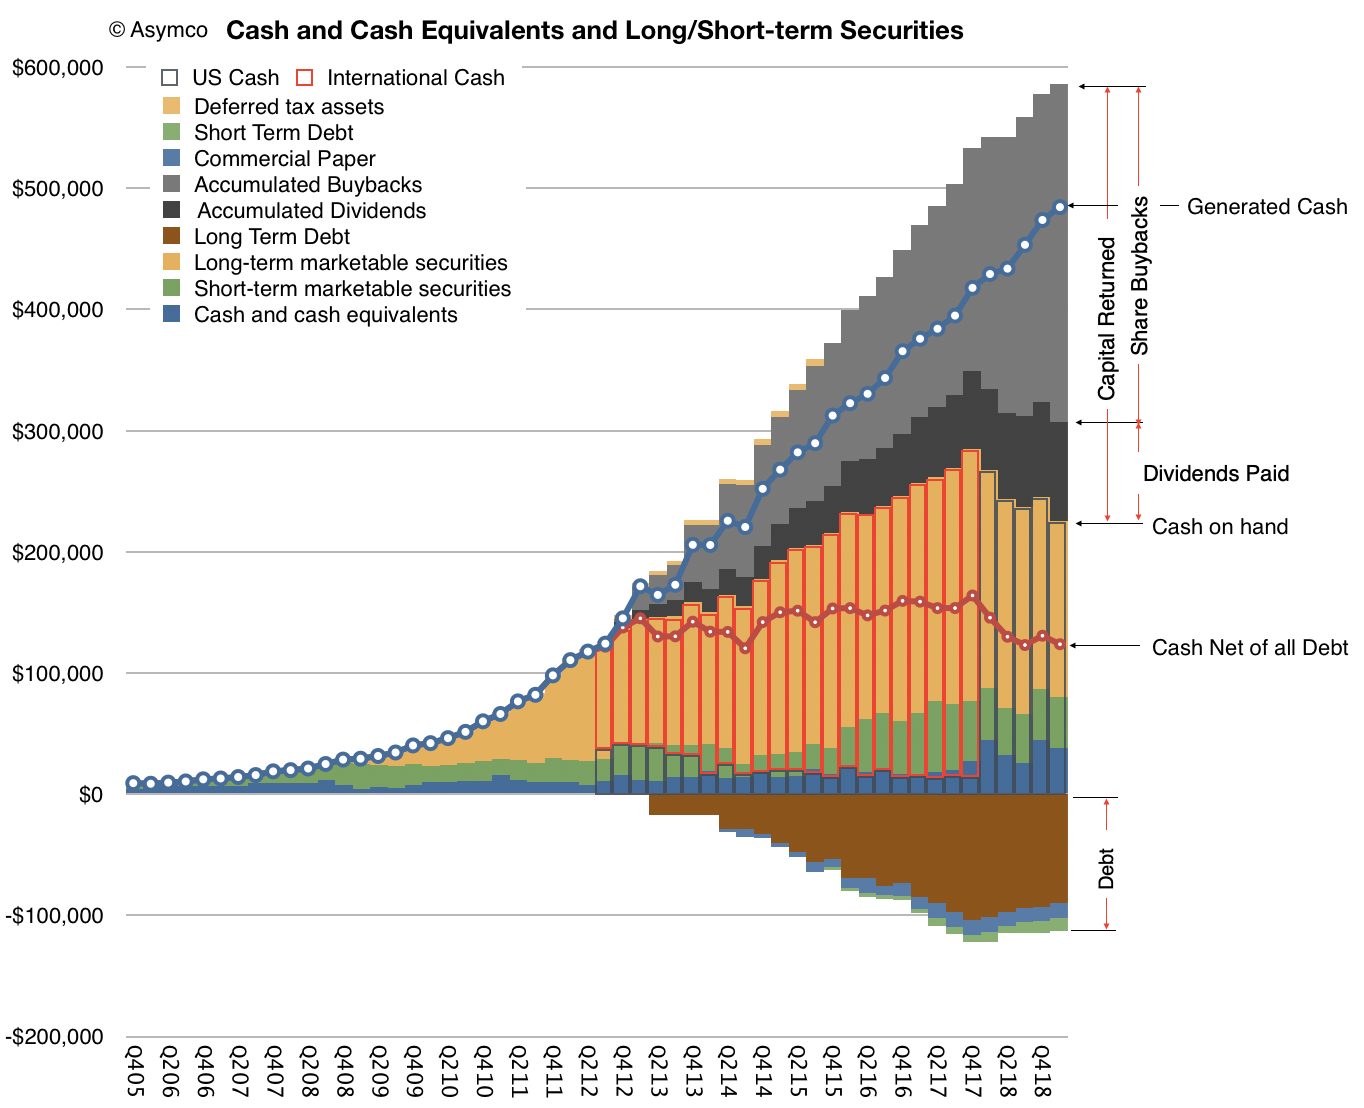
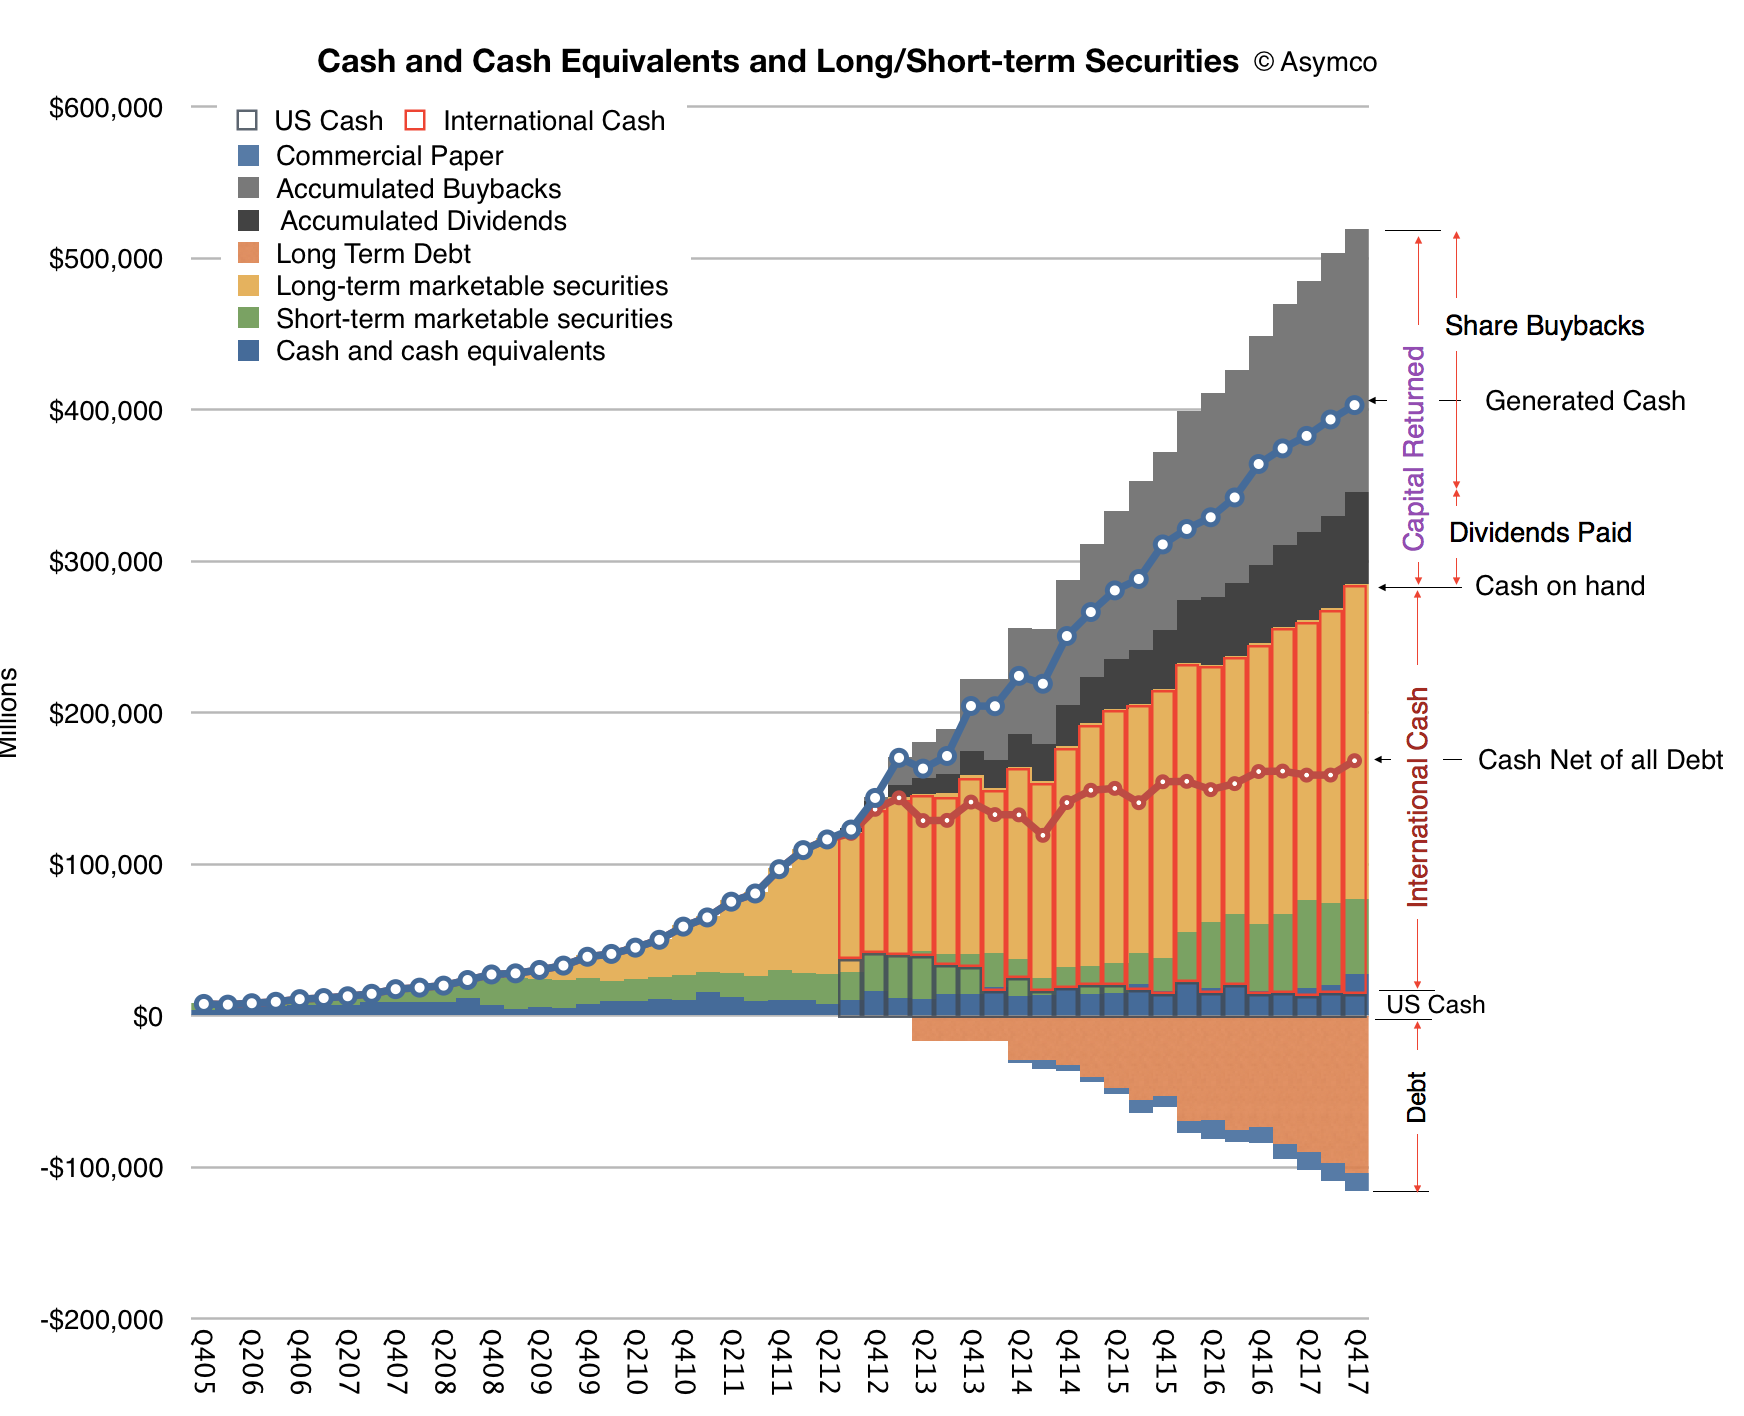
Let me now turn to our cash position. We ended the quarter with $285.1 billion in cash plus marketable securities, a sequential increase of $16.2 billion. $269 billion of this cash, or 94% of the total, was outside the United States. We issued $7 billion in debt during the quarter, bringing us to $110 billion in term-debt and $12 billion in commercial paper outstanding, for a total net cash position of $163 billion at the end of the quarter. We also returned $14.5 billion to investors during the quarter. We paid $3.3 billion in dividends and equivalents, and spent $5.1 billion on repurchases of 30.2 million Apple shares through open market transactions.
We launched a new $5 billion ASR program, resulting in initial delivery and retirement of 23.6 million shares and we retired 3.8 million shares upon the completion of our 12th ASR during the quarter. We’ve now completed over $248 billion of our $300 billion capital return program, including $176 billion in share repurchases against our announced $210 billion buyback program with $34 billion remaining under our current authorization. [An updated look at Apple's cash is shown below]
Turning to taxes. Due to the recently enacted legislation in the U.S., we estimate making a corporate income tax payment of approximately $38 billion to the U.S. government on our cumulative past foreign earnings. This amount is very similar to what we had been accruing on those earnings in our financial results through fiscal year 2017, including the $38 billion payment. We will have paid over $110 billion of corporate income tax on our total domestic and foreign earnings during the last 10 years for a cash tax rate of about 26%. [Apple has paid more tax than any company in history, and is about the make the largest single payment to the US Treasury.]
Our tax rate of 25.8% for the December quarter was close to our guidance of 25.5% as the lower U.S. statutory rate from the new legislation was effective offset by the remeasurement of deferred tax balances.
As we move ahead into the March quarter, I'd like to review our outlook, which includes the types of forward looking information that Nancy referred to at the beginning of the call; we expect revenue to be between $60 billion and $62 billion; we expect gross margin to be between 38% and 38.5%; we expect OpEx to be between $7.6 billion and $7.7 billion; we expect OI&E to be about $300 million; and we expect the tax rate to be about 15%.
Tax reform will allow us to pursue a more optimal capital structure for our company. Our current net cash position is $163 billion. And given the increased financial and operational flexibility from the access to our foreign cash, we are targeting to become approximately net cash neutral overtime. We will provide an update to our specific capital allocation plans when we report results for our second fiscal quarter, consistent with the timing of updates that we have provided in the past.
Finally, today our Board of Directors has declared a cash dividend of $0.63 per share of common stock, payable on February 15, 2018, to shareholders of record as of February 12, 2018.
When Spotify and Pandora were starting their streaming services many were quick to point out that Apple was about to be disrupted. The future, they said, was streaming because (young) people could not be bothered with ownership of music and the limitations of a personal collection. Who would want to pay for a few hundred songs when they could listen to millions for free?
This perception continued and became more vocal over the years. Seven years in fact. Spotify collected 20 million paying subscribers while Apple did nothing. Pandora grabbed 80 million active listeners and possibly 4 million paying subscribers while Apple did nothing. The boat had sailed and Apple was not only not on it but oblivious that there was a boat in the first place.
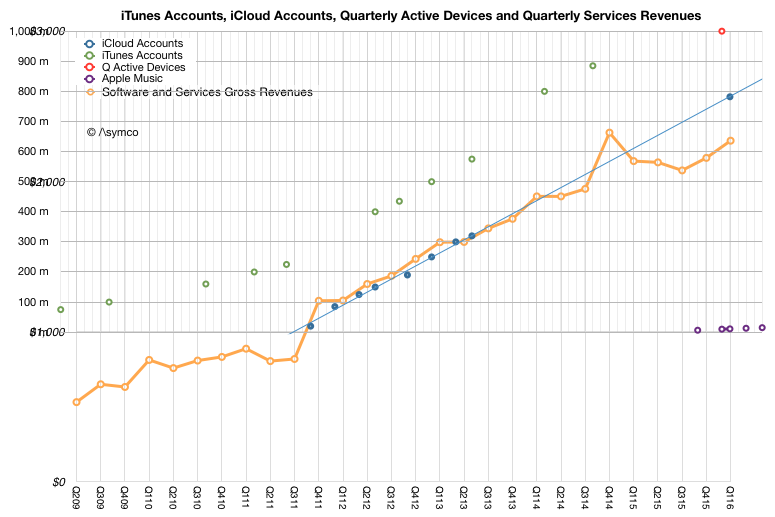
At first Apple launched a half-hearted streaming service and then a paid service finally showed up with Apple Music in mid 2015. Since then the company managed to add 15 million subscribers. A tiny number compared to the 900 million iTunes accounts it had reported a year earlier. Pathetic. The number of music subscriptions relative to iCloud accounts, iTunes accounts and active devices is shown the the graph below.
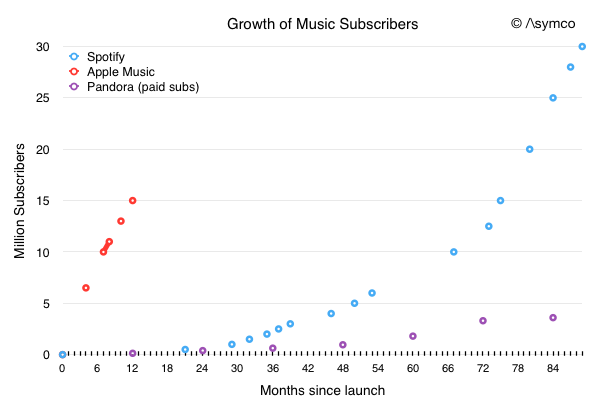
It may be paltry compared to the count of users Apple may have in total, but how does a 15 million user base in 1 year compare with the growth rate for the incumbents Spotify and Pandora?
The following graph shows the ramps for Spotify, Pandora and Apple Music since their moments of market entry. The accumulation of users by Apple looks to be the fastest yet.
This is, of course, due to a maturing use case. Apple did not have to educate people to the notion of music as a subscription. It could just announce it and users would discover it and just sign up, especially if they were already iCloud subscribers and had a credit card attached to their iTunes account.
But that's the whole point. Apple did not have to move first in music subscriptions. It did not even have to move second or third. When it did move it could just skim the market and add to its already healthy Services revenue (orange line in the first graph above.) Missing the boat in music in this case meant capturing all the value quickly and with minimal expense.
Fundamentally, Apple's entry into music subscriptions was a sustaining effort. Streaming sustained Apple rather than disrupting it. The difference may seem merely one of semantics, but it is also the difference between life and death for a challenger. Meaning matters.
This is a cautionary tale for those who would pronounce every new idea as "disruptive" to Apple or anyone else on the basis of novelty alone. The tests for disruptiveness are easy enough and it behooves the analyst to apply them before dropping the d-bomb.
Paying for TV has been a curious consumer phenomenon. There was a time when TV was free to consumers. It was delivered as a broadcast over-the-air and paid for either by commercials (US mostly) or by taxes on viewers (Europe mostly). The consumers were delighted with the idea as it was far better than radio and radio was delightful because it was far better than no radio.
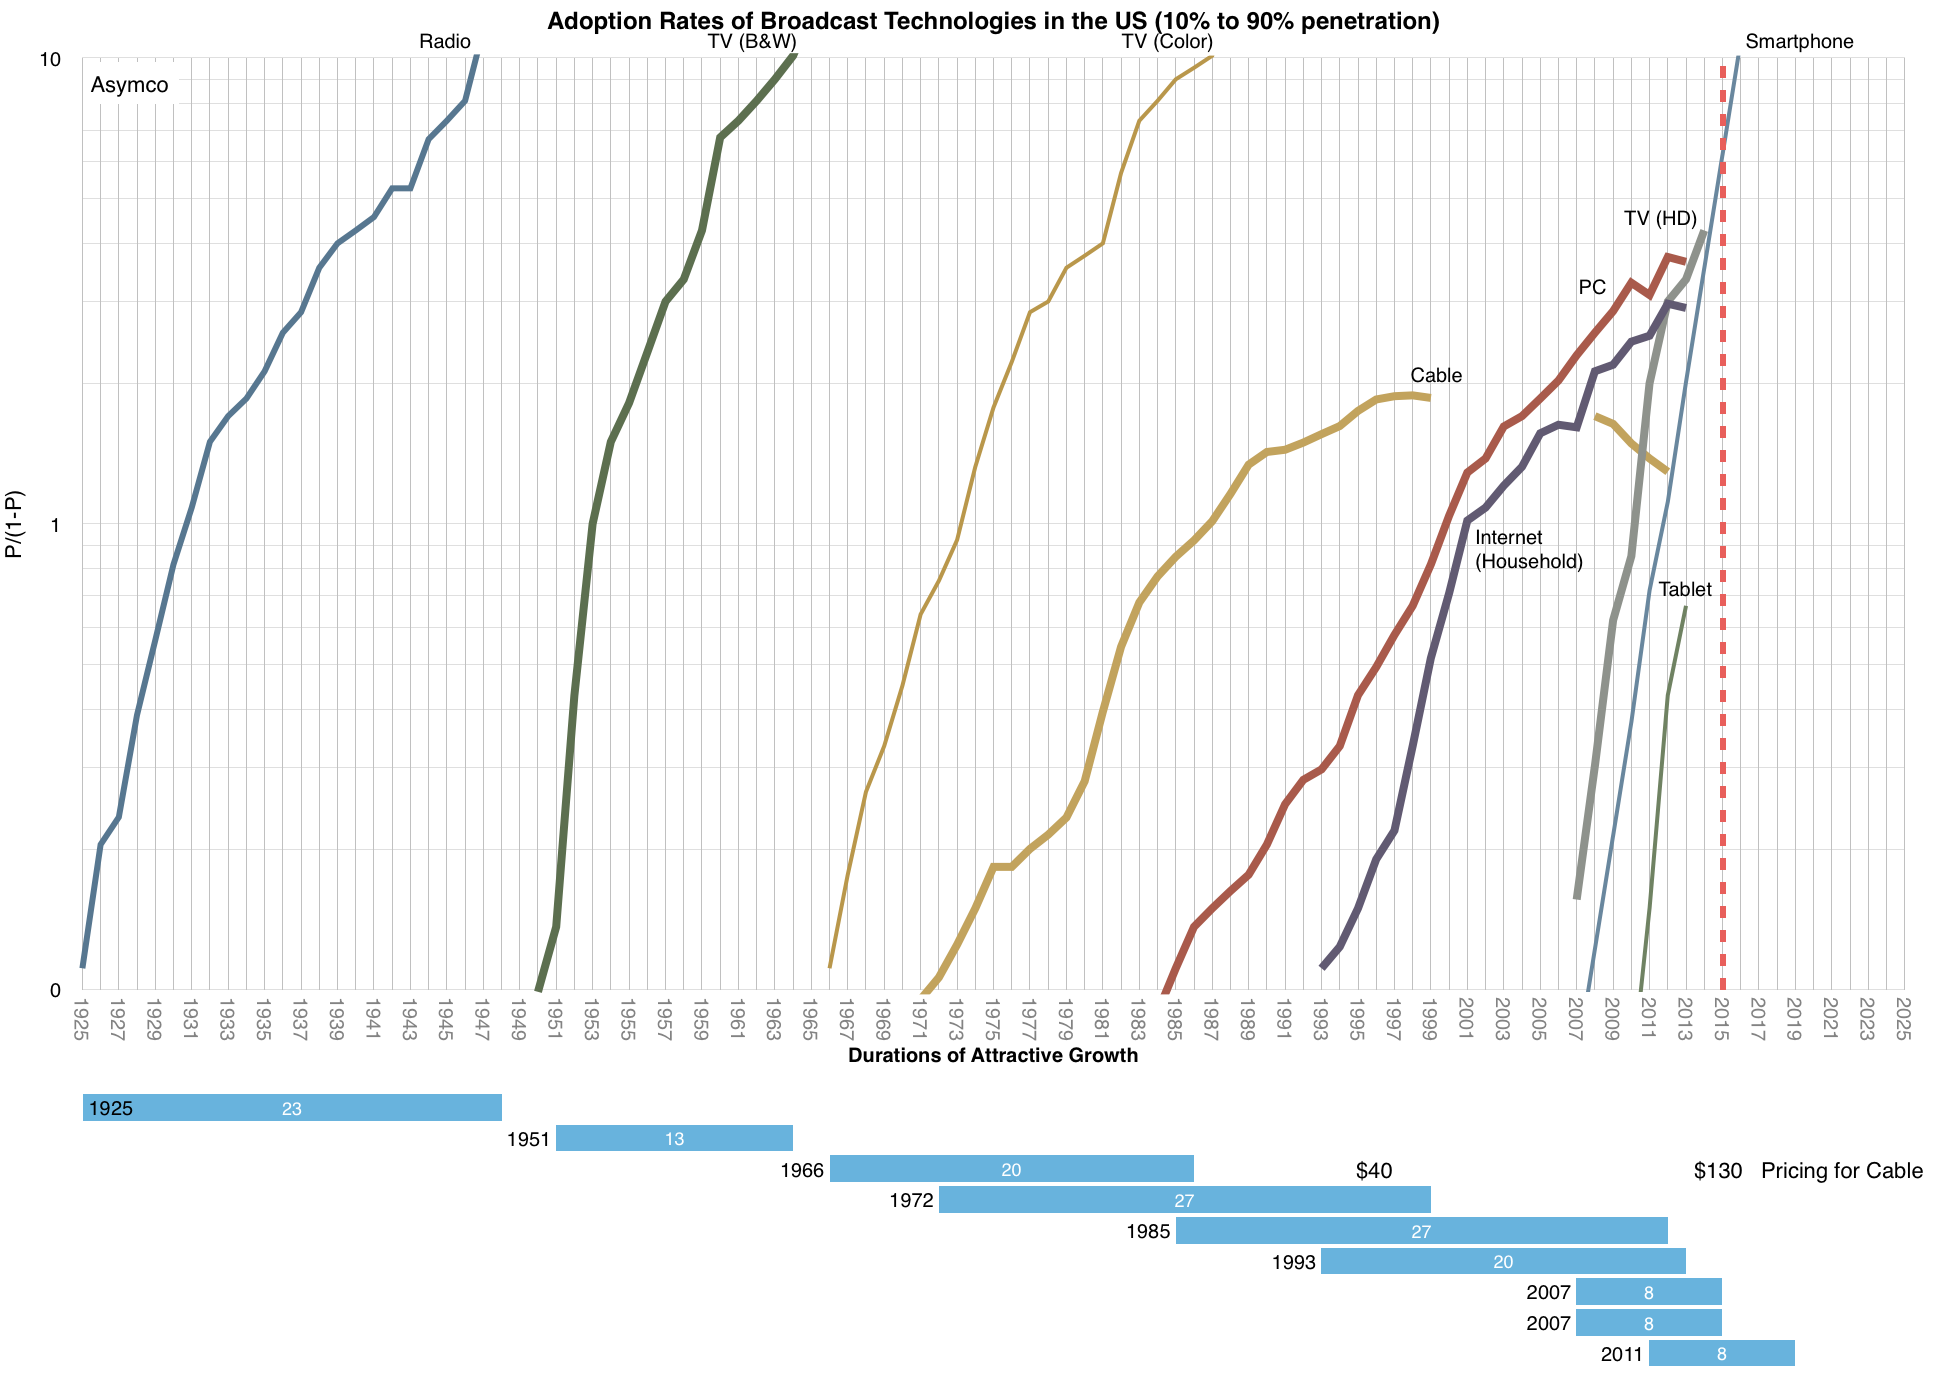
The process of convincing consumers to pay for something that used to be free was quite interesting. The first benefit to be articulated was that the quality of the picture would be much better. It would, in essence, be noise-free. ((This was in fact the birth of cable TV: a shared antenna for a community in an electromagnetic shadow))
The second benefit was an increase in the number of channels. VHF and UHF television would cover about three and 5 channels respectively while cable could offer dozens, many specializing on specific types of content like the Home Box Office (HBO) offering movies and ESPN offering sports only and MTV music videos and CNN news only.
The third benefit was fewer (or no) commercials for some of the channels. This was especially valued by fans of movies whose interruption by commercials was often detracting from the immersive value and continuity of the cinematic experience.
These benefits were very attractive during the 1980s, to the extent that about 60% of US households adopted cable. An additional group later adopted satellite-based pay-TV as the technology became reasonably cheap.
These benefits were priced modestly but as the quality and breadth of programming increased, prices rose. An average cable bill of $40/month in 1995 is $130 today ((a 6.1% compounded rate of price growth vs. a 2.4% rate of inflation)). Some of that revenue went into upgrading the capital equipment in use (the plant) and some into paying for the higher production values. Yet more went to the sports leagues and their players whose business models increasingly depended on broadcast rights.
And so over a period of about 40 years, watching TV went from free to quite expensive. More expensive even than a family's communications costs (i.e. telephone service.) That's quite an achievement at a time when technology diffusions caused huge price reductions in other goods and services. Consider that the TV set used to watch the programming improved dramatically while decreasing in price over the same period.
Meanwhile, some of the benefits began to be less relevant. Commercials are more abundant than ever. Ad buyers spend about $60/month per household to deliver ads ((Implying that the TV "business" has a $200/household/month revenue model)) The quality of the TV picture is actually worse due to compression than one might get with over-the-air digital broadcast. Finally, the abundance of channels is beyond anyone's absorption rate. Those channels which used to be "pure" became polluted and undifferentiated as each tried to be the other. ((A pursuit no doubt driven by seductive but toxic market research))
On top of these paradoxes is the fact that actual penetration of the service has been declining. As the graph above shows, Cable TV has declined (though Pay TV much less so). The industry has reached saturation decades ago and has not offered anything meaningful in terms of innovation.
Disruption theory suggests that once a product over-serves on meaningful bases of value creation (and underserves on value) it opens the door to disruption. Which leads me to ask not whether cable is past its prime but rather why it's still around?
The answers are usually immediate and plentiful: conspiracies of monopolists, lobbying, back-room deals, lock-in of content and all kinds of other misdemeanors. To which I would say: You can fool some of the people all of the time and all of the people some of the time but you can't fool all of the people all of the time.
So again, why have all the people been fooled all this time? Twenty years have passed since the industry reached saturation and prices keep rising. Today the average cable bill is projected to rise to $200/month by 2020.
My answer is that disruption is predictable. Users are cutting cords, the "uncabled" or "never-cabled" are a significant portion of the population. 13.5% of broadband households with an adult under 35 have no pay-TV subscriptions. 8.6 million US households have broadband Internet but no pay-TV subscription. That's 7.3% of households, up from 4.2% in 2010. Another 5.6 million households "are prime to be among the next wave of cord-cutters," according to Experian.
The same phenomenon occurred with mobile vs. fixed telephony. For several years it seemed that mobile was sustaining to fixed or that fixed was immune due to lock-ins. The fixed telephone incumbents insisted that the data was inconclusive. Then the trickle of abandonment turned into a deluge. The quality of service for mobile kept increasing and, with data, it became clear that the mobile devices could unleash unfathomable functionality and value.
And so it goes. A business dies first slowly then quickly. (('How did you go bankrupt?' Bill asked. 'Two ways,' Mike said. 'Gradually and then suddenly.' -The Sun Also Rises (1926) Ernest Hemingway)) The exact timing is tricky because of the non-linearity of the phenomenon. It's also hard to declare end-of-life since business zombies are very common. What is clear however is that the economics will change dramatically and the alliances between talent and distribution will shift to entrants and away from incumbents. The point when we will look back and say that cable was finished will probably come by the end of this decade.
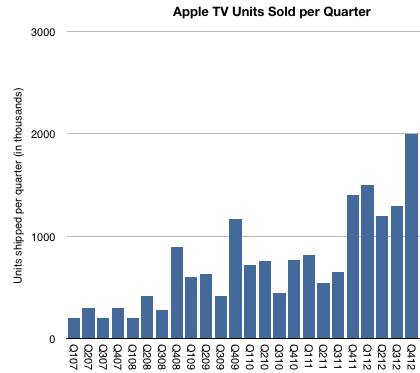
During the latest shareholder meeting Tim Cook revealed that Apple TV sales were above $1 billion in the last fiscal year (ending September 2013). The company later clarified that this figure includes device and content sales.
This poses a problem. In previous statements the company cited device (unit) shipments rather than value. The statements made to date suggested that cumulative volume of 3rd (current) generation Apple TV totaled 6 million units as of January 1, 2013.
The following graph includes an estimate of quarterly Apple TV sales based on comments made to date.
As there were no additional comments during 2013, the "Billion Dollar" quote is all we have to go with for the year. The problem with trying to separate content from hardware is complicated by several factors:
How are we to attach content revenues to Apple TV? For example, what if I purchase a series of shows on iTunes or an iPhone and decide to watch them on my Apple TV. Do these purchases count as being "attached" to Apple TV? Do we attach the full transaction value or do we attach the portion that Apple keeps (as in agency accounting)?
How does Apple account for channel placement on Apple TV? Do the channels prominently displayed on its user interface pay for this access (even though the user needs a cable subscription?) Is this the primary source of content revenue that is attributed to Apple TV?
What about Netflix, YouTube, etc? What is the content licensing deal with these channels? Does the Netflix channel actually cause an Apple TV purchase or does the Apple TV purchase cause a Netflix subscription?
Without content, one might think that the $1 billion revenue would yield total device shipments approximately 10 million units in fiscal 2013 (assuming $99 unit pricing). This is not quite right however as Apple's revenue per unit is unlikely to be $99 unless all units are sold through its own retail stores (including online). Sales through other retailers probably allow for some retailer margin so Apple's average selling price will be below $99.
Another question is the fiscal year accounting. We have visibility into the fourth quarter of 2012 (about 2 million units est.) so we only need to fill in the first three calendar quarters of 2013 to understand the Billion Dollar volume.
Finally, I already estimate separately the overall video market (in my iTunes Business Report) which, based on historic data and other inferences suggests a total video content gross (contributing to iTunes revenues) of $1.8 billion for the fiscal quarter. If a significant portion (50%) of this were allocated to Apple TV it would imply that the hardware business contracted sharply in 2013. Put another way, if I add what we know about C2012 units (6 million and an ASP of $89) to what I estimate video content revenues to have been in 2012 ($1.6 billion) I get a $2.1 billion business. This would be a "two billion dollar" business in 2012.
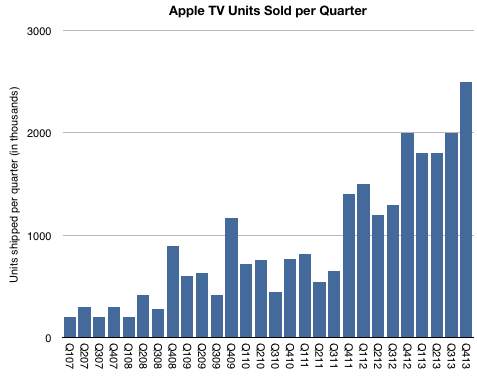
All this makes the Billion Dollar Hobby a puzzle. The way I can make it square with existing assumptions is by saying that "Apple TV content revenues" are mostly, if not entirely, distribution revenues from channel placement rather than iTunes purchases. ((This revenue will end up in licensing/other revenues in iTunes/Software/Services segment and separate from Apple TV (which is a part of Accessories).)) As a result, my best guess now is that there were about 7.6 million Apple TVs sold in fiscal 2013, with a bit over 8 million for calendar 2013.
If I'm right, the complete history of the shipments would be similar to this graph:
By Apple standards this is indeed a modest story. The total units sold would add up to more than 25 million units with healthy growth. But it would not be in the same magnitude as other iOS devices which have so far sold 800 million units.
More important than this picture however, or the Billion Dollar Business threshold, would be a better understanding of how Apple sees Apple TV as a business. We already knew that it was a low value hardware business. I even suggested that it's "Apple's equivalent of the Kindle": Hardware sold at low margins as a gateway for a high volume content business (iTunes). The problem with that model is that selling other people's content is never a good margin business. If it were to be sustained, Kindle may ultimately have to become an Amazon Prime salesman.
So that leaves the Apple TV as a product without a satisfactory business model. Unsatisfactory, at least, to Apple's standards; hence the hobby label. But what if the model is turning out to be a platform for discovery of content and therefore the equivalent of (dare I say it?) a portal! ((Exclamation point.)) The TV UI certainly limits search or traditional browsing interaction but it enables eye candy for a few choice placed offers. It is a low interaction model. Think of how the prevailing UI for TV for decades has been that of pressing one button repeatedly, also known as channel surfing.
If so , the business of Apple TV may be the auctioning of the real estate on the landing page. In some ways this is how iTunes is already behaving by "featuring" exclusive music content.
There are all sorts of implications, which I will leave as an exercise to the reader.