Asymco

Asymmetric Intelligence

valuation

  1. Wall Street's Infinite Loop: How AAPL is valued

    Research · 30 comments

    In the previous article discussing the growth scorecard, I left open the question of how Apple's growth is reflected in its share price.

    The approach to answering this question is to show how the share price correlates to that growth. The challenge for analysts has been that the company switched from subscription to current accounting for the iPhone (the largest component in its income statement). As they re-stated income and thus earnings, any historic review of P/E or other multiples of Earnings have to also be re-computed.

    So this is what I've done:

    The first chart shows Apple's price per share (blue) vs. its trailing twelve months earnings (green) and multiples of those earnings (15x and 25x).
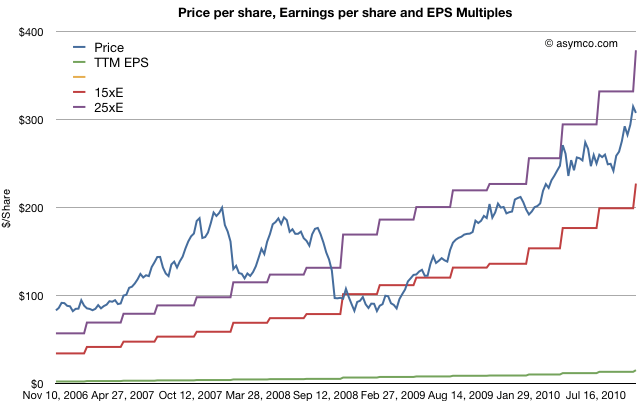
    The chart shows how Apple was priced well above 25 P/E before October 2008 and has remained within the 15 to 25 multiple bands since the winter of 2008/2009. This seems fairly reasonable and the stock's rise is a cause of celebration for many, but a cause for concern for some. Is this rise in price matching a rise in value?

    To answer, we need a way to look at the valuation of Apple. One way is to plot the P/E ratio over time. That would show how the market perceives the value of the company (i.e. how many years' worth of earnings is built into the price) The chart below does that.
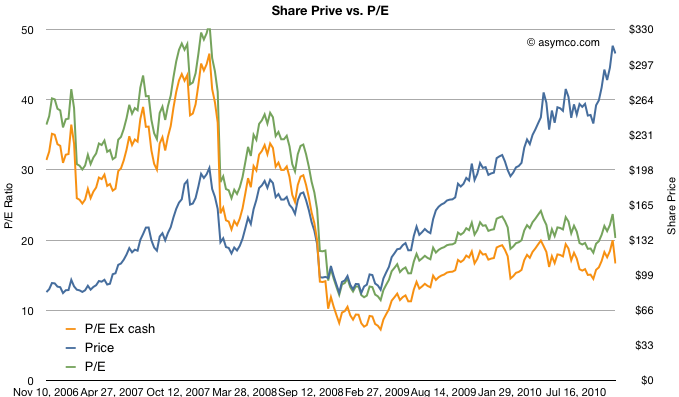
    I took the additional steps of plotting the P/E excluding cash from the price to show "P/E Ex cash" in the orange colored line and I also copied the Share price line from the first chart on this one for contrast.

    What the P/E analysis shows is that as the stock rose, it's P/E ratio fell. This means that the "valuation" of the company is quite a bit lower now than it was in 2006 and 2007. In fact, as a multiple of profitability, Apple's stock is nearly half as valuable now as before the recession.

    Since valuation is usually correlated with growth, (P/E is often compared in a ratio with Growth) we need to see whether the P/E in the chart above matches the actual growth of earnings. Fortunately we have just measured growth with the scorecard.  Here are the two charts together:
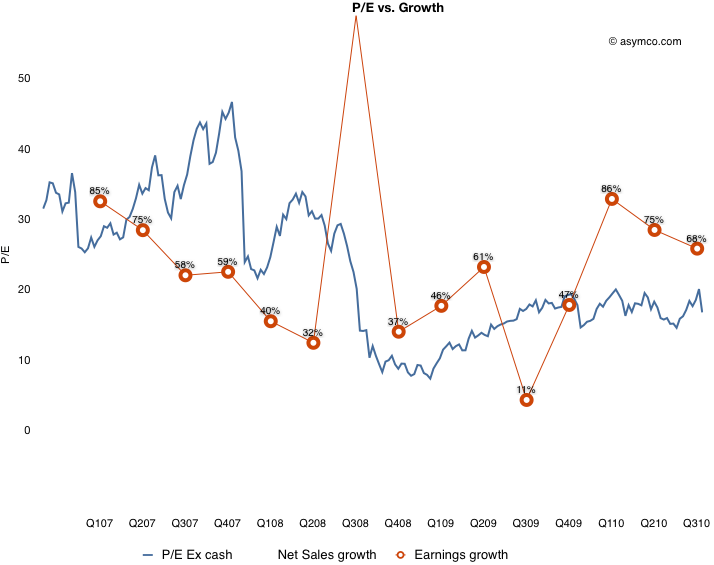
    What this shows is that while earnings growth did slow down in the lead-up to recession (with the hugely anomalous 3G launch spiking growth to 155% in Q308 causing the year-later plunge to 11%), growth picked up again in the depths of recession and has moved back to pre-recession levels. The only difference is that the multiple assigned to the stock has remained near recession lows. This is visualized by the blue line being mostly above the red line pre-crash and usually under it post-crash.

    To put a finer point on this, I plot the ratio of P/E and trailing growth (P/E/tG) in the brown line below:
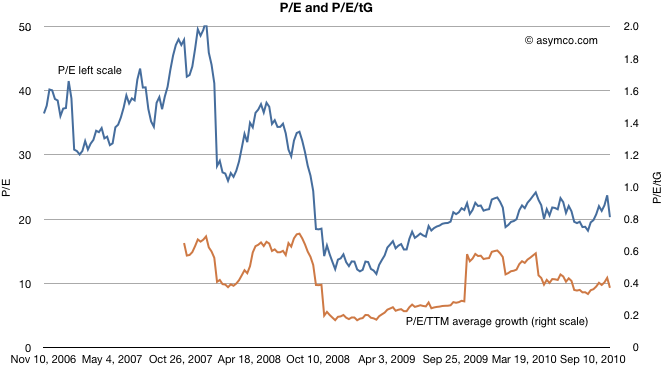
    It shows that as a measure of valuation with respect to growth, Apple is trending down. A P/E/tG ratio of 0.4 and closer to 0.2 if we exclude cash shows very weak confidence.

    The only conclusion I can draw is that the market does not believe that Apple has significant growth opportunities. A P/E of 20 with consistent 70% growth is, to be blunt, damnation. For comparison, Amazon just reported 16% growth in earnings and was rewarded with a P/E of 68.

    Amazon notwithstanding, is Apple an anomaly? Is the disconnect between earnings growth and the stock price unique to Apple or does it apply to most other equities? Is pessimism about Apple a symptom of pessimism in general? I will suggest a way to answer this in a future article.
  2. Apple's growth vs. top ten largest tech companies

    Research · 10 comments

    In the last article I described growth vs. P/E and price change for the largest "ultra-large cap" companies, of which Apple features prominent.

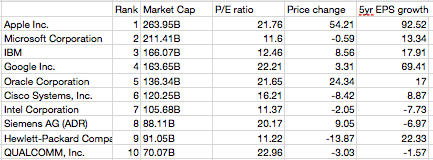
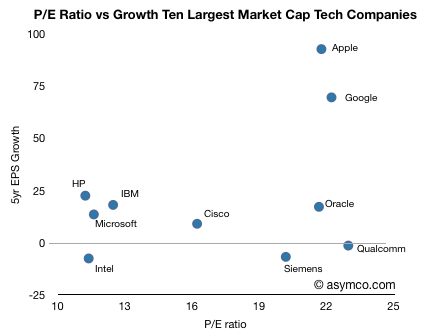
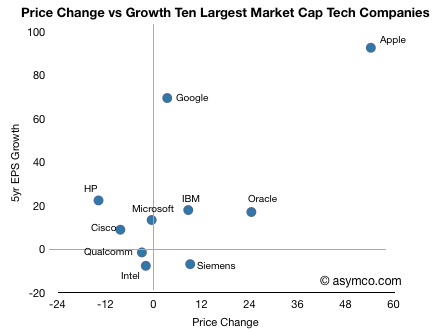
    In this article I take the same analysis to the top ten largest technology companies (by market cap, see table at bottom).

    In this comparison, Apple no longer has the largest P/E ratio. Qualcomm, Google and Oracle are all at similar levels of valuation relative to earnings, however Apple's growth outstrips them, only with Google in the same quadrant.

    Note the "Wintel" cohort consisting of Intel, Microsoft, HP clustered around the Low growth, low valuation quadrant in the lower left (coincidentally co-located with IBM). Oracle, Qualcomm and Siemens show high valuation with low long-term EPS growth. Cisco is somewhat on the fence.

    When comparing how the market has rewarded growth through share price appreciation, the correlation to growth is much better. Google seems under-rewarded.

    Data follows:

  3. Apple's growth vs. top 10 largest market caps

    Research · 33 comments

    Apple's stock price has been rising. Although it's still priced at a P/E of 22 while facing near term EPS growth well above 50%, this is belated recognition of the potential of the iPad and the iPhone.

    However, as it has grown, Apple's valuation is now not only higher than any other technology company but it's nearly the most valuable company on the planet. There is a theory that ultra-large market caps are reserved for companies that are past their prime. Sometimes this is attributed to the law of large numbers: that conclusion that big numbers cannot grow much bigger because compounding growth is exponential whereas markets are limited and become quickly saturated.

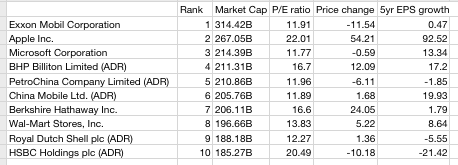
    The trouble with this theory is that "large" is relative; large is often simply "the largest". Large market caps are not what they used to be. During past booms, large caps touched a trillion dollars. Today, the largest market cap is merely $314 billion.

    So I don't put much faith in large number "laws". The real question of under/over-valuation rests on whether the company is growing or not. Valuation is simply the net present value of future free cash flows (plus assets). So the most important determinant of current value is growth in cash flows.

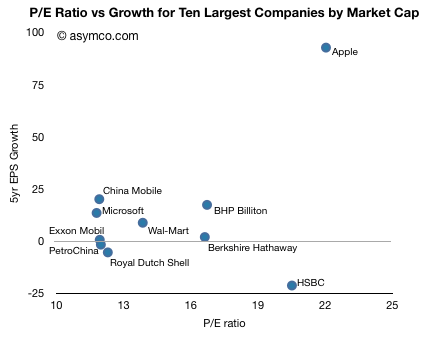
    It's fairly easy to assess this: compare P/E which is a proxy for valuation with EPS growth. The following chart does this for the top ten largest market caps traded on US exchanges (as listed by finance.google.com).

    One should see some correlation between the two variables, but given the 5 year time frame, many of these companies showed large volatility. There are outliers like HSBC which has a rapidly rising value even though it was badly affected by the credit crunch.

    The other outlier is Apple. The company showed 93 percent EPS growth over a five year period and has a P/E of 22. The company with the next highest total value (Exxon Mobil) had 0.5% growth with a P/E of 12. The company with the next lowest total value (Microsoft) had 13.3 percent growth with a P/E of 12.

    For an ultra-large cap, Apple's growth is unprecedented and extraordinary. It's in fact off the scale. The average growth of the other 9 top caps is 3.6 percent!

    Apple's growth is a factor of 25x higher. The P/E is only 1.6x higher.

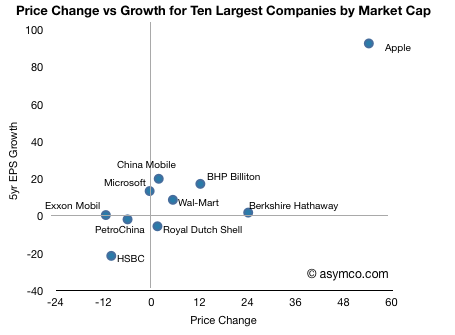
    The result has been a much higher appreciation in the stock price as shown in the following chart.

    So it's clear that Apple, in this peer group, is far from ordinary.

    Data follows:

  4. Apple vs. Correlation fatigue and the ETF bubble

    Research · 6 comments

    Recent commentary in financial press (e.g. FT Alphaville » Lost in correlation fatigue and The Herd Instinct Takes Over, Amber Waves of Pain)  points out how the markets have become insensitive to fundamentals or valuation itself.

    Symptoms of this are:

    • Global markets trading in lock-step.  In an apparent blindness to any local differences, markets from emerging economies to Japan and to London trade in perfect correlation.
    • Crude oil and other commodities are mis-priced due to HFT or algorithmic trading which ignores underlying supply and demand fundamentals.
    • Value investors find that there is lack of dispersion among stocks.
    • Component stocks' correlation to the S&P 500 is at highest level since '87 crash, reaching a high of 83% vs. average of 44% since 1980.
    • ETFs (exchange traded funds) maintain (or freeze) over- and under-valuations.

    Structural changes such as the proliferation of exchange-traded funds and super-rapid computer-based bloc trading, activities that are totally unconcerned with valuation metrics and/or long-term trends, are still taking place and there is little or no prospect of this development coming to an early end.

    • Adam Smith’s invisible hand has for the time being, been handcuffed.

    It means you can’t trust any valuation. I could have valued a subprime CDO better on May 6 than any equity. And it’s almost the same thing all day long. Valuations and prices have been divorced for a while. Just look at the volatility. It’s not like traditional trading. No wonder there are such increased correlations.

    What this has to do with mobile computing?  Interestingly, I find that Apple is not just a victim of this de-coupling of fundamentals from valuation. I hold out hope that the stark facts of its performance might actually pop this correlation bubble.
    The hope comes from the fact that trading strategies have finite lives.  As soon as a strategy develops to a point of being widely used, it makes sense for a contrarian to "short" or bet on the reverse of that trend, taking advantage of the tendency to overshoot. I don't have a strong handle on this phenomenon, but the chances are that value/fundamental investment will be back with a vengeance and Apple might just be the leader, by sheer weight of numbers.