Asymco

Asymmetric Intelligence

valuation

  1. The thermodynamics of Apple's share price

    Research · 82 comments

    Andy Zaky at Bullish Cross wrote a great post on Apple’s valuation, showing the deep discount of Apple's earnings vs. an average company. It essentially states that Apple's money is not green.

    Felix Salmon took it forward by enumerating a few explanations that might be used for the despondent valuation. None are successful arguments, but that should not be a surprise.

    To understand the phenomenon a bit more precisely, I maintain and think about these charts:
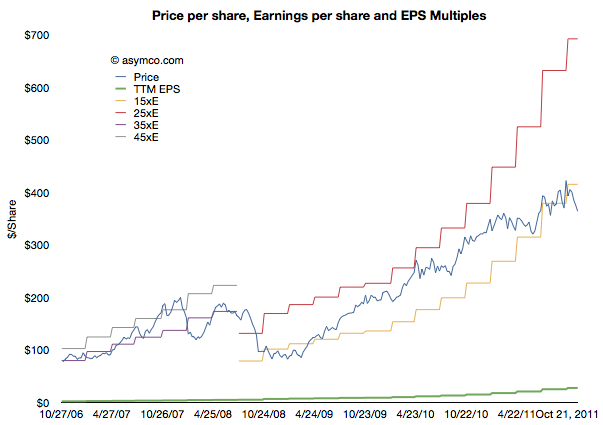
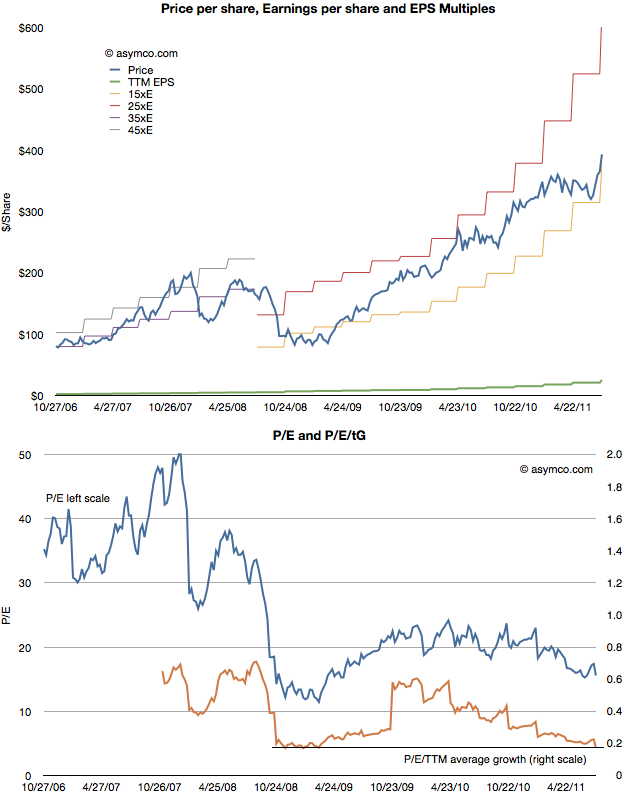
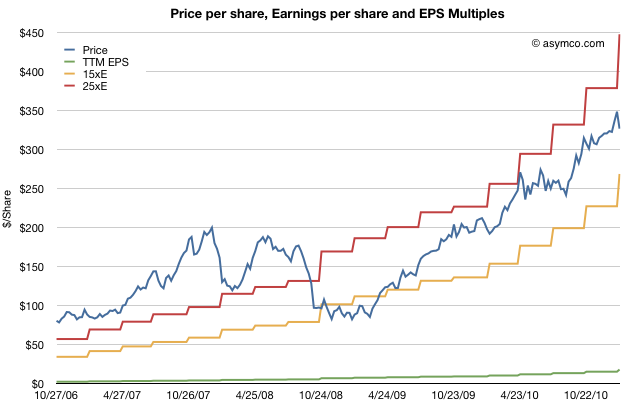
    This shows Apple's share price ("P" in blue) and its earnings per share ("E" in green). In addition there are multiples of the earnings in "bands". The first band is 35xE to 45xE which bounded the price during the period of 2006 through most of 2008. The second band is 15xE to 25xE which bounded the price since then. The data is updated weekly so it is current as of last Friday.

    Illustrating it this way shows how the stock is seen as representing different companies at different times. The 2006 era (iPod) Apple was seen as a high growth, dynamic company with loads of headroom for growth. The current (iOS) Apple is seen as a slow growth, fairly static company with most forecasts showing 20% growth potential.

    Note that the price has dropped outside the current band for the first time since the great recession. It is still below 15xE today. Perhaps a new band is forming.
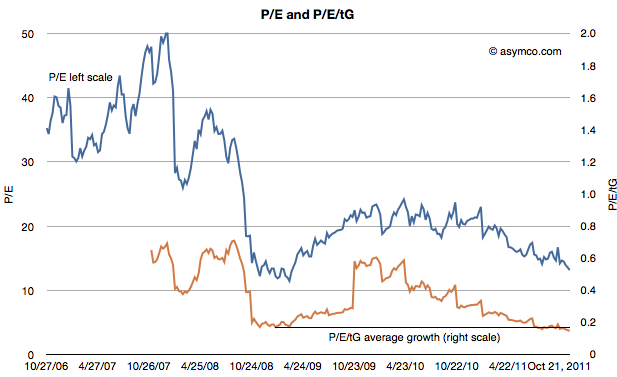
     

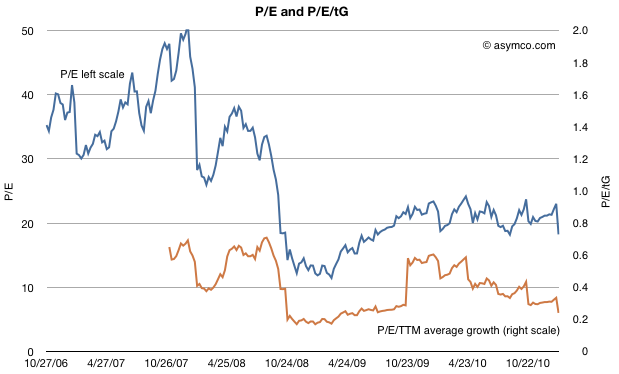
    The second chart shows the P/E on its own (in blue) but with a second measure where the P/E is divided further by the average trailing twelve months' growth (P/E/tG). This is a variation on the P/E/G (aka PEG ratio) where instead of (mostly wrongly) estimated future growth I use actual growth history--hence the t for trailing. The P/E/tG is a way to normalize P/E as a function of growth and hence a more appropriate index of value potential.

    I added a horizontal line to the chart to show the minimum value P/E/tG reached during the recession (0.17 in January 2009). As you can see, the P/E/tG is now lower than at that time (0.15). It implies a deeper discount for the company's earnings growth than during the time when the world faced economic contraction.[1]

    Note also the trend of that line as it shows a steady linear path toward zero.

    Of course, it cannot reach zero unless Apple files for bankruptcy. But until it does file, the line can only reach zero asymptotically as E/tG increases. Which is a relief, I suppose, as it means the rate at which P/E/tG drops will decrease. This implies that as earnings growth persists, the drop in price will have to moderate.

    The other threshold to keep an eye out for is when Apple's share price will reach its cash per share. That's the point when investors will consider the company to be a net value destroyer. If you performed that analysis in January 2009, and you were accurate about earnings forecasting, the answer would be well before today. See the following chart:
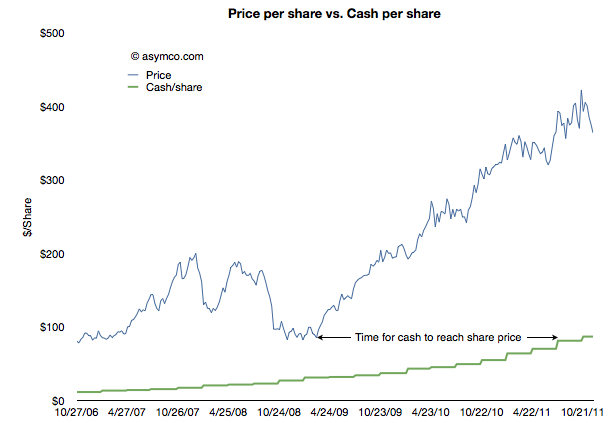
    In other words, in January 2009 the stock was trading at a price (<$80/share) below the current cash per share (>$85/share). It took Apple 18 months to grow its cash to reflect the price set on the company. Had the stock not risen then the company would today be trading below book value.

    The amazing thing is that today the valuation structure (P/E/tG) is even worse than in it was January 2009. An interesting exercise would be to project how long it would take for the cash to increase to the current share price.[2]

    I imagine this time interval should have a name. How about the time to boil: the time for growth pressure to become sufficiently high to exceed disbelief that growth can happen.

    ---

    Notes:

    1. Note that the low values were placed on the company after the crisis took hold, not as an anticipation of contraction. See the behavior of the index during the summer of 2008 as the credit crisis was unfolding.
    2. This analysis is consistent with the analysis that Apple is not valued on earnings or earnings growth but on its balance sheet. The ratio of Price/Cash has been fairly constant but if it breaks down (as it has been--see below) then we need to assume a new dynamic is in place. 
  2. Is Innovation Valuable?

    Research · 199 comments

    I began thinking carefully about Apple in 2005 when the stock was priced at around $55/share. I remember that the events which made me consider Apple in a different light were the launch of the iPod shuffle and the launch of the Mac mini. Both moves signaled to me that the company was serious about competing with non-consumption. At that point I thought that the company was a potential opportunity as an investment.

    But I also remember that many people at the time thought that the stock price was too expensive. At $50, the company was much more expensive than the year before. The stock started 2004 at about $11/share. The reason it had climbed so much was that the iPod began to be a real world-wide growth phenomenon. Buying Apple was buying into the iPod and many said the price was unsustainable given such a strong dependency on fickle consumer tastes. It was a much riskier proposition than that of competitors like Dell and HP which made product for reliable buyers like enterprises.

    Indeed, by 2006, the shine was off. In the first half of 2006 the stock collapsed from $85 a share to $50, a fall of 40%. It was becoming clear that with mobile phones taking on more music playing features, the iPod was not going to be a big story for long. What's more, Apple had just announced that they were switching to Intel for the Mac product line. Investors saw just how vulnerable the company still was and considered that the Mac brand was in jeopardy as it transitioned to becoming a Windows-friendly machine.

    However, in 2007 the company's value recovered with the introduction of the iPhone. Suddenly there was a new product to drive sales. Nobody knew by how much or how but there was a sense that the iPhone was enough to keep Apple from oblivion.

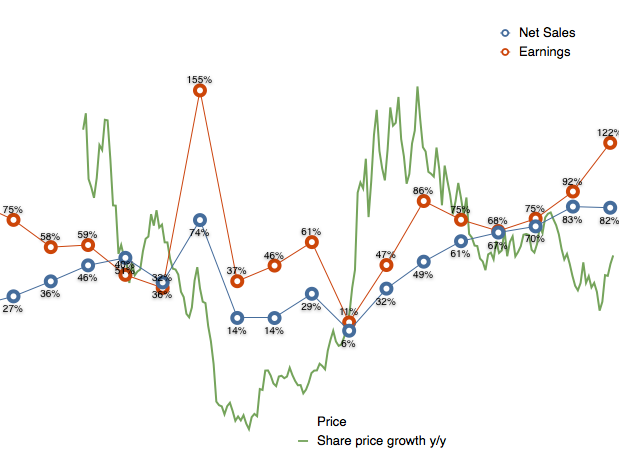
    Yet, again, in early 2008 the company lost 40% of its valuation. In a rather inexplicable period following the launch of the MacBook Air, the company's shares went into free fall. Inexplicable because the company continued to deliver solid growth with 2008 calendar quarters showing between 32% and 155% EPS growth.

    Then the recession came. It caused another 40% share price collapse. Growth slowed to a range of 11% to 61% during 2009. As the marco "headwinds" blew over, by the end of 2009, with the help of a lukewarm response to the iPad, the company's value recovered to its 2007 level. In the mean-time its earnings more than doubled.

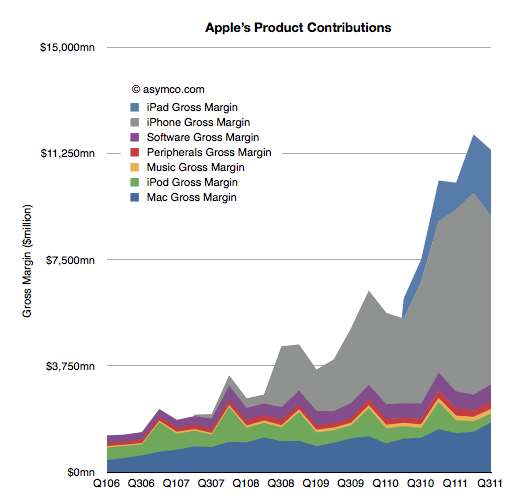
    It may not appear to be the case, but throughout this volatile period, the investment thesis remained fairly constant: Apple is a rather small collection of product bets. Owning Apple meant riding the iPod or the iPhone or the iPad as waves of growth. As soon as one growth wave was seen to start to fade, investors would say the same thing: Apple is done.

    The chart below shows just what that looks like in terms of product contribution to gross margin.

    The investment thesis is the same today. I've had dozens of conversations with fund managers and if anything, it's even more about betting on products. The iPhone and the iPad make up such a large part of profits that the company seems to be nothing but those two things. So if there is any hint that those products might slow down, the stock is sold off.

    What intrigues me about this investment thesis is not whether the signals of growth are interpreted correctly or not, but rather that an investor in Apple in 2006 was considered perfectly rational valuing Apple as an iPod company as much as an investor today is perfectly rational valuing Apple as an iPhone company. Why would anyone buy Apple for any other reason? There is no evidence that Apple can be anything more. Any fund manager positing a different point of view would surely be limiting her credibility.

    The consensus is that the value of future, unknown products is zero. Not only that but the probability that there will be any products at all is equally zero. Not only that but whatever Apple does to create new products is not perceptibly valuable. The company is simply the sum-of-the-product-parts and nothing more. Cash flows from current products can easily be shown to be more than the current valuation so even these products are deeply discounted. If and when a new product shows up, it will be considered and maybe if it shows promise, the stock will reflect that, briefly.

    A corollary to this investment thesis therefore is that the process of product development at Apple is worth nothing. It does not matter if the company has shown an ability to disrupt and to create new categories. The past is not a predictor. The value of the company is a discounted cash flow of current products--discounted for the odds of commoditization, which are seen to be quite high. A new hit product is a windfall, a winning lottery ticket. Something that you cannot count on.

    Think about that in a different context. That's like valuing Pixar on the box office revenues of its current movie. If Cars 2 is not beating records, Pixar is suddenly nearly worthless. The fact that Pixar repeatably creates blockbusters would be seen as meaningless. The way they built a reliable pipeline with predictable cost structures for movie-making is not interesting.

    However, the fact is that Pixar did not get acquired on the basis of the last hit it made. It was acquired for its system of production. This can be confirmed not only by the price paid but by the fact that the organization was not folded into the Disney machine. It stands alone and is given autonomy. So at least in the movie making industry, predictability is seen as valuable.

    So why is Apple not valued as a process company?

    I think the answer lies in the lack of understanding or belief in a theory that predictable success in product development is possible. Until and unless an explanation is available that persuades a majority that Apple is as much a hit factory as Pixar then Apple without the products will intrinsically be valued at zero.

    The premise of the stock market today is therefore that being innovative in technology is meaningless. Innovations are valuable but there is no such thing as an innovation process. If there was such a thing then we could measure it and put a number of its value. Until then innovation is nothing more than a spin of the roulette wheel.

  3. Apple's Residual Enterprise Value is less than 7x Earnings

    Podcast · 70 comments

    In his third “The Critical Path” podcast, Horace Dediu explained how Apple’s cash can be viewed as a strategic option, an opinion that resonated also with other analysts [1]. Cash is one of the most flexible resources as it can convert quickly into other resources such as brands, companies, technologies, people and even processes. More cash means more strategic flexibility. The large cash reserve Apple has accumulated provides high flexibility for future investments. These characteristics of cash already imply an intrinsic option value. But how big is this value?

    Calculating Option Value

    To help us determine, I will apply the Black-Scholes model. The model has two key characteristics that are applicable to valuing the option character of Apple’s cash. First, the simple form of the calculation excludes dividends and, as far as we have seen, there is no new information available that would suggest that Apple will pay dividends in the near term. Second, it implies that the option can be exercised at any given time until the end of the option exercise period - just like any buying or investment decision made by consumers. Lastly, we will assume that Apple’s cash (including short-term and long-term cash as well as financial investments) is instantly available. Although large amounts are held by foreign subsidiaries or are invested in maturities longer than one year, we can overcome these practical issues by borrowing against it. As we are interested in the value of the whole pile, we use the latest reported figure of $81.6 billion as the strike price (or exercise price).

    What other inputs do we need to determine the option value of Apple’s cash [2]?

    • Volatility: A measure that determines financial risk of a certain asset. Apple’s share has shown a volatility of 26,1% over the last year.
    • The risk free rate determined by the 10 year US governmental bond interest rate: 1,96%.
    • A timeframe in which the option can be exercised. Let’s assume a 10 year timeframe in line with the risk-free rate and an imaginable horizon for mere mortals.
    • The value of the underlying (or what Apple is investing in):

    The return of the investment exercised with the cash at hand should yield a higher Return on Capital Employed (RoCE) than previously achieved to increase shareholder value. On the other hand, such a high cash pile also provides the flexibility to invest into lower return ventures. Such an investment would be taken if a certain technology or trend has been missed by management or becomes suddenly more important in the priorities of the company. In defensive moves or moat creating ventures, the expected return would be significantly lower or can even be negative. For the last twelve months, Apple has returned 106% in terms of operating income over its capital employed [3]. I use the return to value the underlying. For example, investing $81.6 billion in assets that yield 106% return equals a underlying value of $168 billion.

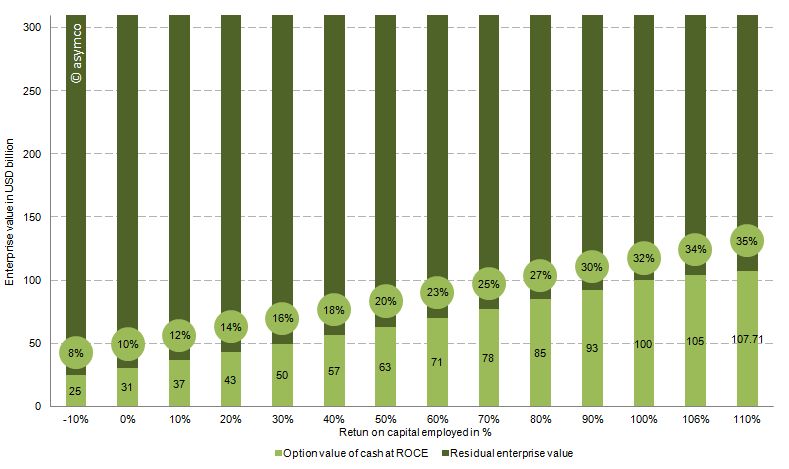
    The chart below shows the option value of the cash as a percentage of enterprise value of Apple (at the time of writing $310 billion) based on the range of the expected return on capital employed. Or in other words, how much of Apple’s current value is explained by the option value in holding such a large cash reserve.

    Conclusion

    Therefore, with the assumptions above and a RoCE from -10% to 110%, between 8% and 35% of Apple’s current valuation is explained by the option value of cash. We can see that even with large variations of the key input variables, Apple’s enterprise value is partly explained by the option value of cash which, in turn, is attributable to the sheer amount of cash at hand.

    If we look at the option value explaining 25% of Apple's enterprise value then 75% or $232 billion is the "Residual Enterprise Value" (REV) representing the value of Apple's cash flow generating operations. That puts Apple's valuation at 6.9x REV/EBIT 2011 or 6.5x REV/EBITDA 2011 -- fairly low relative to recent performance. EBITDA and EBIT have been growing at a rate of 70% for the last two years and at a rate of 84% over the last year alone.

    1. It’s good to be king (http://5by5.tv/criticalpath/3) , Apple: Behold The ‘iEndowment,’ Says Wedgewood (http://blogs.barrons.com/techtraderdaily/2011/09/20/apple-behold-the-iendowment-says-wedgewood/)
    2. For more information regarding option pricing see http://en.wikipedia.org/wiki/Option_(finance)
    3. Operating income of the last twelve month of 33.8 USD billion divided by capital employed of 31.8 USD billion defined as total assets minus cash (or sum of all asset excluding cash)
  4. Apple's P/E compression illustrated

    Research · 118 comments

    The reason we look at valuation is that it offers insight into how innovation is perceived. If a company is a successful innovator it usually creates vast wealth for its owners. However, the timing of that wealth creation depends greatly on its recognition by others. In other words, valuation lets you determine how recognizable innovation is. If your analysis tells you that a company is supremely innovative but nobody else recognizes this then you have an investable opportunity.

    So with that in mind we like to compare industry and innovation analysis with what "the market" thinks about Apple.

    The latest method we had in mind was to compare P/E (a measure of valuation) and Growth. We've shown before that they seem to be moving in different directions. That's not been news for over a year. What we will try to do now is to see if there is discernible change in the relationship before and after the financial crisis.

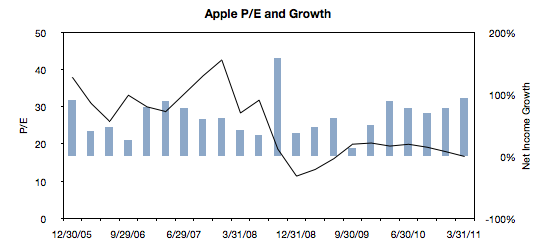
    The following chart is a simple representation of P/E (line chart with left scale) with Net Income growth super-imposed (bar chart with right scale.) We chose a time period of 22 quarters. 11 quarters after the crisis (i.e. quarters after the one ending in Sept. 2008) and 11 quarters before the crisis (quarter ending 12/20/05 through the one ending 6/30/08).

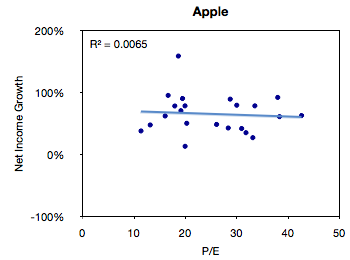
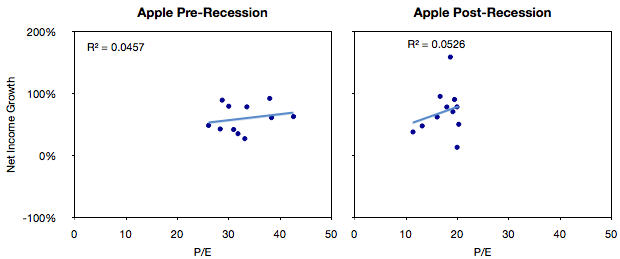
    We then plotted a scatter of all these pairs (P/E vs. Net Income Growth).


    The R-squared value simply shows that there is no correlation between these two variables, but this is not a surprise.

    The next step would be to compare the pre-and post-crisis data sets. The idea being to see if, and to what degree, there was influence from conditions beyond the control of the company.


    What seems to be happening is that the cluster of values did indeed move from the right (high P/E) to the left (low P/E) without much change in the growth.

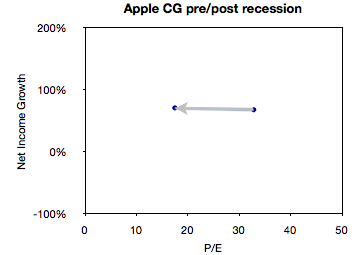
    We can get an even better feel for this by measuring the "center of gravity" of the clusters and plotting how they shifted.

    This chart illustrates succinctly the phenomenon of "P/E compression" where P/E drops while growth continues.

    In the case of Apple, average growth actually increased slightly between the two sampling periods (from 68% to 71%) while the average P/E dropped from 32.8 to 17.5.

    What will follow over the next few weeks will be pair-wise comparisons of Apple and comparable companies along these metrics of P/E and Growth.

  5. Apple and comparables P/E ratios: Is punishment for growth being dispensed equally?

    Research · 72 comments

    Apple's valuation has been discussed several times on Asymco. Apple’s relative valuation in terms of P/E ratio has not improved since the recession despite an acceleration in financial performance. As Apple seems to be getting punished for growth, we have to also ask if it is the only one.

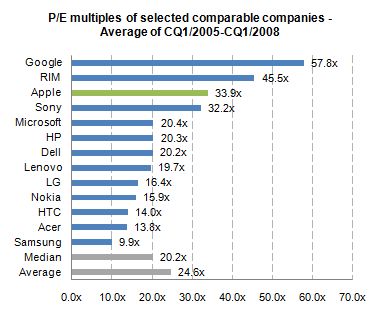
    When looking at valuation from an institutional investor or financial analyst point of view, the most common methodologies are discounted cash flow (DCF) as well as comparable company multiples. Most often, a DCF valuation is performed and cross-checked with comparable multiples. The justification for using comparable companies is the exposure to the same market dynamics including, for instance, market growth and profitability. So to understand this perspective, let us focus on a peer group valuation by looking at the average P/E multiples[1] for the calendar quarters 1/2005 to 1/2008[2].


    We can see that before the financial crisis Apple has been valued above the peer group average with a P/E ratio of 33.9x.

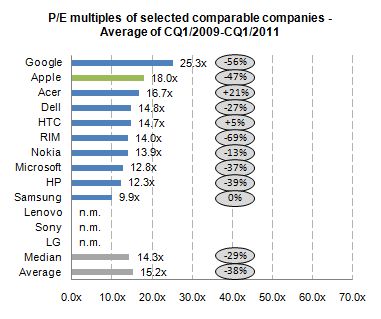
    During the financial crisis stock prices declined across industries. For the selected companies share prices declined on average more than 80%. One would assume that with the improved industry outlook and worldwide recovery since 2009, peer group multiples should return to pre-crisis levels. By looking at the average P/E multiples for the calendar quarters 1/2009 to 1/2011, we can derive the change in relative valuation levels.


    The data shows that, on average, all companies are continuously trading almost 40% lower for a two year period after the financial crisis. Despite Apple’s higher-than-average discount of 47% to pre-crisis valuation level, Apple is valued above the peer group average and on top of the mobile phone and PC vendor group.

    By using the comparable company valuation approach, we are able to see how institutional investors analyze and value Apple. The analysis points to a valuation paradigm shift affecting not only Apple, but many comparable companies post financial crisis. In addition, there was a premium on Apple’s valuation before crisis and there is a premium after the crisis.

    The notion that Apple has been single-handedly punished by the market does not hold in the context of comparable companies.

    The next step will be to determine if the P/E premium for Apple is consistent with its growth premium.

    ---

    Notes:

    1. Share prices as of end of quarter, earnings include last twelve months
    2. Charts excluding negative multiples and outliers (turn-around multiples)


  6. Apple's share price (adjusted for earnings and growth) reaches new low

    Research · 30 comments

    After Apple reported earnings growth of 125% its share price dropped to a P/E of about 15. This reduction in valuation is part of a trend I've written about for over a year so there were no surprises. The first chart below shows how the stock has traded between increasingly lowered P/E bands.

    As the second chart shows, not only is the P/E ratio declining, but when seen against the trailing twelve months (TTM) average growth rate, the P/E/TTM ratio is now at the lowest since the great recession (around 0.17--a value of 1.0 is a rule of thumb for "fair value" in a growth stock).

    Those values include cash. Excluding cash, the P/E as of Friday was 12.4. On a forward basis (my estimate--which has shown be be conservative lately) the P/E is around 7.

    Perhaps some day in the future investors will come around to looking at Apple as a growing company, but there has been no such inclination for over two years. As I've pointed out numerous times, growth and valuation are moving in opposite directions.

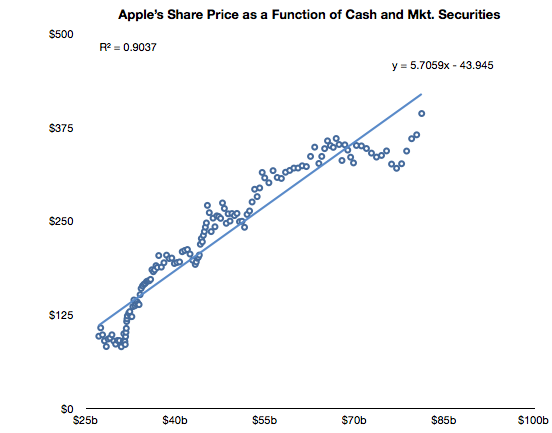
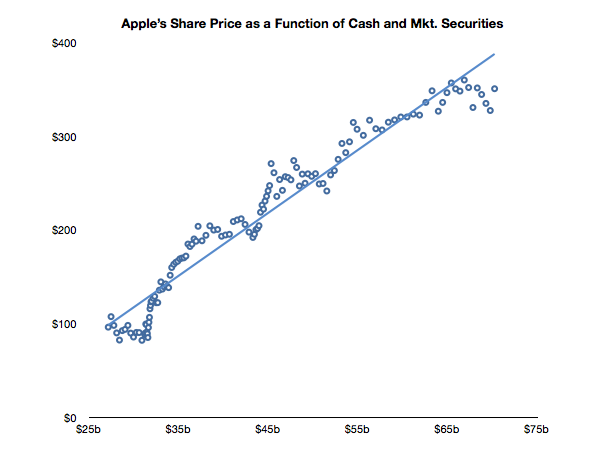
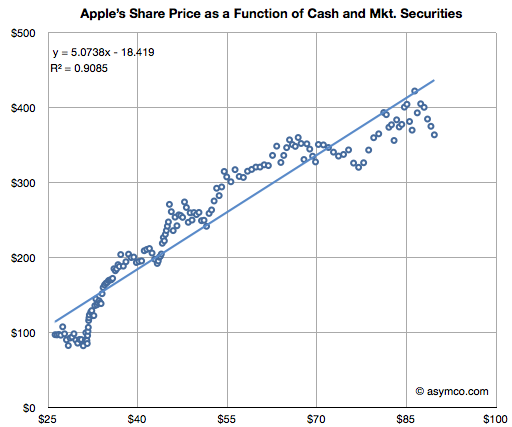
    The only correlation to the stock price has been found on the balance sheet, not the income statement. Looking again at the relationships between cash and the stock price, we see a clear relationship (r squared of .9)

    After a lapse during the first quarter, the relationship that has been in place since October 2008 is returning.

    Note the formula of the trendline which allows some interesting guesses on what the stock price will be. For example, putting $95 in cash per share results in a share price of $500. Let's see if the relationship holds until then.


  7. A new way to value Apple

    Research · 38 comments

    Almost all valuation models for Apple assume it's a hardware company. The modeling algorithm for hardware is simple:

    • For each year in near future
    • For each product line
    • Compute contribution
    • Determine company value by summing contributions and multiplying by a P/E ratio

    The major difficulty is in predicting the growth of each product line. This is difficult because buyers can be fickle. Companies employs all sorts of tools in order to secure repeat customers but if switching costs are low, the company can crash in value. For this reason, analysts pick various ways to predict device  sales. Some choose to index each product on production (channel checks), demand (customer surveys,)  or even on a top-down share of total (market research on growth of whole market and assumptions of share).

    Although simple and convenient, this model does not probably match the way Apple is managed. The company does not build hardware products to sell and forget. It builds platforms which are best seen as sources of recurring revenues. Users are incentivized to continue buying devices. iCloud, iTunes and other Apple properties are expressly designed to that goal--and they are not cheap to run. So, the company must see the world through a different set of lenses than the default model shown above.

    To think about the business like they do, we need to put the data through a similar set of lenses. I began with a modest proposal last month to value each user as a source of recurring revenue. Now it's time to expand on this method.

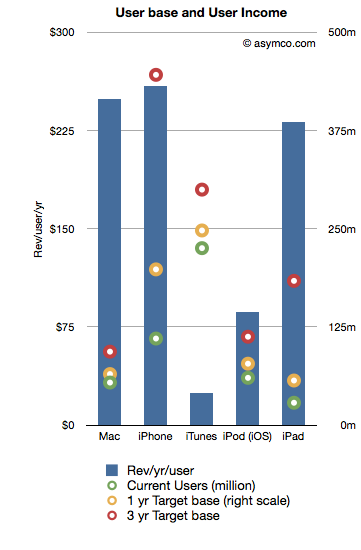
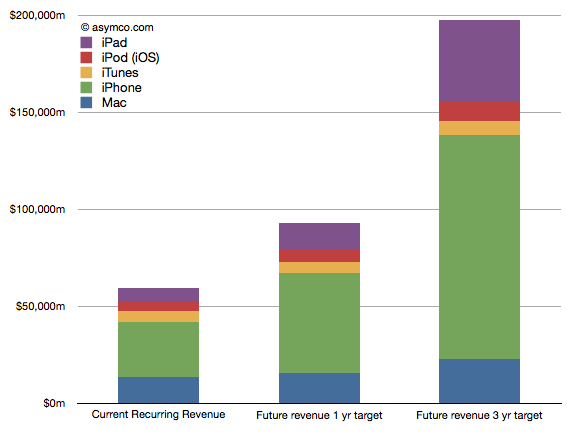
    The following chart shows the recurring revenues per user by product and the current and possible future size of user bases.[2]

    Revenues/yr/user are bars with the left axis and the User bases are various colored circles indexed with the right axis.

    The assumptions that went into the data are as follows:

    1. Device life span is as per previous article linked above
    2. User base growth for 1 year is: Mac 20%, iPhone 80%, iTunes 10%, iPod 30%, iPad 100%
    3. User base growth for 2nd and 3rd years (recurring): Mac 20%, iPhone 50%, iTunes 10%, iPod 20%, iPad 80%.
    4. The Revenue per user is assumed constant

    Note that the user base growth figures are lower than the product growth levels seen historically. Obviously, the model is highly sensitive to these growth assumptions so they need to be scrutinized and tested rigorously.

    Nevertheless, as a straw-man proposal,  the recurring revenues for all these products[1] is shown in the following chart:

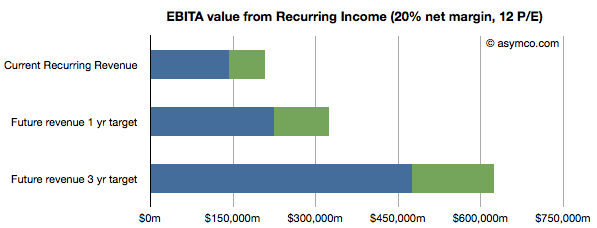
    Once the income is estimated, we can take that value and assume a profit margin (net) and then multiply the earnings by a multiple. Using a 20% net margin and 12x P/E yields the following chart.

    (I added an assumed level of cash in green.)

    This model would imply that the company today could be valued at $208 billion on the basis of its installed base alone. That value would be about $323 billion in one year and $620 billion in three years. Dividing by the number of shares outstanding (935m this year increasing at 2% a year) yields a share price of $222, $339 and $629 by mid 2014.

    These values can be considered "lower bounds" on valuation since they assume income from previously secured customers. The speculative part of investment would be based on what the future bases will look like (so, for example, if one believes these assumptions, the $629 figure could be considered a target to be discounted to today).

    ---

    Notes:

    1. Excludes Software, Peripherals, non-iOS devices, and any other service revenue.
    2. Compare this char to social media companies (MIT Technology Review)
  8. The market values Apple's balance sheet, not its income statement

    Research · 79 comments

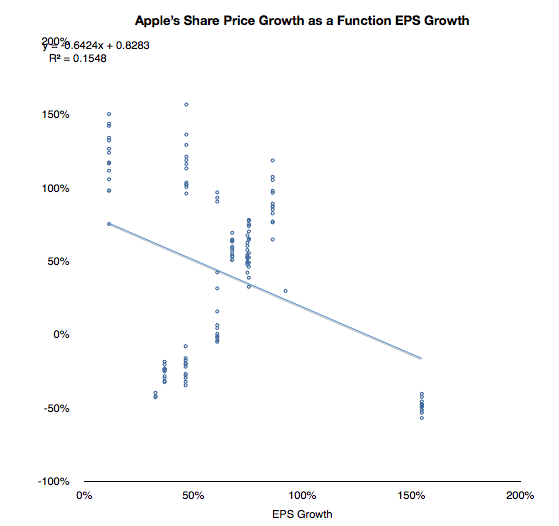
    As I have tediously repeated in this blog, Apple's share price has been de-coupled from its earnings for many years. Consistent earnings growth above 70% is not seen as valuable. As the chart below shows, there is no correlation between EPS growth and value growth.

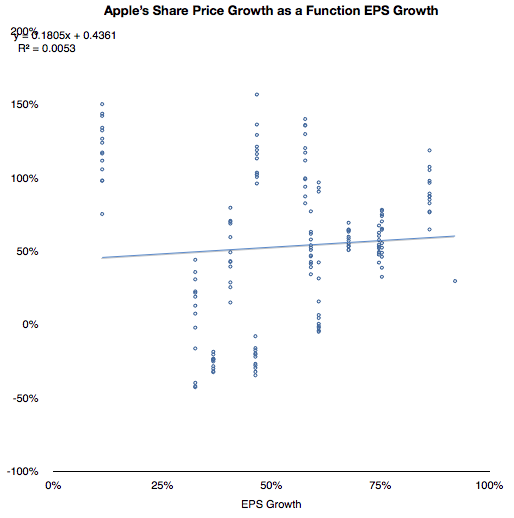
    With the outlying quarter when 154% growth was matched by a negative 50% price change, the correlation does not look much better:

    If we cannot correlate share price with growth then what is being valued? This has been a vexing problem because growth is the traditional, and logical, metric of valuation. Share prices, by definition (net present value of future cash flows) reflect future potential. That potential is more sensitive to growth than to anything else.

    But I've been leaving one factor out of the share price definition. Share price is NPV of future cash flows plus current assets.

    Since future cash flows are being thrown out of the equation, the company must be valued as a multiple of its cash. Does this relationship hold true?

    In the chart below I show the weekly closing price of the shares and the corresponding value of the interpolated cash (and marketable securities) per share over the last two and a half years.

    A strong correlation can be observed. The R squared value is a healthy 0.94. Of course this is not to imply causation. Correlation is not causation, but it is a hint.

    Can predicting the cash per share be a strong indicator of future stock price? Perhaps. As long as this relationship holds, then having a reliable earnings model would still give us a solid predictor for the share price. Not because we can use EPS forward estimates multiplied by P/E but because we can estimate cash flows and the increase in retained earnings.

    Of course, the market "is being irrational" because it values on the basis of the present only (not its future.) But who are we to argue? This valuation has held since October 2008.

    As far as the market is concerned Apple's future is irrelevant. Its value is defined as a constant multiple of cash.

  9. Is Apple a candidate for acquisition?

    Research · 57 comments

    As shown in the Apple growth scorecard, the company's earnings growth is continuing at 75% with the top line increasing at the annual rate of 70%.

    The $59 billion of cash on the balance sheet has reached the equivalent of $64 per share yielding an enterprise value of $263 per share based on closing price of January 21st.

    The stock price has been rising but not outside a narrow P/E band. The following chart shows the stock price and the 15 P/E and 25 P/E bands that have bounded it for nearly three years.

    As previously observed, this overall share appreciation is not accounting for the growth in earnings.

    The trailing twelve months' earnings were $17.91 per share. Therefore the P/E ratio is now 18.2. Excluding cash, the P/E is at 14.7. However, that's based on 2010 levels of earnings. Those earnings are increasing very quickly.

    To account for earnings and their growth, I developed the following chart which shows the P/E and P/E/trailing-Growth for the stock.

    The P/E is fluctuating on either side of 20 but when considering trailing growth, comparable companies, the macroeconomic conditions and guidance the value of the company is reaching new lows.

    P/E/tG nearing recession lows

    Earnings were 75% higher in 2010 than the year before. So based on the growth, the rule-of-thumb ratio P/E/trailing Growth (P/E/tG) is 0.24. This ratio (where 1.0 is seen as "fair value") is the lowest since July 2009, during the first months of recession recovery. The trend for this ratio is down (see the burnt orange line in the chart above). It's not far from hitting the lowest point during the recession at 0.17.

    Now I'd like to reminisce a bit about that point in time. The stock had bottomed at $78/share[1]. It was trading at barely 3x cash and a P/E of 11 but growing 3x that level (32% in the slowest recession quarter but averaging much higher).

    So today we are at a similar point in valuation. The cash is at $64/share, shares are priced 5x that amount and the growth is 4x P/E[2]. Although analyst targets are less comical, there is still the sense of extreme despondency when looking at the valuation ratios.

    Guidance, Comparables and Macroeconomics

    Unlike two years ago there aren't the same dark clouds on the macro horizon. The company is also not as cautious on its guidance (guiding 63% EPS growth must be a new record for a post-holiday quarter) and there is talk of bubble in valuation for comparable companies. Netflix, Amazon, and ARM have eye-watering valuations relative to growth.

    A discount to the S&P 500

    And to round out the tragic tale, Apple's P/E is, once again, at a discount to the S&P 500 P/E (14.7 vs. 16.57 respectively).

    Given the new low in valuation contrasted with optimism on behalf of many (including management), on some forums there is discussion about Apple becoming the target for a take-over.

    There is some perverse merit to this logic. With $64 in cash, $25/yr in earnings and 75% growth it's so cheap that if credit were available, it would make a tempting candidate. Private equity could take it private and use the gigantic cash flow to pay off debt (in about four years). In bygone days, this would have been an easy pitch.

    Alas, the capital markets may not have liquidity for the size of the market cap Apple holds and I don't see any competitors able to get the leverage for an acquisition either. Or can they?

    ---

    Notes:

    1. In early summer 2009 some analysts put 12 month targets for the stock at $70, so their predictions were within $6/share to today's book value.
    2. A buyer of shares two years ago would only have to wait two years to have 80% of their investment sitting in retained earnings.  An investor who read the data from Apple and knew that the iPhone existed could not fail but be amazed.
  10. Remembering January 14, 2008: The day the market lost faith in Apple

    Research · 106 comments

    In a recent but recurring lament I asked why Apple shareholders are not being rewarded for the company's growth. I pointed out that there is no fundamental reason why the company should receive such a low P/E multiple (about 18 ex-cash trailing and 10x forward while maintaining 70% earnings growth for over a year).

    There were many objections in the comments. Most of them dealt with recent reasons why doubts might have arisen among investors: Android hegemony or some perceived lack of competitiveness leading to margin compression or some macro hangover from the recession.

    In this article I argue that none of these objections hold water. My argument hinges on the fact that there is a precise date when Apple ceased being seen as an exceptionally valuable company and that date precedes any of the causes being suggested.

    The day of disillusionment was almost exactly three years ago: January 14th, 2008.

    How to pin down the date of disillusionment

    Consider the following chart.

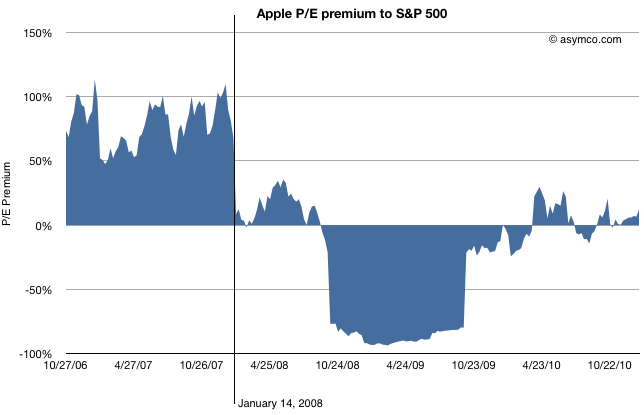
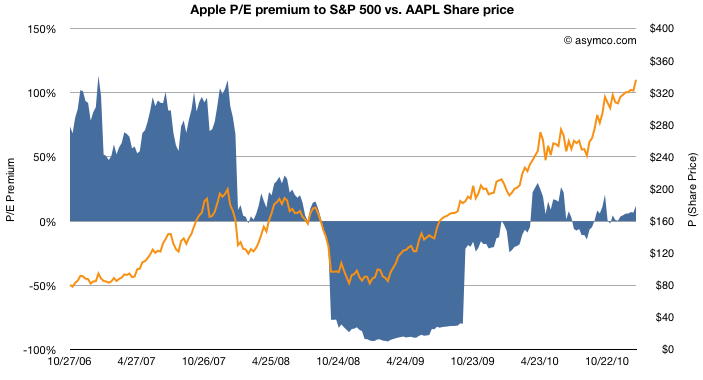
    The blue area represents either a premium (above 0) or a deficit (below 0) of Apple's P/E (ex-cash) relative to the S&P 500 P/E. This is a re-imaging of a chart, first introduced in June 2010 when I first pointed out that Apple was being discounted relative to the S&P 500.

    By measuring P/E I am focusing not on the stock price, which has grown nicely, but the ratio of the price relative to earnings, which hasn't (see the next chart below). P/E is a fundamental measure of potential (its reciprocal is the stock's earnings yield.) It is usually highly correlated to the company's growth. If that P/E is uncorrelated to past growth, there is some significant discounting of future growth. It's the most significant (and simplest) measure of "faith" in a company.

    By measuring the company's P/E relative to an index of other large companies (S&P 500 P/E) we can assess whether the company's potential is being valued as extraordinary or whether it's being valued as ordinary. In other words we are measuring whether a company is "special".

    The chart shows that until January 14th, 2008 the company was valued at a significant earnings premium--a P/E consistently 50% higher than the norm.[1]

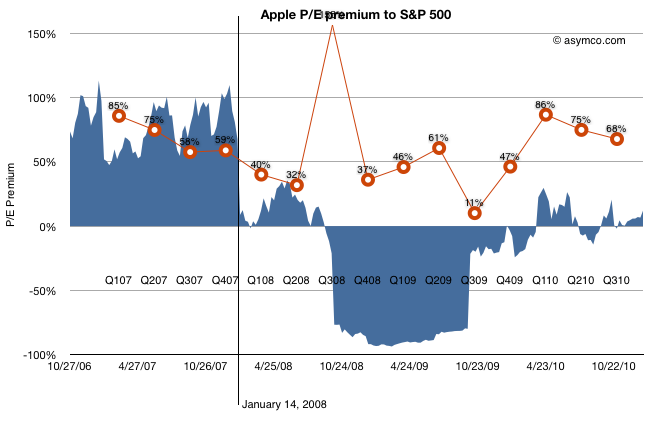
    Following the collapse (about 40% drop in share price but 100% drop in P/E premium), there was a small recovery followed by a huge trough in valuation. During the recession quarters Q308 to Q309 S&P earnings fell to zero or below. As a result of S&P earnings collapse the S&P P/E shot up astronomically (as E approaches zero, P/E approaches infinity). Apple's earnings dropped as well but remained positive throughout that period bottoming at 37% growth(!) in Q408. As a consequence Apple's P/E fell as low as 11 while the market's went well above 100 (122.41 peak). The P/E deficit for Apple went 80%: Apple was valued as basically worthless (3x cash).

    After the earnings recession, the S&P P/E recovered close to historic levels but Apple's P/E did not. It's in-line with the S&P but does not obtain the 50% premium preceding the recession.

    So we can establish that the day that Apple's potential was discounted was nearly six months before the onset of recession.

    What other discounting factors can we discard?

    How about earnings growth itself? Did the collapse foretell an earnings collapse?

    The chart above shows the P/E premium vs. earnings growth (in red). Although earnings growth began to slow soon after the 14th (earnings for CQ407 were not yet announced at that point), growth recovered six months later after the launch of the iPhone 3G[2]. Growth continued throughout 2009 and 2010 reaching new heights last year of 86%.

    Still, the company received no premium to the S&P 500 P/E. Companies in the index averaged, at best, a quarter of Apple's growth in earnings.

    What about Android? The first Android device did not ship until October 2008 (HTC Dream or T-Mobile G1). There were no appreciable Android volumes until 2009, one year after the drop in relative value and no talk of a threat until 18 months later.

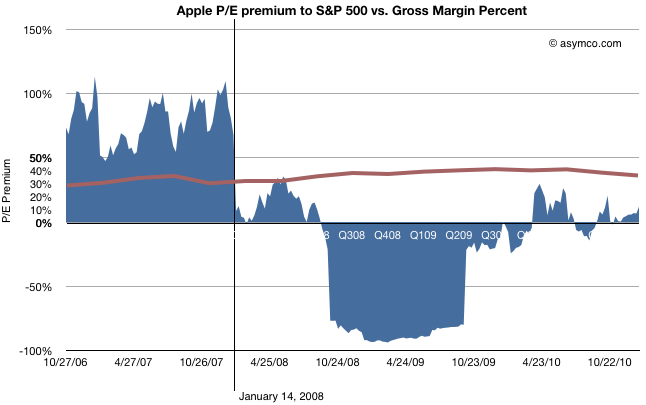
    The last objection to be put aside is that of margin compression.

    This last chart shows how margins (in brown) behaved during the same time period. They went up. The only slight decline took place during the last few quarters, after the launch of the iPad, long after the collapse.

    Regardless of the adjustments with product launches, Apple's GM is the envy of the world and is not at all correlated with the loss of faith in the company.

    So What happened on January 14, 2008?

    Having led you this far in the story, I'm afraid I'm going to let you down at the end: The cause for the loss of faith is a mystery to me.

    There is only one noteworthy event that took place on that date: Macworld 2008 (January 14-18). During the keynote, Steve Jobs introduced the Macbook Air (and Time Capsule and Leopard and pre-announced the iPhone SDK which, six months later led to the app supernova). I remember that day and I remember that the stock began selling off exactly at the point when the Air was mentioned. It has never been the same since.

    Obviously, correlation is not causation. The Macbook Air need not be the cause for the loss of faith in Apple as an investment. Or can it? I'm hoping someone can explain this because to me it makes no sense. The product was not a home run but it did not do badly either and its current incarnation seems to be a hit. Whatever sins the original Air may have had have surely been expurgated by now.

    Regardless the cause, the bottom line is that, in the eyes of investors, Apple stopped being "special" that day. Its valuation dropped to in-line the S&P and, given its growth, well below what a large growth company should be worth. The company's shares went into the bargain bin and are still there today.

    ---

    [1] I should point out that the P/E ratio is based on post 2009 re-stated earnings. The restatement changed the P/E as the "E" changed. This was based on the abolition of subscription accounting for the iPhone. Although it may seem unfair to hold the market to this standard, restatement did not actually change cash flows which were transparent and visible to all, even to amateurs such as myself and the other unaffiliated analysts that published throughout this period. Earnings may be an opinion but cash flow is a fact. Valuation on the basis of cash flow should have yielded the same results as shown above.

    [2] That quarter showed a y/y growth of 150% while the stock was in freefall. In fact, it was during that earnings day that Steve Jobs came on the conference call and pointed out the astronomic iPhone cash flow to an audience of analysts more concerned about their own jobs.

  11. Apple trading even with the S&P 500

    Research · 7 comments

    From the Apple 10K:

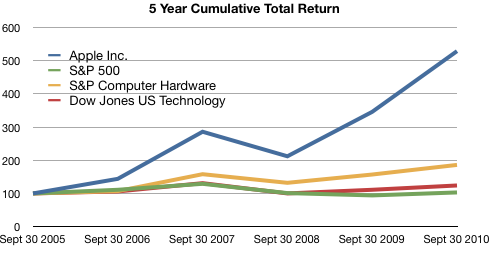
    The following graph shows a five−year comparison of cumulative total shareholder return, calculated on a dividend reinvested basis, for the Company, the S&P 500 Composite Index, the S&P Computer Hardware Index, and the Dow Jones U.S. Technology Index. The graph assumes $100 was invested in each of the [securities].

    In other words, if you had invested $100 in the S&P 500 in September 2005, you would have $103 now. If you invested $100 in Apple in September 2005, you would have $529 now.

    Apple investors should rejoice!

    However, in terms of reward for earnings, consider the following graph:

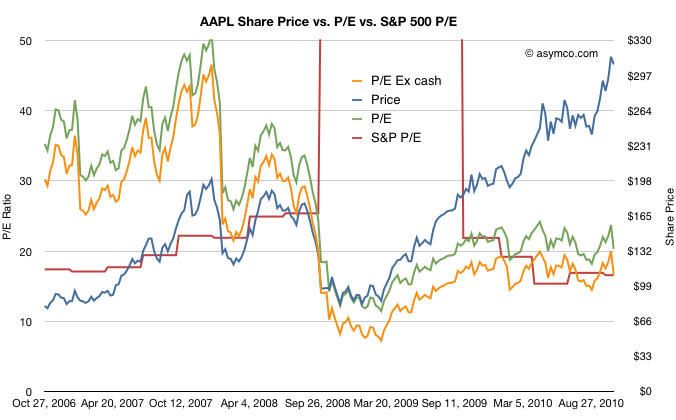
    The red line represents the S&P 500 P/E ratio and the green and orange lines represent Apple's P/E ratios depending on whether you include cash in the price.

    The reward to investors Apple does not seem so appealing anymore.

    Although Apple received a premium valuation to the S&P prior to October 2008, it has traded at a discount or in-line with the S&P since then.

    Another way of putting it is that the P/E ratio for large companies has returned to pre-recession levels. The P/E ratio for Apple has not.

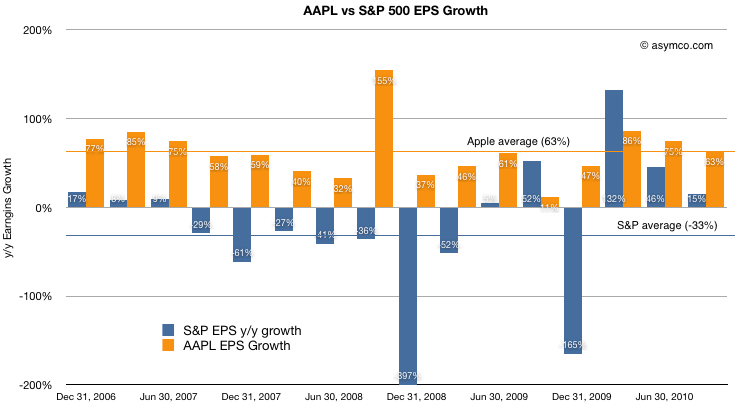
    For a final point, a comparison of earnings growth (which should correlate to the P/Es) above shows that while the S&P is given a similar valuation to Apple, growth has been decidedly less spectacular.

    Apple's average growth over the period shown was 63% (shown as the orange line) while the S&P has grown at an average of -33%. Nevertheless the market has chosen to reward the two assets with the same multiples valuing their future growth in earnings roughly the same.

    At least they are equivalent. For much of 2009 and early 2010, Apple was considered to have a far less promising future than the average large American company.