Asymco

Asymmetric Intelligence

Xbox

  1. Orthogonal Pivots

    Research · 16 comments

    Microsoft has announced that by the end of the year the Groove music service will be phased out. Users are being offered the option to move their music libraries into Spotify.

    This brings to an end a long story of Microsoft in the music distribution business. It started nearly 15 years ago with technologies in Windows that allowed for purchase and playback of various media formats. Microsoft sought to enable a large number of music retailers to market music through its formats and DRM and transaction clearing.

    Services such as AOL MusicNow, Yahoo! Music Unlimited, Spiralfrog, MTV URGE, MSN Music, Musicmatch Jukebox, Wal-Mart Music Downloads, Ruckus, PassAlong, Rhapsody, iMesh and BearShare and dozens of hardware players licensed Windows formats. Almost all of these services have shut down and the devices disappeared.

    The next stage was to offer an integrated experience through the Microsoft Zune player and Zune Marketplace music service. This too failed and was replaced by the Xbox Music brand in 2012. On July 6, 2015, Microsoft announced the re-branding of Xbox Music as Groove to tie in with the release of Windows 10.

    There was a time when Microsoft was thought of as the certain winner in media distribution. Inserting media into the Windows hegemony was classic "control point" strategy: owning the access points was a sure way to collect a tax on what transacted through the network.

    Instead we are facing a market where media is consumed through new access points: phones, tablets and TV boxes. Netflix, Spotify, Roku, Google, Amazon and Apple are all offering distribution and some are investing in original programming.

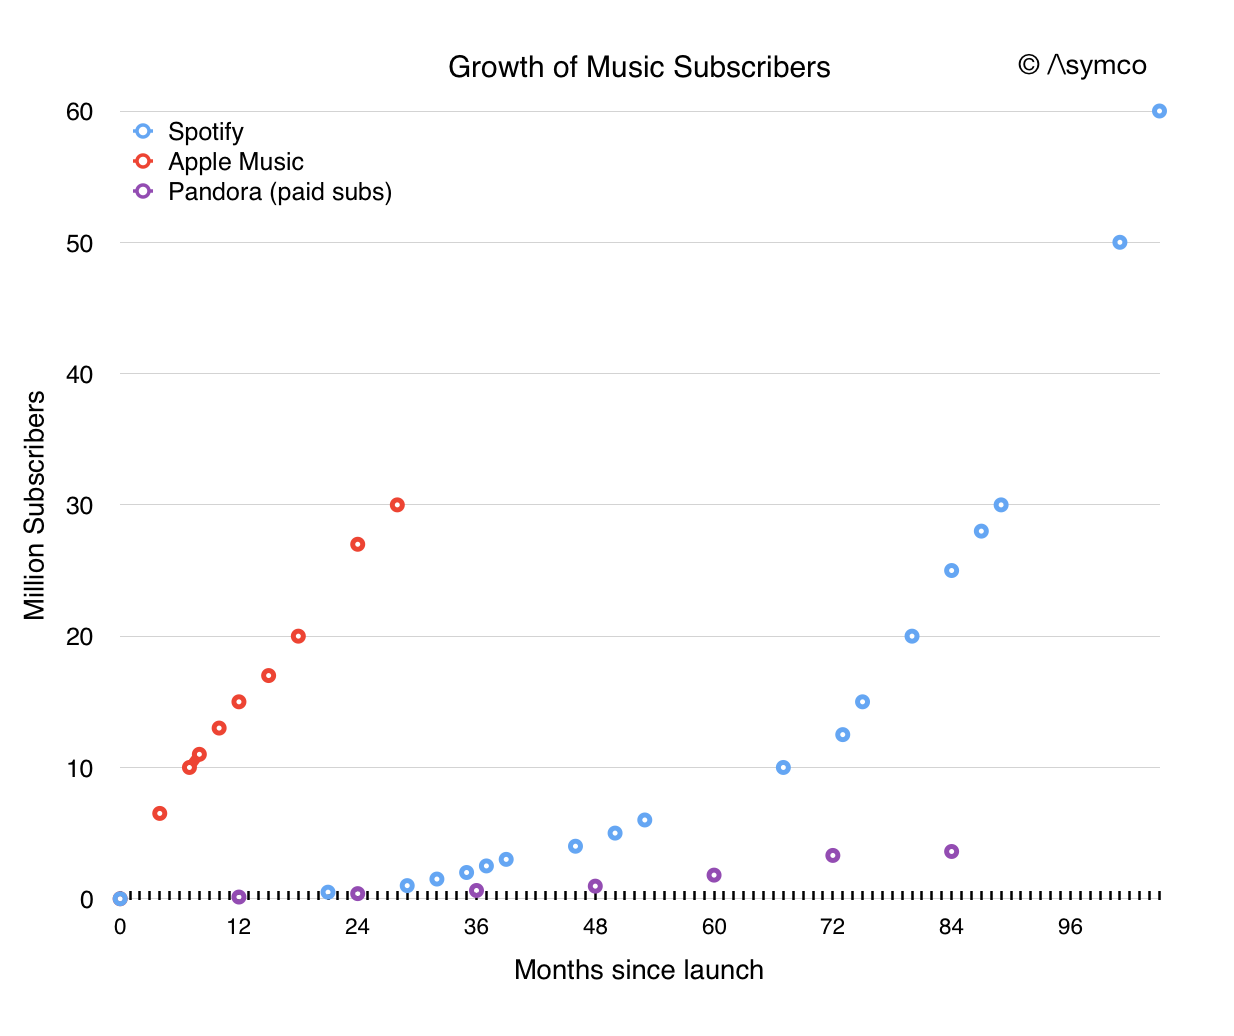
    It's perhaps worthwhile to recall that Microsoft and Apple both started their media efforts around the same time. Apple's iTunes is 16 years old and the iTunes Music Store opened in 2003, almost 15 years ago. Today Apple is transitioning to streaming with 30 million subscribers. The graph below shows the history of subscription growth to Apple Music and Spotify.

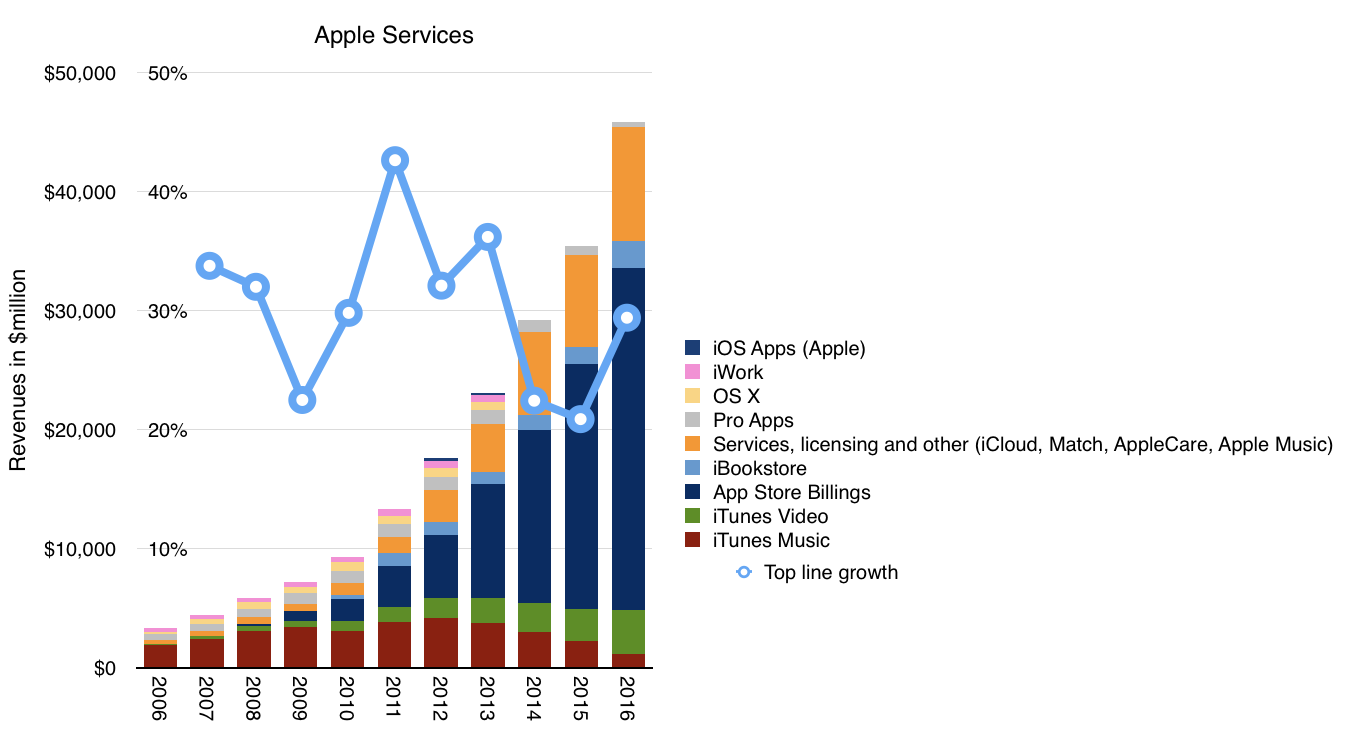
    Apple Music is a small part of Apple Services (part of the orange area below).

    On a yearly basis Apple Services are this year crossing the $50 billion gross revenue run rate. This year Apple released a new Apple TV 4K and is releasing a new smart speaker called HomePod.

    The contrast between Microsoft and Apple is most visibly between the Mac and PC. But the story of how media paralleled mobility and how Microsoft struggled with both is perhaps a cautionary tale.

    Microsoft saw the limits of modularity when new product categories emerged and when new user behaviors were created. They attempted to pivot into being more integrated but those efforts also failed. The efforts continue today with Surface devices; looking forward they will continue with AR/VR and perhaps a pivot of Xbox..

    But the long arc of history shows how hard it is to succeed in vertical integration after you build on horizontal foundations. Generations of managers graduated from the modular school of thought, specializing rather than generalizing. Now they are facing an integrated experiential world where progress depends on wrapping the mind around very broad systems problems.

    Entire industries are facing this orthogonal pivot: media, computing and transportation come to mind. Huge blind spots exist as we see only what we've been trained to see.

  2. The newly integrated company

    Research · 25 comments

    During the first quarter of fiscal year 2014, we changed our organizational structure as part of our transformation to a devices and services company. As a result of these changes, information that our chief operating decision maker regularly reviews for purposes of allocating resources and assessing performance changed. Therefore, beginning in fiscal year 2014, we are reporting our financial performance based on our new segments; Devices and Consumer (“D&C”) Licensing, D&C Hardware, D&C Other, Commercial Licensing, and Commercial Other.

    The previous reporting segments were:

    • Windows & Windows Live
    • Server and Tools
    • Online Services
    • Microsoft Business
    • Entertainment and Devices
    • Unallocated and other

    The new are:

    • D&C Licensing: Windows OEM licensing, Consumer Windows, Consumer Office, Windows Phone (including related patent licensing)
    • D&C Hardware:  Xbox 360, second-party and third-party video games, and Xbox LIVE subscriptions; Surface; PC accessories
    • D&C Other: Resale, including Windows Store, Xbox LIVE transactions, Windows Phone Marketplace; search advertising; display advertising; Subscriptions including Office 365 Home Premium; Studios including first-party video games; retail stores.
    • Commercial Licensing: Windows Server, Microsoft SQL Server, Visual Studio, System Center; Windows Embedded; volume licensing of Windows; Microsoft Office for business (Office, Exchange, SharePoint, and Lync); Client Access Licenses;  Dynamics, Skype.
    • Commercial Other: Enterprise Services, including Premier product support services and Microsoft Consulting Services; Cloud Services, comprising O365, other Microsoft Office online offerings, Dynamics CRM Online, and Windows Azure.

    From Microsoft's FY14 Q1 10Q via Microsoft Investor Relations - Press Releases

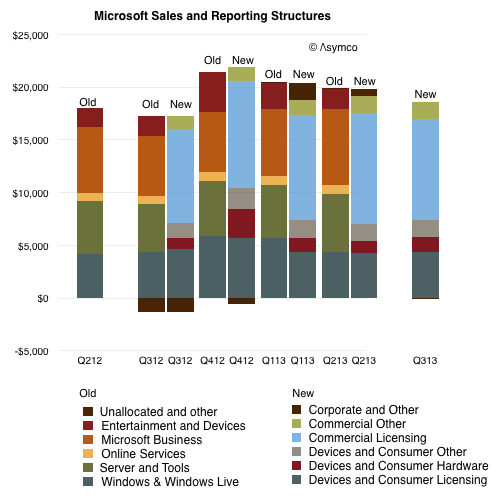
    The mapping between the old and new is not straight forward. There is overlap between D&C Licensing and the old Windows and perhaps between Entertainment and Devices and D&C Hardware but there are many gaps. There is also some overlap between the old "Business"/"Server" segments and the new "Commercial" but, again, they cannot be matched.

    I show the difference between the two structures in the way revenues are allocated below, using color to try to show similarities.

    Screen Shot 2013-10-25 at 10-25-11.25.07 AM

    Given the re-stated quarters it's possible to compare one year's historic performance at a segment level. For example, the company states that "Devices and Consumer revenue grew 4% to $7.46 billion" while "Commercial revenue grew 10% to $11.20 billion".

    Since we don't have data older than one year, our ability to assess the company over longer time periods will be drastically reduced and a new picture will take a long time to emerge.

    There is however one aspect of the new structure that needs to be appreciated right away: the allocation of costs has changed fundamentally. The company explains:

    Cost of revenue is directly charged to the D&C Hardware segment. For the remaining segments, cost of revenue is directly charged in most cases and allocated in certain cases, generally using a relative revenue methodology.

    We do not allocate operating expenses to our segments. Rather, we allocate them to our two segment groups, Devices and Consumer and Commercial. Due to the integrated structure of our business, allocations of expenses are made in certain cases to incent[sic] cross-collaboration among our segment groups so that a segment group is not solely burdened by the cost of a mutually beneficial activity as we seek to deliver seamless experiences across devices, whether on premise or in the cloud.

    [my emphasis]

    In that brief paragraph Microsoft has formally and in a financially binding way declared itself to being a functional organization. ((Welcome to the club.))

    The mechanism seems banal: operating costs are no longer assigned to product divisions but to two large buckets. In practice this means that profitability (P/L) cannot be assessed or assigned to individual managers. The lack of P/L responsibility means that incentives from top to bottom have to be re-engineered. If this goes wrong, the Assets ((read: people)) of the company could evaporate.

    If the assets go, then processes and priorities are for naught.

    In other words, what the company is undertaking is a priority shift (to a  functional structure to create integrated experiences) which requires a process change (whereby employees work according to new incentives) while preserving the fragile assets the company depends on (a motivated and skilled base of employees.)

    This makeover is as ambitious as a re-org gets and the context, scope and target are as difficult as they can be. This is, after all, the largest software company operating the the most dynamic industry whose multi-sided markets are notoriously volatile due to disruptive forces.

    The challenge also suggests why Ballmer left and who should replace him. A priority transplant operation requires a different set of skills than those held by the manager who created the processes for the previous set of priorities. That's the manager's dilemma: even if you foresee the changes needed and push for them to be enacted, your reward might be to be replaced by someone who can make the changes happen.

    Those who envision and persuade for change are rarely allowed to enact it.

  3. Game over

    Research · 237 comments

    In the "Race to a Billion" there is a graph showing Android reported activations and iOS cumulative unit sales alongside cumulative console sales. The contrast between mobile phone platforms and game consoles is striking, with an order of magnitude difference in consumption. The best performing console to date is the Wii with about 100 million units sold so far.

    [UPDATE: Thanks to Danny Nemer cumulative sales of Sony's PlayStation 2 (using production shipments from FY 2000-05 and recorded sales for FY 06-12) is 155.81 million units]

    However, that is an incomplete picture of the game platform business primarily because consoles are not the entirety of the business. Mobile (but dedicated) gaming platforms have been sold for some time.

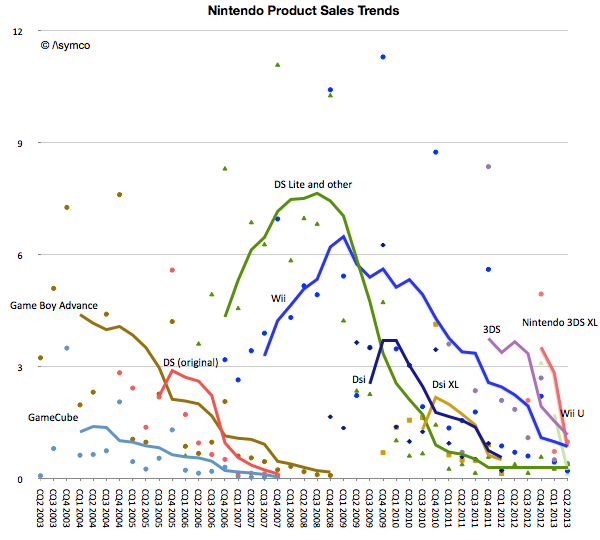
    To give a better picture of the game business we prepared the following graphs. The first shows Nintendo's product lines with actual unit shipments (shown as colored dots in millions of units per quarter) and the trend (shown as trailing twelve months' average trend lines).

    Screen Shot 2013-09-09 at 9-9-4.45.30 PM

    Note that fixed and mobile products are both shown on the same graph. The picture that emerges is that for Nintendo, its mobile platforms combined are more popular than its fixed consoles with a total of 186 million mobile devices sold since 2003.

    There is also a pattern of generational change. The GBA, DS and GameCube era was superseded by the DS Lite, DSi, Wii era. The Wii era (or generation) was significantly more popular than the GameCube generation. If there is a problem however, it seems to be that the new generation devices or consoles are not forming a new era. The Wii U and 3DS are not growing nearly to the level of the previous generations and have faded quickly.

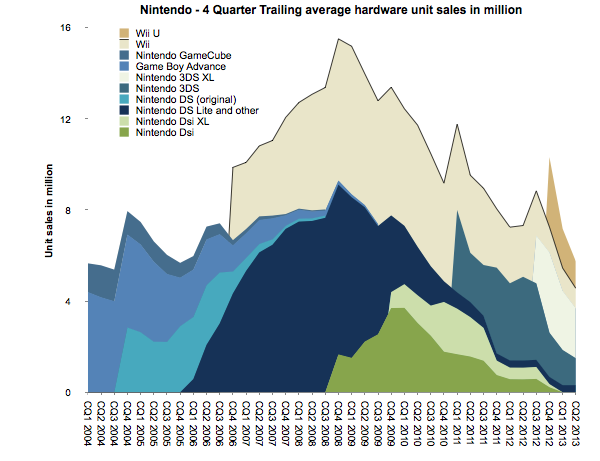
    To summarize, the unit volume graph for Nintendo is below. ((This is a smoothed graph showing what sales would have been if they had been evenly spread out over a 12 month period. The actual sales would total to the same area but would be much more seasonal and thus noisy.))

    Screen Shot 2013-09-10 at 9-10-10.25.23 AM

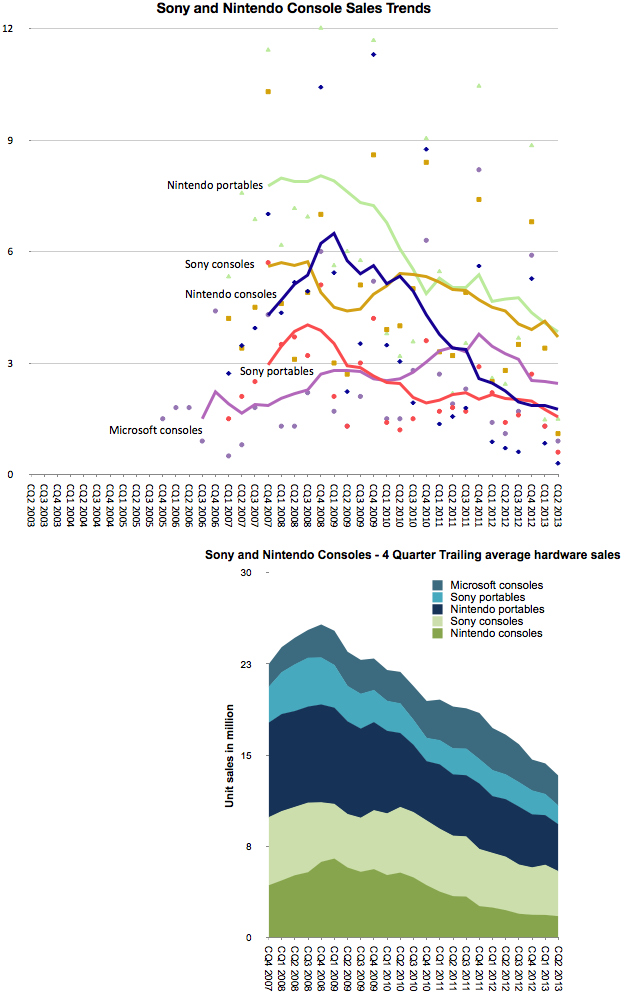
    To confirm that this is indeed disruption we should look at the pattern for another competitor in the console market: Sony. ((We would like to show the pattern for Microsoft but there is no regularly reported Xbox shipment data.))

    Screen Shot 2013-09-10 at 9-10-11.09.16 AM

    The graphs above combine both Nintendo portable/consoles and Sony portable/console sales. Note the similarity in patterns of growth. It's one thing to suggest that Nintendo consoles have "failed", it's another to show that Nintendo consoles and portables have failed, and yet another to show that two competitors in the games business seem to be failing in unison across all their product lines.  The cyclicality is also over a long period of time: The peak for the combined Sony/Nintendo was in 2008, five years ago.

    The chief criticism to the industry-wide view of decline is that there is a new generation of consoles right around the corner. This is the eighth generation of consoles which, it is presumed, will bring growth back to the industry.

    But the Nintendo 3DS, launched two years ago, was meant to kick off the eighth generation, and the PlayStation Vita was Sony's response. Then the Wii U was also billed as the successor to the Wii. They have so far failed to re-ignite growth. One might reply that they were merely appetizers and that the main  course of the next gen are the PS4 and Xbox One.

    Will they create growth again? Surely not for Nintendo, but I would argue that not for Sony or Microsoft either. There might be a burst of sales at launch as the hard core gamers upgrade, but they are unlikely to recruit new gamers the way the Wii did. In other words the PS4 and Xbox One are unlikely to win against non-consumption.

    That is where mobile is the clear winner. More people will hire mobile devices for their primary gaming activity.  And as mobile devices get inexorably better, they will be hired for use in the setting where consoles have been king: the living room.

    The implications are that Nintendo, Sony and Microsoft are beyond the point of no return in this industry. Gaming, as a business, cannot be sustained as a platform independent of a general purpose computer. Like other "applications" that used to have systems built around them conforming to their needs (( Applications such as word processing, financial calculation, media editing, music playback, etc.)) the dedicated-purpose solutions came to be absorbed into the general-purpose platforms. And the modern general purpose computer is the smartphone. (( One interesting question is why didn't the general purpose personal computer absorb console gaming. My answer is that personal computers could not conform to the experiences around the "10 foot" interface and still function well at their main jobs. In contrast, mobile devices through screen sharing have the ability to be much more malleable.))

    UPDATE: I added Microsoft console shipment data which became available after 2008.

  4. Switcher

    Research · 91 comments

    Nokia's Windows (Smart)Phone performance was drowned out last week by Microsoft's big announcement of the Surface inventory write-off. They are pieces of the same puzzle however.

    First, a look at Nokia.

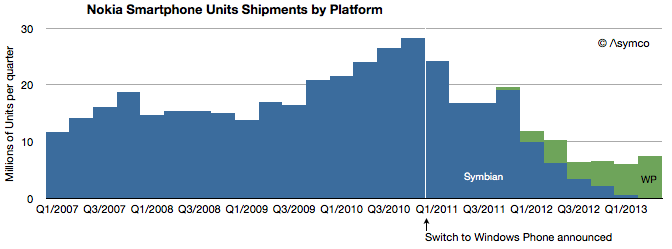
    There were 7.4 million Lumia phones sold in Q2 with 0.5 million sold in the US. Although Windows Phones grew sequentially from 5.6 million the previous quarter, and up from 4.0 million in the same quarter last year, total smartphones are down y/y and nearly flat over the last four quarters. This is of course because Symbian phones have finally disappeared from volume shipments. The following graph shows the history of Nokia's smartphone shipments.

    Although it's tempting to compare Lumia to iPhone (given the premium positioning in the US) the average price of €157 or $206 shows that Lumia is more adequately compared to Android. This is about a third of what Apple gets for its iPhones.

    That's not necessarily a bad thing. Nokia's always had a knack for mass-market phones and certainly that was one reason Microsoft was attracted to them. Presumably, the promise of the relationship was to insert Windows Phone into the Nokia development and distribution pipeline, squeezing out costs and filling up channels.

    Screen Shot 2013-07-22 at 7-22-3.24.21 PM

    The problem for the brand has been that although priced at Android levels, volumes are nowhere near and the gap is widening. At current activation rates, Android is selling 16.5x faster than Windows Phone (assuming 90% of Windows Phones are Lumia).

    So Nokia's problems become Microsoft's problems. As bad as Nokia seems to be doing with Lumia, it's doing a lot better than Microsoft with hardware. Here the story of the great Surface write-off should give pause. Microsoft announced that it would write off $900 million of Surface.  In terms of write-offs this is pretty significant. Compare it with the debacle of the PlayBook write-off when BlackBerry (then known as RIM) wrote off $485 million for tablets it could not sell. Or with Microsoft's own write-off for the Kin which took $240 million out of its shareholder's pockets. The only charge for hardware that I found higher was Microsoft's own Xbox 360 which cost it $1 billion for the "red ring of death".

    But this is not an unusual situation at Microsoft. Besides Xbox, Kin and Surface, Microsoft also declared victory in (read: shut down) SPOT watches, the Smart Display, Tablet PCs and the Zune. This is why when I heard about the Surface I asked who would be Microsoft's Tim Cook.

    By the way, $900 million write-off could amount to over 3 million devices, more if Microsoft is assuming some residual value in the inventory. Misjudging demand to such a degree that more units are disposed of than sold implies a basic failure of understanding of hardware businesses.

    Which brings up the question of what Microsoft will do. They are likely to double down on hardware (also signaled by their re-org) simply because in a device world (read: post-PC) the economics of licensing Windows and Office are evaporating. The price points of EULAs simply don't hold and there are good enough alternatives in use by the hundreds of millions of iOS and Android devices out there already. By withholding Office from iOS and Android, Microsoft has shown a billion people that they can live without it and they already knew they could live without Windows.

    So rather than fight, Microsoft chose to switch. Switching from software to hardware, however, is proving very hard. I'm sure quite a bit harder than management  thought.

  5. Measuring iOS as a gaming platform

    Research · 37 comments

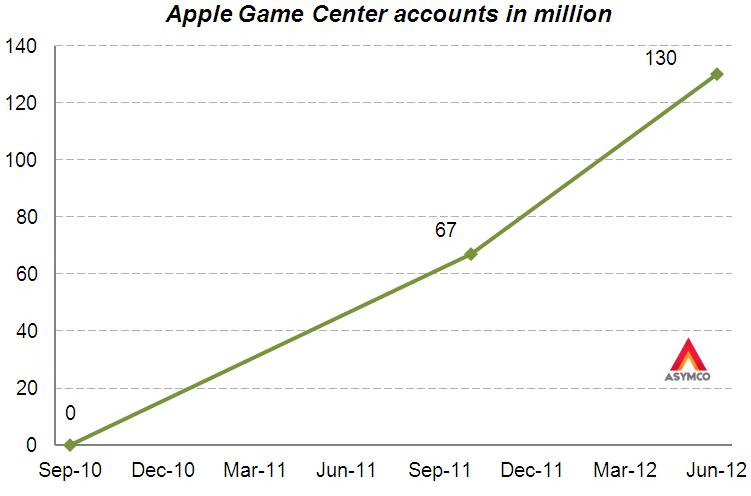
    At this year's WWDC Apple offered an update on Game Center accounts. The data we have so far is shown in the following graph.

    Before being acquired, another network, OpenFeint, announced 180 million iOS accounts in October 2011. Another figure to consider is the 40 million subscribers to Xbox Live (out of 66 million Xbox users). This subscriber base is paying for a service (about $1 billion per year) so it's not the same as the free Game Center model.

    Rather than being a revenue source, Game Center is designed to engage users and to capture usage information. It also lets us gauge gaming "consumption" on iOS devices. That itself allows us to contemplate it as a gaming platform vis-à-vis alternate platforms.

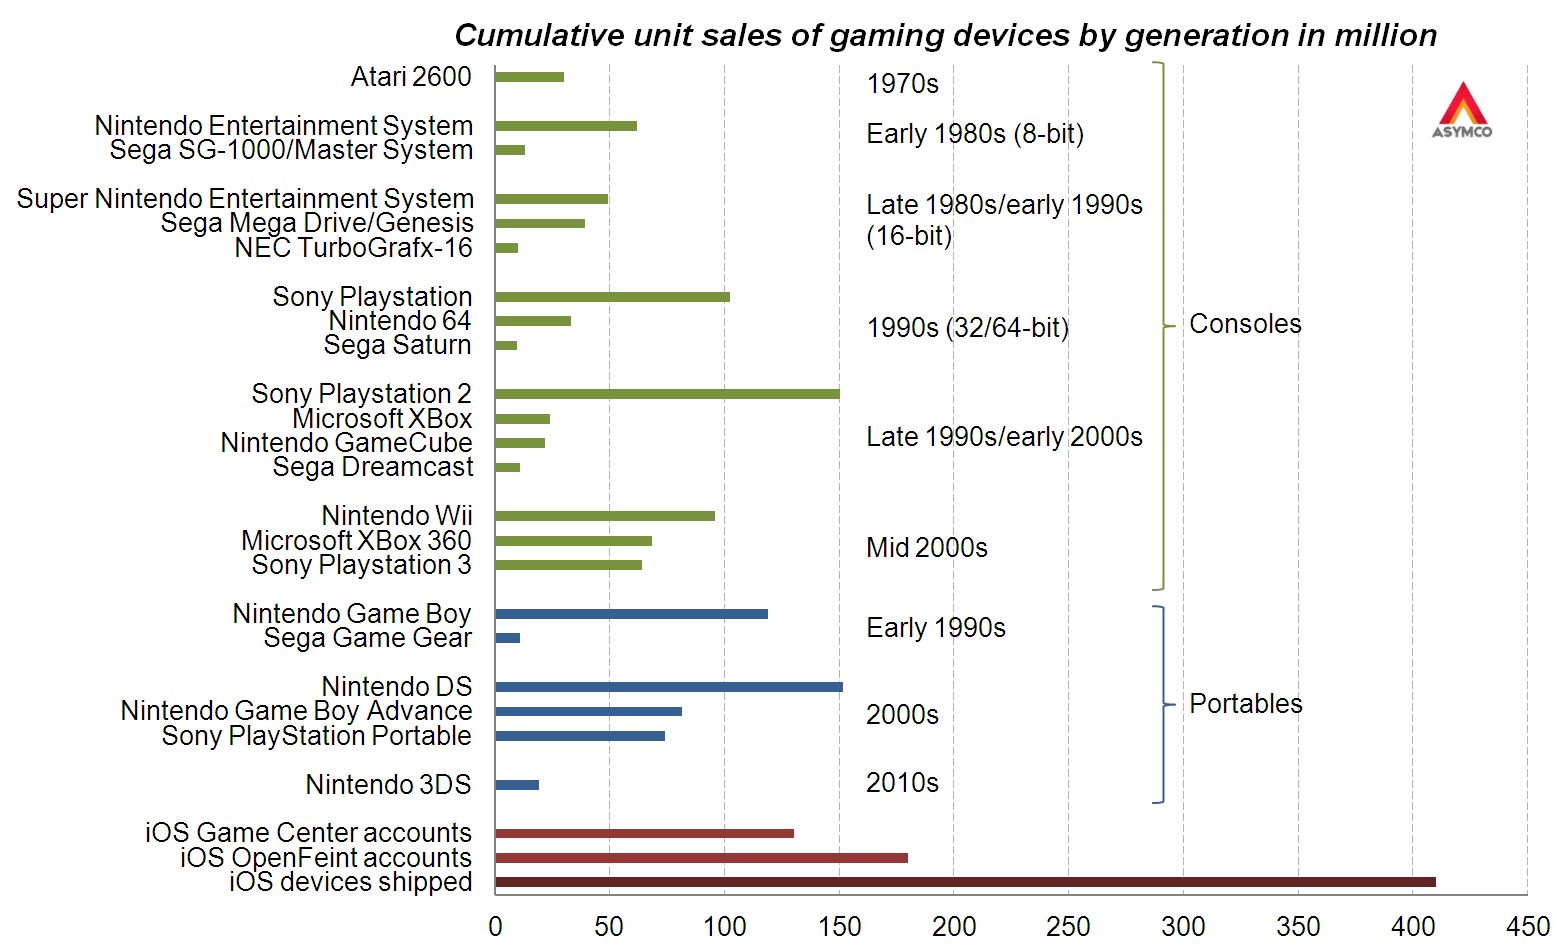
    To consider the figure as a proxy of penetration and engagement, the graphic below shows cumulative sales of gaming devices.[1]

    Here are some observations:

    • There is a pattern of turnover of market participants
    • Each console "generation" had a clear market leader
    • The best-selling gaming device was the Nintendo DS closely followed by the PlayStation 2 [2]
    • Considering the 130 million Game Center accounts, iOS is already the third largest gaming platform
    • Furthermore, considering the OpenFeint iOS figure of 180 million accounts announced in 2011, iOS has already surpassed the cumulative sales figures for the Nintendo DS
    • No gaming device has ever reached the 200 million mark
    • At the current growth rate the number of Game Center accounts will surpass 200 million before the year end

    Apple cites the number of games, downloads and payments to developers as evidence of ecosystem health and growth. The figure of Game Center accounts is yet another indicator. It shows growth in and of itself, but it also has the side effect of offering comparative measurement of performance. That measurement compares favorably with other game platforms.

    The economics are different but they always are when a disruption takes root.

    ---

    Notes:

    1. Based on reported cumulative sales (Wikipedia), excluding gaming devices with less than 10 million cumulative sales (excludes for example PlayStation Vita), excludes also “home computers” due to missing reported figures
    2. This Wikipedia article contradicts the previous.
  6. The parable of Nintendo

    Research · 109 comments

    With the launch of the Wii console, Nintendo averted disaster. When the Wii launched in late 2006 Nintendo had been facing the simultaneous attack from the "seventh generation" Xbox 360 which launched a year earlier as well as the PlayStation 3, both of which set as their bases of competition 3D graphics at HD resolutions. Many wrote off the company and called the console market a two horse race.

    Then, in what seemed a desperate downward leap, the Wii was launched into a different trajectory. It addressed non-consumers with a new, more intuitive controller and standard resolution rather than competing for hardcore gamers with more power and richer graphics.

    Because the Wii was asymmetric and addressed non-consumption rather than trying to be a "better" console in what was becoming a horsepower race, Nintendo expanded the console market. Its innovation was interesting enough that many hard core gamers used the console in addition to a PS3 or Xbox and many non-gamers bought it as their first console.

    The result is that 95 million Wii's have been sold vs. 66 million Xbox 360's and 62 million PS3's.

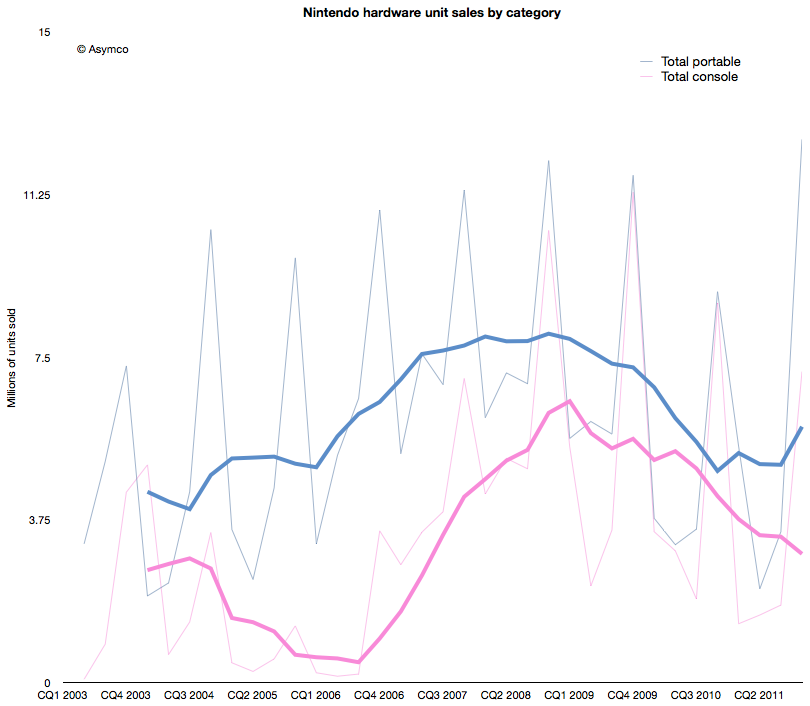
    The effect of the Wii introduction on Nintendo's console unit sales is shown below (pink line).

    The graph above shows that the growth from Wii has stopped. In fact, the console has been in decline since early 2009. Fortunately for Nintendo, the company also developed a mobile strategy. Learning from its Game Boy device, its DS series of portable game consoles allowed the company to diversify its portfolio. The graph also shows the total portable units sold in blue.

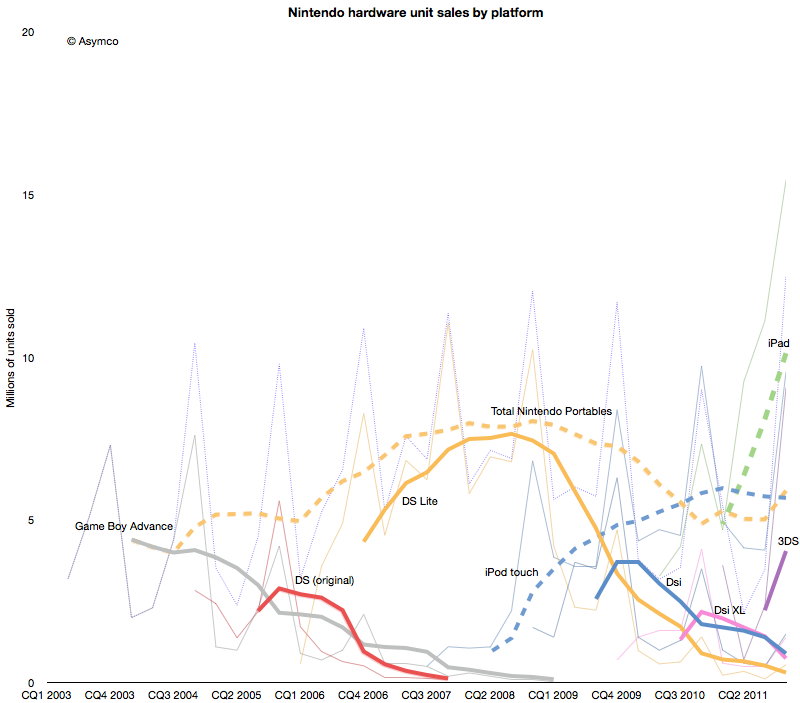
    However, this strategy has not been enough to protect the company from the disruptive effect of mobile computing. As the following chart shows, each new generation of portable from Nintendo has failed to break out of a general pattern of overall decline.


    Contrast the DS product patterns with the iPod touch and iPad--multi-purpose products whose game functionality is "good enough" but whose communications and general-purpose app catalogs are re-defining the basis of competition yet again.

    Nintendo bet on the 3DS to reboot the franchise. The 3DS product does show the characteristic initial spike in adoption but the level it launched at is far lower  than the level of the iPad. Nintendo has a big hill to climb to even recover the volumes it held in 2009. In contrast, the usurper Apple's volumes are doubling each year.

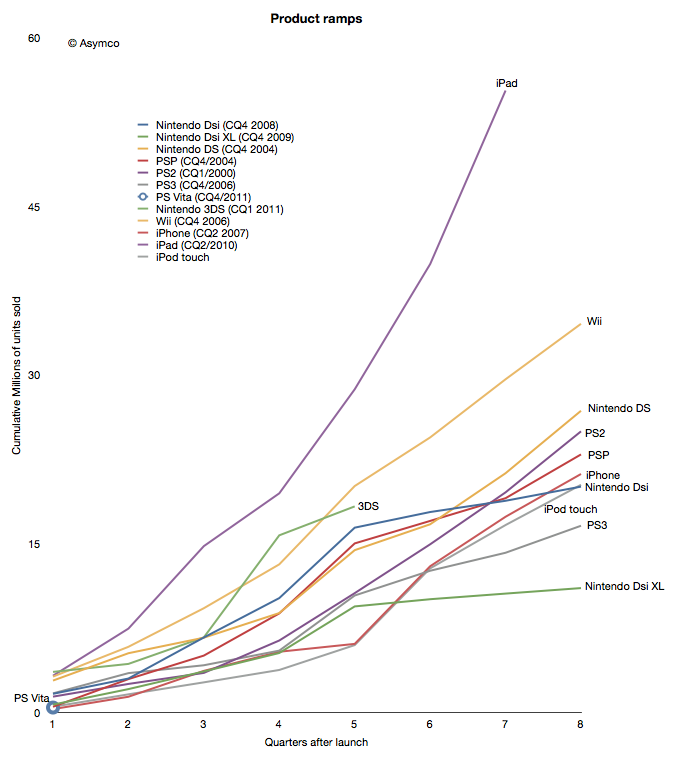
    When products are compared as "ramps" in terms of growth post-launch the story becomes even clearer.

    Although the iPhone and iPod touch ramped in similar ways[1] to the gaming platforms, iPad took an entirely different path. The 3DS benefited temporarily from a price cut but it seems to be returning to a well-worn trajectory.

    The data points a bleak picture for Nintendo. The Wii was a success due to its competitiveness vs. non-consumption of gaming. But another low end disruption took hold in 2007. Good enough games on phones and mobile computers are taking consumption away from dedicated consoles, both fixed and mobile.

    In addition, the rate at which game experiences are improving on iOS imply that they will overtake the "quality" of consoles in the not too distant future. Differences in distribution models also guarantee lower pricing for software for end users and enabling a far larger catalog of titles.[2]

    This may sound like another story of fortune gained and fortune lost. The inevitable "what goes up must come down" aphorism. We become used to this pattern and assume it to be axiomatic. But there are causes for each success and causes for each failure.

    The lesson here is that a company that disrupts does not necessarily survive. Long term survival depends on the ability for serial disruption. Serial disruption is an uncomfortable state for an organization to exist in. As the story above shows, disruptions are usually enabled by "desperate" necessity. Desperation is not something management is trained to aspire for.

    What management strives for is steady state satisfaction and predictability from intelligent planning.

    ---

    Notes:

    1. Though the iPhone ramp matched the consoles, the growth for the iPhone is persisting at 100% y/y five years into the product. This means it is outstripping all console installed bases by at least a factor of 2.
    2. The catalog is not only broad but deep in the sense that there are many new game concepts and experiments being tried. The app store is a vast testbed for game and entertainment ideas.
  7. The end of the dedicated portable device

    Research · 67 comments

    On October 27th, Nintendo published half year results for the fiscal year ending in March 2012. Management stated that the company lost over $900 million with a negative outlook. Nintendo cited weaker than expected sales of Nintendo DS hardware and 3DS software and Yen appreciation as the main reasons for the miss. Is this the end of Nintendo?

    Before we look more closely, here is a quick summary: The company is exclusively involved in selling game hardware and software. Their console platform is the Nintendo Wii, which will be followed by the Wii U late in 2012. The Nintendo DS and Nintendo 3DS are the company’s portable game consoles. The Wii and the DS are nearing the end of their product cycles. On the software side, the company is known for gaming titles such as Super Mario and Zelda. Nintendo also pioneered the licensing model to allow third-party developers to produce games for its hardware products.

    A closer look

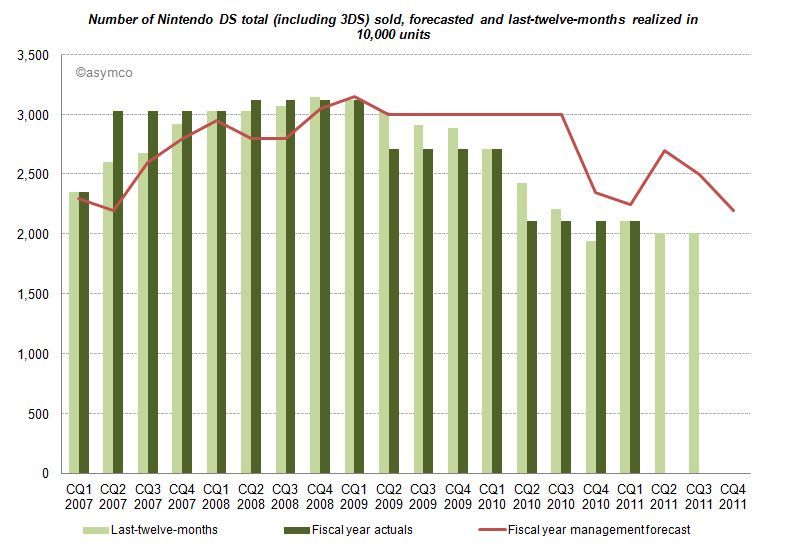
    The good news for analysts is that Nintendo publishes their estimates for hardware and software unit sales. This allows us to measure management predictive accuracy. The red line (management forecast) should be as close as possible to the dark green pillars (realized unit sales in the fiscal year).

    Until CQ1 2009 devices sales grew in excess of forecasts. A similar pattern can be found for consoles and game titles. After Q1 2009 forecasts have been always higher than results, and more worryingly, the deviation between forecast and sales is widening. Management missed and lowered forecasts for two consecutive years. Management's hope for an increase on the back of initial 3DS sales in the launch quarter (CQ1 2011) did not come to pass and they subsequently lowered forecasts again in the following two quarters.

    Looking at all categories, management lowered forecasts almost continuously. The deviation remains the largest in the portable hardware business segment indicating that management was largely surprised about the development.

    What caused this reversal of fortune?

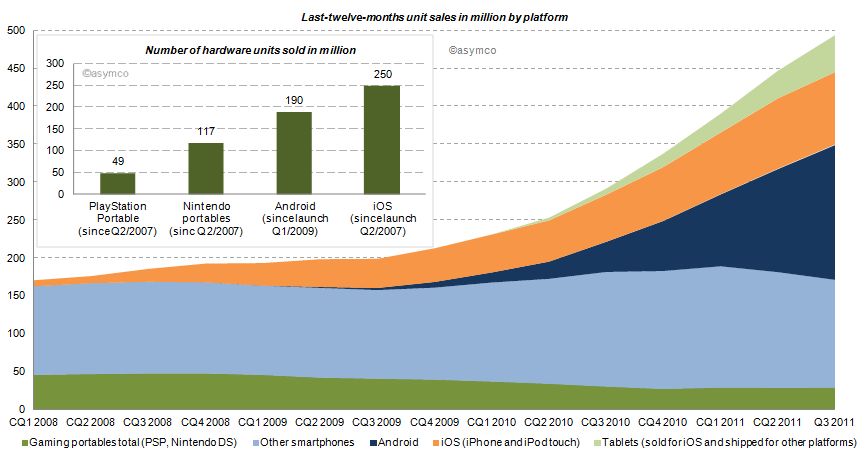
    Two years earlier the iPhone had launched and by CQ1 2009 iOS reached an installed base of about 38 million, half the number of Nintendo portables in the same period. Furthermore, in CQ1 2009 Android phones came to the market. Smartphones (light blue area of the chart below) sold before (and after) the debut of iOS, but the iPhone redefined the category and an avalanche of smarter phones running iOS and Android followed (blue and orange area). Portable gaming devices from Nintendo and Sony declined ever since: 17% in 2009, 31% in 2010 and already 16% in the last twelve months.

    How do the game players stack up?

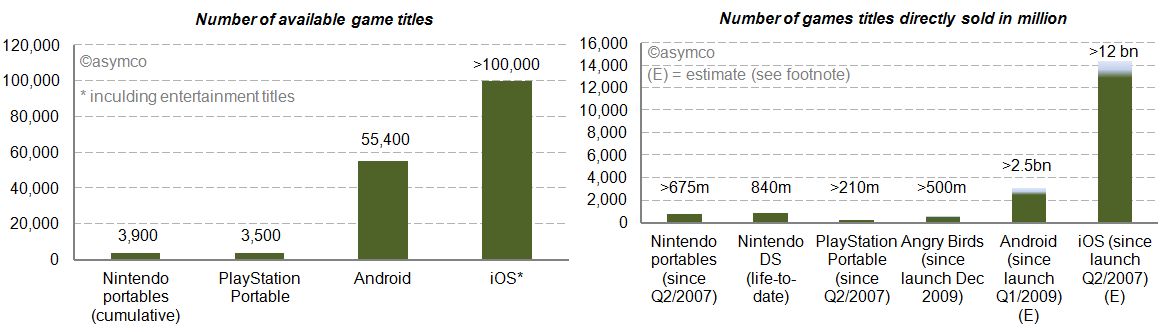
    We already looked at the installed base in the chart above. iOS and Android have outsold Nintendo portable units by a factor of 2.1x and 1.6x. Furthermore, we can see (in the charts below) that the two main mobile platforms have 14 to 26 times more game (and entertainment) titles available. Nintendo and Sony also publish unit sales of directly sold software titles. For Android and iOS we know the cumulative app download statistics. By taking the share of Septembers’ paid and free app downloads as a proxy, we can conclude that also by this measure Android and iOS dwarf Nintendo and Sony [1]. The reach of iOS and Android is further underlined by the more than 500 million downloads of Angry Bird game titles - first released only two years ago - for any platform having sold more than twice the amount of Sony’s cumulative portable game titles and almost as many as Nintendo’s cumulative games titles since Q2/2007.


    Who else has skin in the game?

    Besides Nintendo, Sony, Apple and Google, who else is making a push into mobile gaming? Before investigating, let’s first have a closer look at Sony. Sony, just like Nintendo, is also active in stationary gaming segment with the PlayStation franchise. The Sony group also has access to entertainment most notable through Sony Pictures Entertainment and Sony Music Entertainment. Furthermore, Sony recently decided to buy Ericsson’s stake in the mobile phone joint-venture Sony Ericsson and is making a push with Android to bring its gaming titles as a differentiator for its own products to the platform. And the other major suspects? Microsoft, also active in the stationary gaming segment with its Xbox franchise, is pushing to bring the Xbox experience to mobile phones with Windows Phone. Amazon has retailed software and games for years and has started to distribute software and games via direct download on its own Kindle devices but also for the Mac. On the Kindle, Amazon is relying on a forked Android version on which it leverages its eBook and other entertainment assets. And then there is Facebook, a social network that wants to be on any platform or device. Out of 800 million users, 350 million access Facebook via a mobile device. Around 50% of Facebook members play games on the desktop. With Project Spartan, Facebook is aiming to bring the desktop experience to the mobile device including a stronger focus on gaming and video.

    The competition between Apple and Google is already asymmetrical. Including the other contestants in the competitive landscape reveals Nintendo’s key weaknesses in the portable gaming market: attraction as a platform for developers in terms of ease and reach, pricing of hardware competing with operator-subsidized mobile phones and the jobs-to-be-done or value preposition. The new generation of mobile devices is standing against Nintendo’s dedicated approach. Although slowly adding features such as a browser and “app store” to its portables, Nintendo devices fall short in the variety of jobs-to-be-done compared to smartphones, let alone making a call.

    Average selling prices and financial impact

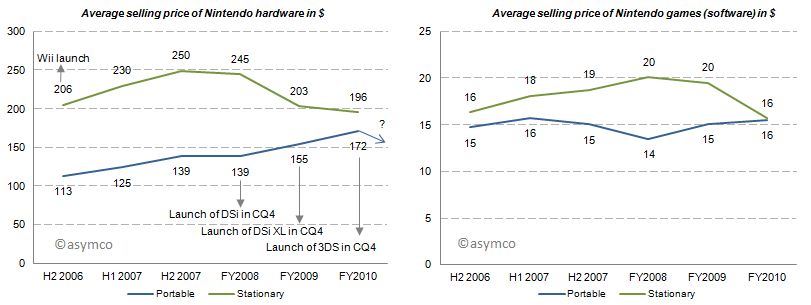
    With this market pressure one would imagine that average selling prices decreased for Nintendo portables. But for the last three fiscal years average selling prices for portables have increased, all things equal, mainly due to new product launches. Game title’s average selling prices have remained relatively flat. Note that these are wholesales prices for hardware and a mix of retail and wholesale prices for games. In 2011, for which we do not have data yet, the price of the newest portable, Nintendo 3DS, was lowered from its U.S. debut of 320 250$ in February to 170$ in July which will have a negative impact on ASP going forward.

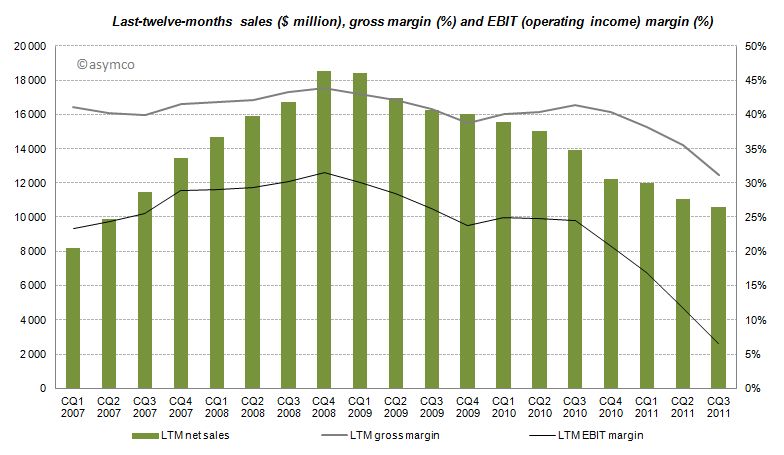
    The effects of Nintendo’s rigid strategy and the fast changing competitive landscape are manifested in the devastating financial performance over the recent quarters with LTM sales, gross margins and EBIT margins declining starting from CQ4 2008 and even accelerating to decline after CQ3 2010.

    Furthermore, even though the company has recognized its own difficulties, Nintendo has no intention of adjusting its strategy:

    CEO Iwata on the question of whether Nintendo plans to bring its game library to other platforms:

    This is absolutely not under consideration. If we did this, Nintendo would cease to be Nintendo. Having a hardware development team in-house is a major strength. It’s the duty of management to make use of those strengths. It’s probably the correct decision in the sense that the moment we started to release games on smartphones we’d make profits. However, I believe my responsibility is not to short term profits, but to Nintendo’s mid and long term competitive strength.

    Although realized and obvious, the disruption’s invisibility is often manifested in the paralysis of the incumbent.

    Conclusion

    According to Isaacson, Steve Jobs apparently always worried who could eat Apple's lunch. The lunch of the iPod, he concluded, was ripe for mobile phones. Subsequently, Apple entered the mobile phone space. Google followed. Since then more powerful mobile phones have eaten the lunch of the dedicated gaming device. The jobs-to-be-done and their priorities in people’s life have not changed, but the tools people use to get them done have. Permanently.

    ---

    Notes:

    1. Estimated by multiplying total cumulative app downloads with September’s share of game downloads: For iOS ranging from 72-80% based on Top 150 free and paid app downloads, for Android ranging  from 38-47% respectively. This is a very crude estimation, but the gist of it is that 4% for iOS and 11% for Android game downloads as percentage of cumulative app downloads would outsell Nintendo.
  8. The case against the Kindle as a low end tablet disruption

    Research · 232 comments

    In an Harvard Business Review post Rob Wheeler makes the case for the Kindle Fire as a disruptive innovation. I believe that it is but crucially I disagree that the Kindle Fire is a low end disruption.

    My assessment of the Kindle Fire is based on the two attributes which Amazon highlights as the key selling points which offer a basis of differentiation and potential for asymmetric competition: a low price and a new browsing model. I believe that these two attributes result in two opportunities: one for low end disruption and another of new market disruption. I reject the first and tentatively support the second.[1]

    The price

    It's immediately obvious that the price point of the Kindle Fire is well below alternatives. That forms the basis of disruptive potential, but before we jump to analyzing the disruption hypothesis we should determine whether and to what extent Amazon profits from the device directly. Profitability gives us a clue to where Amazon will apply resources and thus establish its trajectory of improvement.

    We know the margin on the Fire is low because we can calculate the bill of materials for 7" tablets. Gene Munster of Piper Jaffray estimates that Amazon "loses" $50 for each unit sold. We also know that the design Amazon used is essentially very similar to the RIM PlayBook and was sourced from the same ODM. RIM priced the product at $499 but has struggled to find buyers and is reluctantly dropping the price. We also can estimate that Apple with a product having more than twice the screen size is keeping modest (~30%) gross margins for at a price point approximately double that of the Fire. It does seem that Amazon does not have much or any margin to dip into.[2]

    So the Fire can be classified as a low price product. Does that make it a low end disruption?

    Disruption requires asymmetry but it also requires the ability to go up a trajectory of improvement along the basis of performance that a majority of users demand. The first condition is met, but what of the second? In a combined system where one asset is used to leverage another--the subsidized being sacrificed to benefit the profitable--success is conditional on one element being "good enough" while the other "needing improvement". Investment follows accordingly.

    But investment decisions have consequences. The subsidized device is starved of investment while the profitable service is nurtured. We see evidence of short cuts in investment in the off-the-shelf nature of Kindle products: from a second-hand (unsanctioned) OS to a second-hand (ex-RIM) hardware. Meanwhile, Amazon spends heavily on capex for the infrastructure that delivers the profitable content.

    If the hardware is indeed commoditized and cannot be usefully improved, then this model works. If, on the other hand, the hardware and systems software can benefit from dramatic improvements in technology then the model fails. The very asymmetry of a service vs. a product turns into the latter having all the advantages and the former failing to gain traction.

    I'll give three examples of this how service model creates limitations which lead to a failure to disrupt a product model.

    The Game Consoles

    The first is the game console business. In consoles, the vendors maintain long hardware product life-cycles to recover their hardware investment and subsidy by maximizing the number of games attached to each console. If you plot product cycles you realize that the bigger the subsidy, the longer the hardware lifecycle. The result is a very wide turning circle which prevents innovation in new dimensions.

    Consider that the Playstation or the Xbox could have been a low end computing disruption. The original Xbox was in fact a PC. It was supposed to bring PC dynamism to the console business and create a cottage industry of new developers building games on commoditized hardware. However by the second generation the Xbox was a locked down, custom architecture, pure gaming machine. Gone was Intel, gone was the PC architecture and gone was any dream of cheap development.

    This is entirely due to the economics of subsidized hardware. It compelled Microsoft, the world's greatest software company, built on the open and cheap PC architecture to make closed, expensive hardware. Sony followed in kind as did Nintendo. Each generation of consoles was a sustaining improvement on gaming and had no ambition beyond gaming[3]. The subsidy and the dependence on an integrated content value network led to a distinct lack of disruption and an insular industry which continues to seek out increasingly immersive experiences for increasingly demanding customers while itself being disrupted by casual, mobile gaming.

    The Set-top boxes

    The second example is the TV set-top box business. There again, the vendors maintain long hardware cycles in order to recover subsides. There too, the main value driver is the content and its distribution which stipulates the architecture, and through subsidy, defines its evolution. This offers the vendor no motivation to improve the user experience[4], secondary uses or the absorption of new streams of content (like those the internet can offer.)

    Again, the set-top box could have been a budding disruptive opportunity for Microsoft. They invested billions in the 1990s to acquire placement of software on set-top boxes in an attempt to penetrate the living room. And again Microsoft was not alone. Since then Tivo, Google and Apple and many others tried to attach cheap hardware to video streams. They all failed to get on a disruptive trajectory. And again, the blame can be placed on the stifling effect of subsidies and dependencies on services or content which dictate where the value and hence the investments should go.

    The Blackberry

    The third example is the RIM Blackberry. Although RIM made most of its money on hardware and was by no means subsidizing it, the differentiation of their product was undoubtedly its service value. Both as a corporate device with BES and as a consumer device with BBS, customers "hired" the product as a service. By being committed to this model RIM management became blind to the hardware and client OS software innovations coming down the pike.

    Through their own admission, they could not accept a touch screen because it would make the messaging experience too slow and it is messaging that sells Blackberries. They could not accept apps (and hence platform orchestration) as a differentiation because their customers did not hire Blackberries for "lifestyle apps". Merely being differentiated as a service leads to blindness and enough hesitation that you run off the disruptive rails.

    People ascribe myopia or incredible absence of mind to RIM's management but the opposite is true. They were deeply committed and observant of the things which made the Blackberry successful. It just happened to be something that stopped being relevant.

    The iPhone

    I'll add one more "bonus" example on this. The iPhone is also a subsidized product and it seems very successful. How come it won? The answer is in details. As I mentioned, the other products ended up in poor life cycles or incorrect motivations. The iPhone differs in that the lifecycle of the product is much shorter (2 years ownership with 1 year for product updates). The shorter lifecycle works for the iPhone because it has a very high service revenue base to dip into to offset the subsidy. Something none of the content models above could count on.

    Consider that each game console subsidy needs to paid off by a handful of game titles whose royalties to the console maker are modest. Or that the TV box needs to ride on top a service that also has thin margins from a stable or slightly shrinking user base. In contrast, the iPhone enables vast new consumption worth thousands of dollars to the operator. This is the famous ARPU uplift that smart phones enable. Users are doubling their telecom spending when they move to smartphones.

    The margins for Kindle content are thin. Very thin. Apple runs its content business at break even though it transacts billions of items per month. The amount of content that needs to pass through the Kindle ecosystem (with lower prices than Apple charges) will need to be astronomical to make it profitable on the shortened cycle time the iPhone enjoys. Thus the Kindle is likely to languish in a leisurely update cycle with users encouraged to hang on to their devices for years. This is the case at least with the original e-Ink Kindles. How eagerly awaited are new generations? How many users stampede to update the hardware or even upgrade the software? How many users have owned every version of the Kindle?

    Service Scale

    Finally one last point about services. As Amazon asserts, they see Kindle as a service, which, I concede, is asymmetric to a product business. The problem is that services don't scale as well as products. Consider that none of the content streams that Amazon will depend on are available outside the US. The Kindle has not been a strong seller internationally. This is because book rights are limited to national boundaries as are movie rights and song rights. Apple has only this week finally completed the rollout of iTunes music to all of Europe! A process that took almost a decade. And they are still unable to sell music in most of Asia and forget about movies or TV shows.[5]

    The reality is that there are no global service brands. Not in telecommunications (operators are, at best, regional), not in Media (TV, radio, publishing are a local businesses), not in Banking (not even in commercial banking) and not in Retail (even Wal-Mart was humbled trying to export its disruption). The internet has not broken down any of these boundaries and even Amazon has modest reach outside the US for any of their franchises. Services are local but products can be global.[6]

    To wrap up, this discussion on the asymmetry of device-based services to product models leads me to conclude that the Fire will not have the opportunity to disrupt the iPad or tablets in general. Amazon sees the hardware and software of a device as a commodity and the content and its distribution as valuable. This assumes that the device is "good enough" and will not require deep re-architecting or that new input methods can be easily absorbed. In short, they see the tablet as at the end of its evolutionary path. Apple sees the exact opposite. The iPad is 18 months old, and as they say in the ads, they see it as only the beginning.

    ---

    Notes:

    1. Due to length of discussion, in this post I will make the case against the low end disruptive potential and use a second post to make the case for it being a new market disruption.
    2. Presumably, Amazon will also distribute only through Amazon.com and thus not incur channel mark-ups. This means that comparisons with other tablets should be at a price nearer to 70% of retail.
    3. Gaming networks and video streaming are extensions but neither leveraged open architectures.
    4. See also discussion from June 2010 on the challenges to Apple TV that Steve Jobs enumerated.
    5. Apps are another story. Because it controls the medium, Apple can and does sell apps in every country where the iPhone or iPad or iPod touch is available.
    6. Note also that because of distribution through Amazon.com, the Kindle cannot reach as many buyers as a tablet selling through the tens of thousands of points of purchase that operators and retail shops offer.