Fourth quarter mobile phone industry overview
Research #Industry · 58 comments
by Horace Dediu
The following chart shows the units, sales and profit shares for the top eight phone vendors.
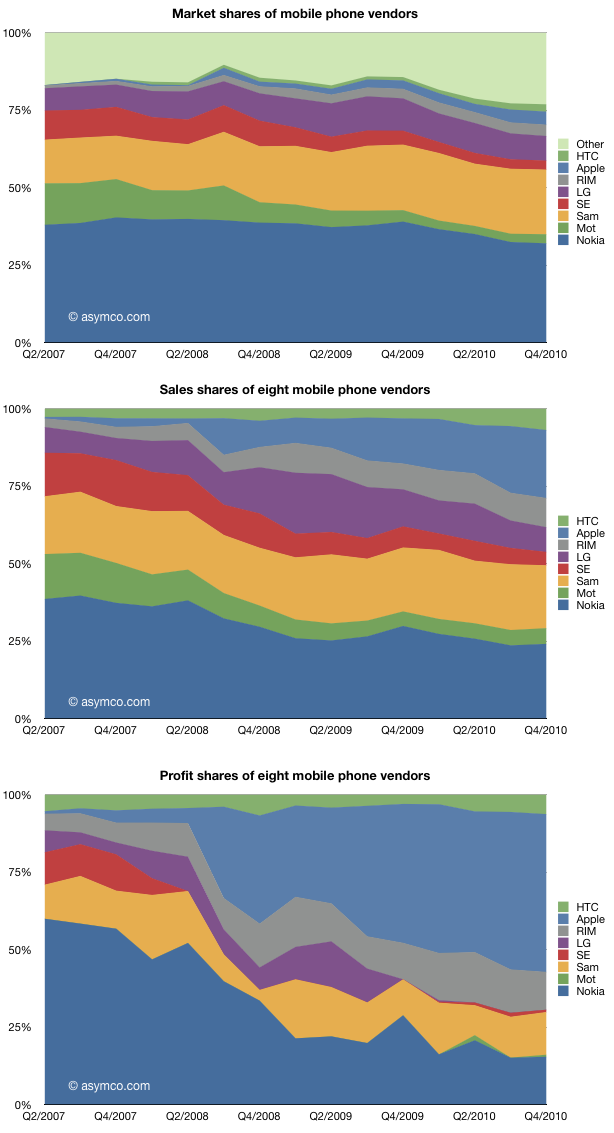
The fourth quarter did not see change in the ranking of the top eight vendors except for Sony Ericsson dropping in sales rank (to eighth). Samsung beat RIM to third spot in profit ranking, a position it held for most of 2009.
58 comments
rattyuk ·
It looks like Apple has eaten most of Nokia's pie.
Rob Scott ·
So integrated systems takes almost all the profits.
Frank ·
Everyone gives Nokia a hard time, despite still making a profit but obviously in difficulty while it sorts out where it's headed, yet you honestly have to wonder why MOTO and SE (and LG) even bother remaining in the mobile phone business... but because they sell Android, they're the darlings of the tech blogs and immune from criticism (or so it would seem).
KenC ·
What an amazing series of charts. Love the sequencing. What starts as just a trickle of share in the first chart, becomes a flowing river of Apple sales in the middle chart, and a biblical flood in the bottom chart.
KenC ·
And before people say what happened to Other, I hope people realize that calculating the sales and profits of dozens of tiny Chinese handset makers is impossible.
Fred ·
The first two diagrams are not 100% clear. If I am correct, the first one is in units sold, and the second one in revenue, right ?
@janovum ·
I think you might need to amend your definition of "top 8" - by some accounts, ZTE is now in the top 5, and based on their shipment numbers you'd have to agree. Although of course they don't publish them in the same way as your top 8.
Pieter ·
It will be almost impossible to calculate, but still, it is a bit of a pity... Although, as those are the 'tiny handset makers', you would not expect the sales and profit of those to be very large. I would expect the sales share to be less than the 25% of market share they have and the profit share to be even lower than that... (Otherwise, those 'tiny handset makers' would not be so tiny...)
@tommy4490 ·
And the ghostly and emaciated but still giant gorilla shoved off into the corner is Microsoft.....
gctwnl ·
Microsoft is in there, it is part of HTC, LG, Samsung and all the other Windows Mobile handset producers. Just as Google is there too.
mirmit ·
Both RIM and Nokia can be seen as Integrated Model in a similar way to Apple. Owner of the OS and HW platform, compare to the other. But doesn't seem to work same to everybody
asymco ·
For my data to be complete I need to be able to obtain not just units, but sales, pricing, and margin data which is usually only available from public companies. So perhaps I should say top 8 public vendors.
PanichUS ·
It's intereesting - RIM has raised shares % but dropped profit %. Motorola keeps shared % but profit % was raised. For all other 6 main manifactures we see that profit % curves are going accordingly with shares % lines. It looks like RIM spent more and more money to present QNX+TAT products to market and this is reason to expect their profit % values improvement in future.
Fred ·
HTC is hanging in there
Steve W ·
The Microsoft phones (Kin and what else?) are probably in the other. Did MS make a profit on their phone sales?
Rob Scott ·
Samsung is the strongest Android OEM. Apple absolutely dominates when it comes to profits.
Is it possible to do these charts but looking at OS'es, that is, iOS, Android, Symbian, Windows Mobile, etc.
@Bagelturf ·
It would be interesting also to chart this data in terms of velocity.
Create three charts using the same data as above. For each time period, show each vendor with a point representing how fast they are gaining or losing units, sales, or profit.
Brian ·
Great charts. I would like to see a chart of absolute profit as well. Afterall, if your share of profits was shrinking but total profits were rising, that would be ok.
terrorbite ·
It'd be interesting to see an absolute profit figure as well as the profit share figure. It'd be interesting to see how much the entire market has grown.
Steven Noyes ·
And if you add RIM, Nokia and Apple's profit share. Ouch. Integrated platforms are really outperforming modular platforms.
Hamranhansenhansen ·
Same as every other kind of device market except sub-$1000 PC's.
Hap ·
Would love to see some projections showing the leverage that even small gains in iPhone market share would bring on the bottom line.
I remember Steve on the Mac saying something (at the time) like, "We may only have 5% of the market, but a gain of 1% in market share would be a 20% gain in revenue."
Combine the amazing profit leverage for the iPhone with likely gain in Mac market share, and I think it'd make a very pretty picture.
@janovum ·
yes, that's kind of what I was thinking.
Pedantic ·
Please, Horace, quit talking about market share unless you qualify it as being either a) unit volumes, b) sales, c) whatever you actually are comparing.
I presume the incomplete title of the first slide was a "random accident", but this advice is valid to other bloggers as well.
Daniel Plainview ·
Drainage! Drainage! I drink your milkshake, Nokia, I drink it up!
famousringo ·
Samsung seemed to put in a really good performance this quarter, but it looks like they mostly just managed to regain lost ground and keep pace with market growth, turning feature phone sales into smartphone sales.
FalKirk ·
So far as market share, unit sales, and profit go, the Verizon iPhone is irrelevant. Apple is selling iPhones as fast as they can make them. If Apple had not agreed to sell iPhones through Verizon, Apple could just as readily have sold them all to China. While the Verizon iPhone will have a huge psychological impact all out of proportion to its sales numbers, the only thing affecting iPhone sales right now is production.
Apple has increased production of GSM phones from 9 to 14 to 16 million phones in the past three quarters. We may assume that those numbers will continue to rise. In addition, Apple has surely made and stockpiled a number of CDMA iPhones. Horace has estimated iPhone sales of 18.4 million in the upcoming quarter. https://fnayeri-ulqtb.wpcomstaging.com/2011/01/22/estimates-for-fq...
We'll just have to wait and see what Apple actually does.
@charbax ·
Apple's profits are plateauing before immediate imminent collapse. You can see it in plain sight. What matters is 2010 numbers, not before when major current Android makers were slow at realizing the smartphone opportunity.
The fact is Apple's iPhone growth is about 20% slower than the overall smartphone market growth. That is within a year since the Nexus One was released.
In the US market, I wouldn't be surprised if Android shipped 4x more than iPhone in 4Q 2010. The trend is only accelerating even further in Android's favor.
What happens then is carriers immediately loose confidence in Apple, they all flock to the plenty Android supply of choices, reasons are:
1. Price. 2. Vendor choice. 3. Customization.
What happens next, Apple's profit margins either are forced to shrink considerably overnight, market share stagnates which means halving of Apple's iPhone profits overnight. Or quite simply Apple stubbornly demands same profit margins and their market share is halved overnight. Both scenarios point to an Apple with half the profits within a year, a collapse of their market valuation, panic at APPL.
That guy ·
Short the stock. I dare you.
@charbax ·
You never know when the apple fanboys exactly will stop believing. You never know when they suddenly all realize they have invested in a $300 Billion company that has revenues and profits solely based on one increasingly fragile product: the iphone.
The safe thing is to sell when you are on top. It doesn't matter if the stock continues upwards tomorrow, as long as you sell for more than you bought, you are a winner.
asymco ·
The first sentence coupled with the other charts should make the definition of Market in the first chart clear.
Pieter ·
So, are you also shorting Microsoft and e.g. Exxon? Both have revenues and profits solely based on one increasingly fragile product product': Windows and oil.
KenC ·
Haha! Good one!
KenC ·
Strangely, noone else seemed to have any difficulty in sussing out the chart.
KenC ·
What's sad is that charbax has not read a single one of Horace's posts, if the above is his conclusion. Or if he has read one or more, he doesn't understand them, or he ignores them as fiction. Charbax, there are plenty of sites where you can influence people to believe your ravings. Try the Google Finance board, or the Business Insider board. Here, you're just going to get laughed at. Actually, come to think of it, you probably already do post at those other places.
unhinged ·
Absolute tosh. Apple's profits are based on iPhone, iPad, Mac and to a smaller extent Software, Music and Apps. Horace has provided ample evidence of this, and not to belabour a point, but Apple is struggling to meet iPhone demand.
As for your second comment, if you want to play it safe and be a "winner" by realising your small profit then go ahead. Apple has shown that by courageous strategy and mind-boggling effort it is possible to be a WINNER and consistently produce above-average sales results. The stock price is based on supply and demand of the stock right now, and all the hedge funds are happy with their weighting, but another few quarters of growth like the last one for Apple and the demand for their stock will increase yet again.
As Napoloeon Bonaparte said: Toujours l'audace!
iosweekly ·
Thanks for that - needed a good laugh.
Duane K ·
I was thinking that would be really interesting aswell - market, revenue, and profit shares by platform... but I doubt companies who ship multiple platforms (HTC, Samsung, LG etc) break down numbers by platform would they?
Steven Noyes ·
Wow, with bad "facts" like this, you should short AAPL and make us money.
The fact is Apple's iPhone growth is about 20% slower than the overall smartphone market growth. That is within a year since the Nexus One was released.
Thanks for the comedy relief.
Intosh ·
How can one make a chart about profit shares in smartphones when Apple doesn't even break down its profit for different products and services? What's the profit for iPhone sales alone?
asymco ·
They don't. There are analysts who try to break down the market by vendor and OS and region. Canalys comes to mind. However, their reports are usually expensive.
asymco ·
In the case of Apple the income statement offers sufficient clues to infer their profitability within a reasonable (<5%) margin of error.
@JaapFrolich ·
Awesome data! Nice job.
@jblossom ·
What is the sourcing of your profit data? Also, how do you scale it in terms of a percentage of the entire market?
Roger Markus ·
Do your profit charts include profit Apple makes from their laptops and desktops? I'm sure the markup is considerable on those.
asymco ·
Most companies report operating margins. For those who don't there are ways to estimate margins. The share of profit charts are built from the sum of all eight companies' operating profits.
Pedantic ·
Thanks for noticing my comment ;-) On second reading I actually noticed also the first sentence, but by then I had already read the more prominent chart title and got upset ;-) My comment was perhaps slightly harsh, but the fact is that "market share" on its own is an incomplete statement. And companies tend to report their "market share" in the terms that look best for the company, be it then volumes or sales. So therefore it's IMHO best to specify, whenever the term is used.
Intosh ·
How you do know whether the margins include apps and services for those mobile phones? Does Apple state the margins for iPod Touch, iPad, iPhone and app store separately?
Intosh ·
How can you dissect and separate the profits from phones sales and from app, services and licensing (e.g. accessories) for the said phones?
asymco ·
Each company gives some specific explanation of what they report in their income statements. Nokia for example includes "Devices and Services". Apple includes iPhone and services (but not apps). Samsung reports on "telecom" as a business unit which includes phones.
Apple does not state the margins on any of its products but gives overall margins. There is information on the cost of materials for most of Apple's hardware products. Music downloads, app downloads and peripherals can be easily estimated. Software GM is indexed on that of Microsoft (about 80%).
asymco ·
Apps are reported separately. Services and accessories are part of the iPhone franchise. I think it makes sense to include them as other vendors do similar things (e.g. Nokia includes Devices and Services). The purpose of these ancillary businesses is usually to enhance the core device business.
kevin ·
"The fact is Apple's iPhone growth is about 20% slower than the overall smartphone market growth."
Absolutely wrong, whether we use Nokia's or Strategy Analytics market estimates. Where did you get those numbers? Did you make them up?
Apple's YOY iPhone unit sales growth was 89.4%. SA estimated the smartphone market grew by 67.6%, while Nokia estimated it at 54.5%.
"It doesn't matter if the stock continues upwards tomorrow, as long as you sell for more than you bought, you are a winner."
Winner as of that day. But then what? Have you heard of "opportunity cost"?
Your posts are hilarious.
pk de cville ·
Horace,
Can you add a chart: Profit per device?
And would I be able to generate that myself using your available data access?
pk de cville ·
And one more request:
Would you show these charts w/ Apple, not Nokia in the bottom position?
Thanks!
dchu220 ·
When Asian housewives stop getting arrested for trying to smuggle iPhones into China, I'll consider shorting the stock.
Tony ·
Ultimately it will boil down to a Google Android vs the Apple iOS platform. Google will probably win the lionshare of the market with a more open platform. Apple will continue to focus on a stunning user experience and charge a premium for its devices. As an Apple user, I like being in the minority. You know that whoever dominates the market will be an attractive target for malware and viruses. The smartphone market (now 20% of mobile devices) is going to be a tempting taget as marketshare explodes to 80% over the next few years. All those electronic wallets just waiting to be pickpocketed electronically.
Gustavo ·
Is this data global or just for the US?
Horace Dediu ·
Global unless otherwise stated.