How to maintain a Sell rating on Apple
by asymco-admin
One simple trick.
Tim Long of Barclays Bank has an underweight (Sell) rating on Apple shares. Apple shares have just hit an all-time high. Perhaps he's right. Perhaps one should sell high.
The problem is that Tim Long has had a sell or hold rating on Apple for many years. As far as my data shows, Barclays downgraded Apple shares to a "hold" equivalent on February 20, 2014. In that instance, Barclays analyst Ben Reitzes shifted his rating from "overweight" to "equal weight" due to expectations that upcoming hardware products would not be enough to further move the needle. More recently, on January 2, 2024, Barclays analysts further downgraded Apple shares to "underweight" (a sell equivalent).
Ben Reitzes with Barclays Capital today stripped away his Overweight rating on shares of Apple (AAPL), a rating he's had for a decade, while maintaining a $570 price target, writing that the various products that one can imagine from the company — a smart watch, or a television set — won't be enough to move the needle, so to speak, for the company.
The price target in February 20, 2014 was set to $570 which, accounting for a 7 to 1 spent in June 9, 2014 and 4 to 1 in August 31, 2020, would be $20.39 today (On February 20, 2014, the date of the new $20 target and downgrade, Apple shares closed at $16.54. A year later the shares were $28.77.)
Thus the recommendation from Barclays has been to sell low for 12 years.
Let's dig in.
Nearly a year ago, on August 1st, 2025 Barclays adjusted their price target on Apple to $180 From $173. Today the share price is around $317. We still have a few weeks before August 1st so there is time for the price to fall to $180, however, here are additional 30 price targets set by Barclays and the corresponding price of shares a year later allowing us to evaluate performance:
| Date of Target Set | Target | Price one year later | Error |
| 4/30/25 | $173 | $271 | -56.8% |
| 1/31/25 | $197 | $270 | -37.1% |
| 1/22/25 | $183 | $248 | -35.7% |
| 11/1/24 | $184 | $269 | -46.2% |
| 8/2/24 | $186 | $203 | -9.3% |
| 7/24/24 | $187 | $214 | -14.3% |
| 5/3/24 | $165 | $199 | -20.5% |
| 2/2/24 | $158 | $228 | -44.3% |
| 1/2/24 | $160 | $243 | -52.1% |
| 11/3/23 | $161 | $222 | -37.9% |
| 10/30/23 | $166 | $234 | -40.8% |
| 8/4/23 | $167 | $209 | -25.3% |
| 4/26/23 | $149 | $170 | -14.0% |
| 2/3/23 | $145 | $188 | -29.4% |
| 1/11/23 | $133 | $186 | -39.5% |
| 11/7/22 | $144 | $182 | -26.3% |
| 10/28/22 | $156 | $170 | -9.2% |
| 10/10/22 | $155 | $178 | -15.1% |
| 7/29/22 | $169 | $196 | -16.2% |
| 7/13/22 | $166 | $191 | -14.8% |
| 4/29/22 | $167 | $170 | -1.6% |
| 3/11/22 | $170 | $150 | 11.5% |
| 1/28/22 | $169 | $143 | 15.4% |
| 10/29/21 | $145 | $153 | -5.8% |
| 7/28/21 | $142 | $157 | -10.8% |
| 5/19/21 | $134 | $137 | -2.5% |
| 4/29/21 | $138 | $158 | -14.2% |
| 1/28/21 | $136 | $170 | -25.2% |
| 1/14/21 | $116 | $173 | -49.2% |
| 10/30/20 | $100 | $149 | -49.0% |
The graph version of this data is shown below:
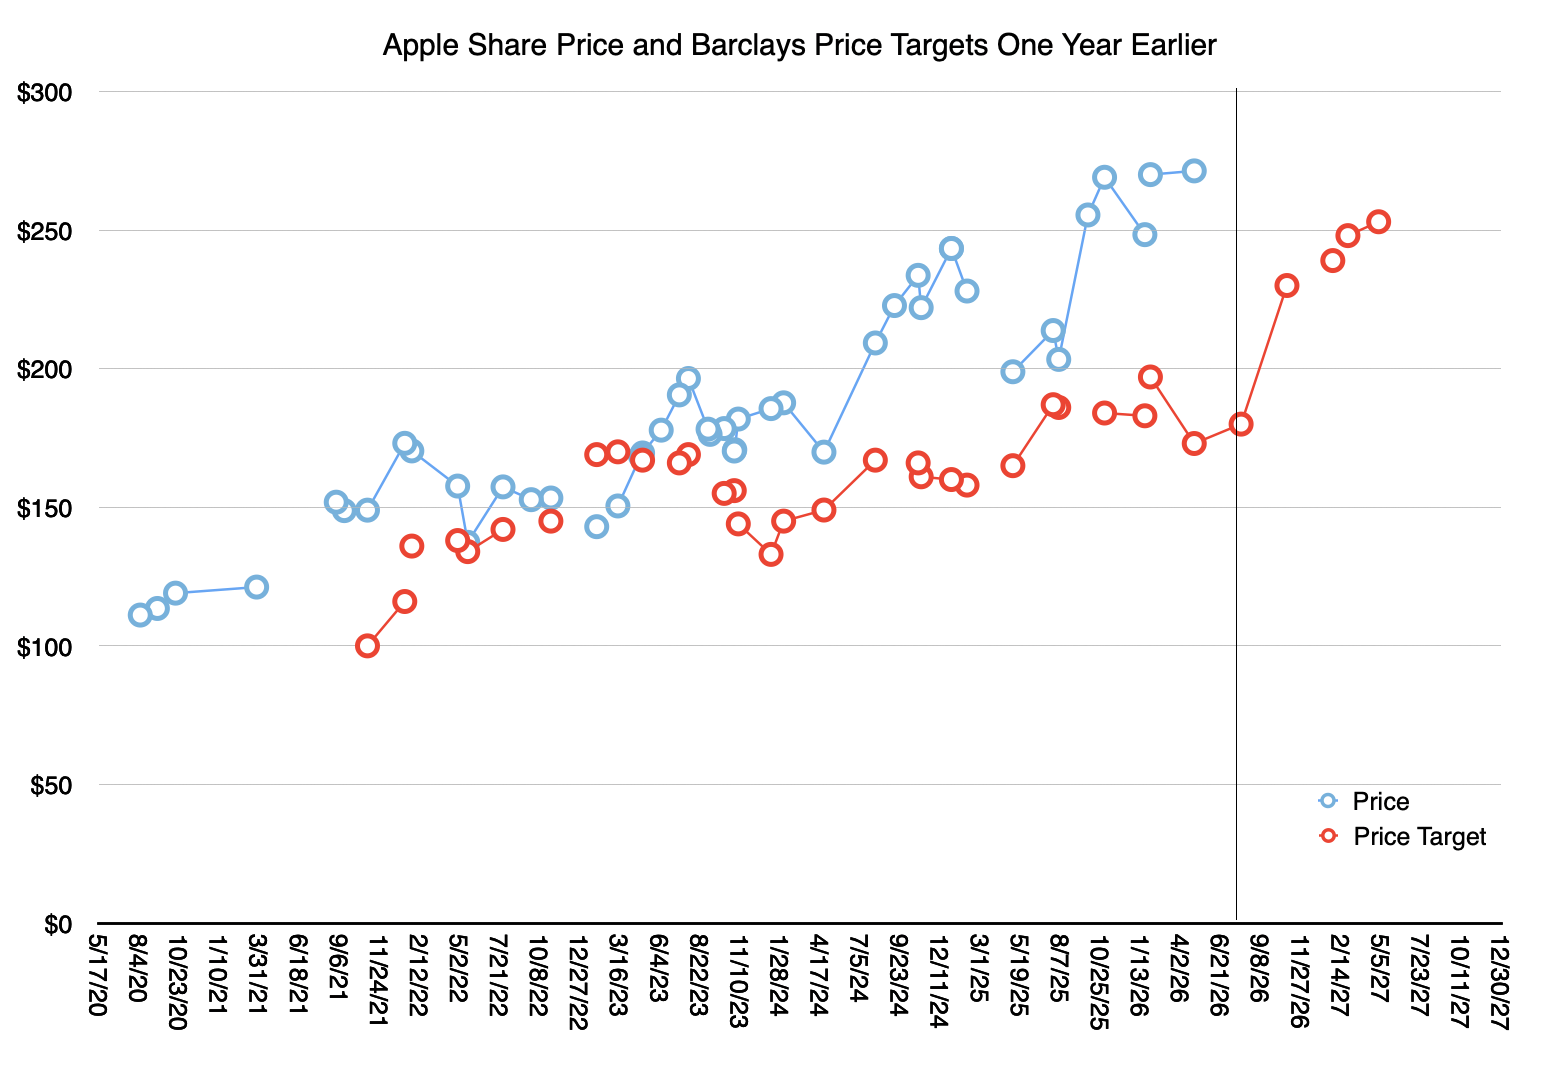
Today is shown with a vertical line.
The graph speaks for itself. The average error is 30%. The worst is 57%. Putting aside the gross failure in setting targets, the most curious aspect of this coverage is that the price targets are trending upwards quite consistently while the ratings are coming down.
Since the Sell->Hold downgrade in 2014, and the subsequent downgrade (Hold->Sell) a decade later, the targets offered by the same analysts have increased from $20 to $253 today (+1,165%).
The targets have increased while the rating has decreased. You were told to not buy at $16 then continue not to buy until you are told to sell because the shares are going to $160 and then sell again because they are going to $250. This is simply contradictory.
The only way to accept the raising targets while maintaining a hold/sell rating is by arguing that all previous ratings and targets are moot and should be ignored. But if you suggest ignoring your own commentaries over 12 years published in over 100 reports reiterating your position then your own recommendation is to ignore what you say.
How long does an analyst insist on being ignored?
- The key thesis was resting on a comparison with Microsoft. It might be worth re-reading:
"Microsoft hit an all-time high market cap of about $620 billion in late 1999 as it was obvious its business model that bet on industry standards was the clear winner in the PC/Internet revolution. In August 2012, Apple beat Microsoft's record of the most valuable company when shares rose past the $660 level and shares continued to rise to an all time high past $700 just after the launch of the iPhone 5 with a market cap of about $650 billion as investors assumed Apple was the clear winner in the mobility revolution.
The point is that the most dominant tech leaders of their era don't necessarily just regroup from these types of peaks and re-assume a new all-time high market cap after a year or two. They may get usurped in the ensuing decade or two. These observations are easier to see in hindsight – but it shows how hard it is to get to this type of size and stay there, much less regroup – and rise above it again […] Both companies seem to have been re-rated as investors ascribe little probability to a next "big thing" after a series of attempts to reclaim past glory.
Apple now trades at 12.7x consensus 2014 estimates – down from its P/E of 15.9x in October 2012. Microsoft traded around 20x in 2004 after a strong rebound in 2003, but its multiple has settled in the mid-teens since that time. We don't see evidence that suggests Apple has another product as material as the iPhone or iPad in the pipeline. We are not arguing the nominal multiples here – but the rate and sustainability of the new contracted multiple from peak is worth noting. Once the market decides that your main product will remain slow for a long time, there does seem to be a visible pattern for multiples to sustain lower levels for a long time even if revenues grow –as was the case with Microsoft."
2 comments
ianandbike ·
Keep these coming - even if this is one of the worst ones. These people have a lot to answer for, and if any investor took their advice, they would be significantly worse off. There have to be consequences for this poor performance but never hear of it.
I guess an excuse would be you're allowed a few errors if overall you've beaten the markets or chosen an alternative big-hitter? That would be a pretty damning analysis in this case I expect.
deemery ·
I'm so glad to see historical analysis of ANALyst performance. What I don't understand, though, is why these clowns continue to be employed. Are they -only in it for the clicks-? Do their bosses not care about how piss-poor their performance has been, year over year? Or do those bosses not bother to actually monitor performance?