Asymco

Asymmetric Intelligence

asymco-admin

  1. Fortune 130

    Research · 74 comments

    The increase in net sales of iTunes, Software and Services in the first quarter of 2014 compared to the first quarter of 2013 was due to growth in net sales from the iTunes Store, AppleCare and licensing. The iTunes Store generated a total of $2.4 billion in net sales during the first quarter of 2014 versus $2.1 billion during the first quarter of 2013. Growth in the iTunes Store, which includes the App Store, the Mac App Store and the iBooks Store, was driven by increases in revenue from App sales reflecting continued growth in the installed base of iOS devices and the expansion in the number of third-party iOS Apps available. Net sales of digital content, including music, movies, TV shows and books, from the iTunes Store was relatively flat in the first quarter of 2014 compared to the first quarter of 2013.

    Apple Inc. Form 10-Q.

    During the last quarter Apple changed the pricing for iWork and OS X to zero ((OS X server is still priced at $20 and iWork for previously unlicensed devices and computers is still priced above $0)).

    I estimate the net effect to have been a reduction in revenues from those software titles of about $350 million for the quarter. Nevertheless, increases in services and app revenues means that the iTunes total reported revenues increased to a new record.

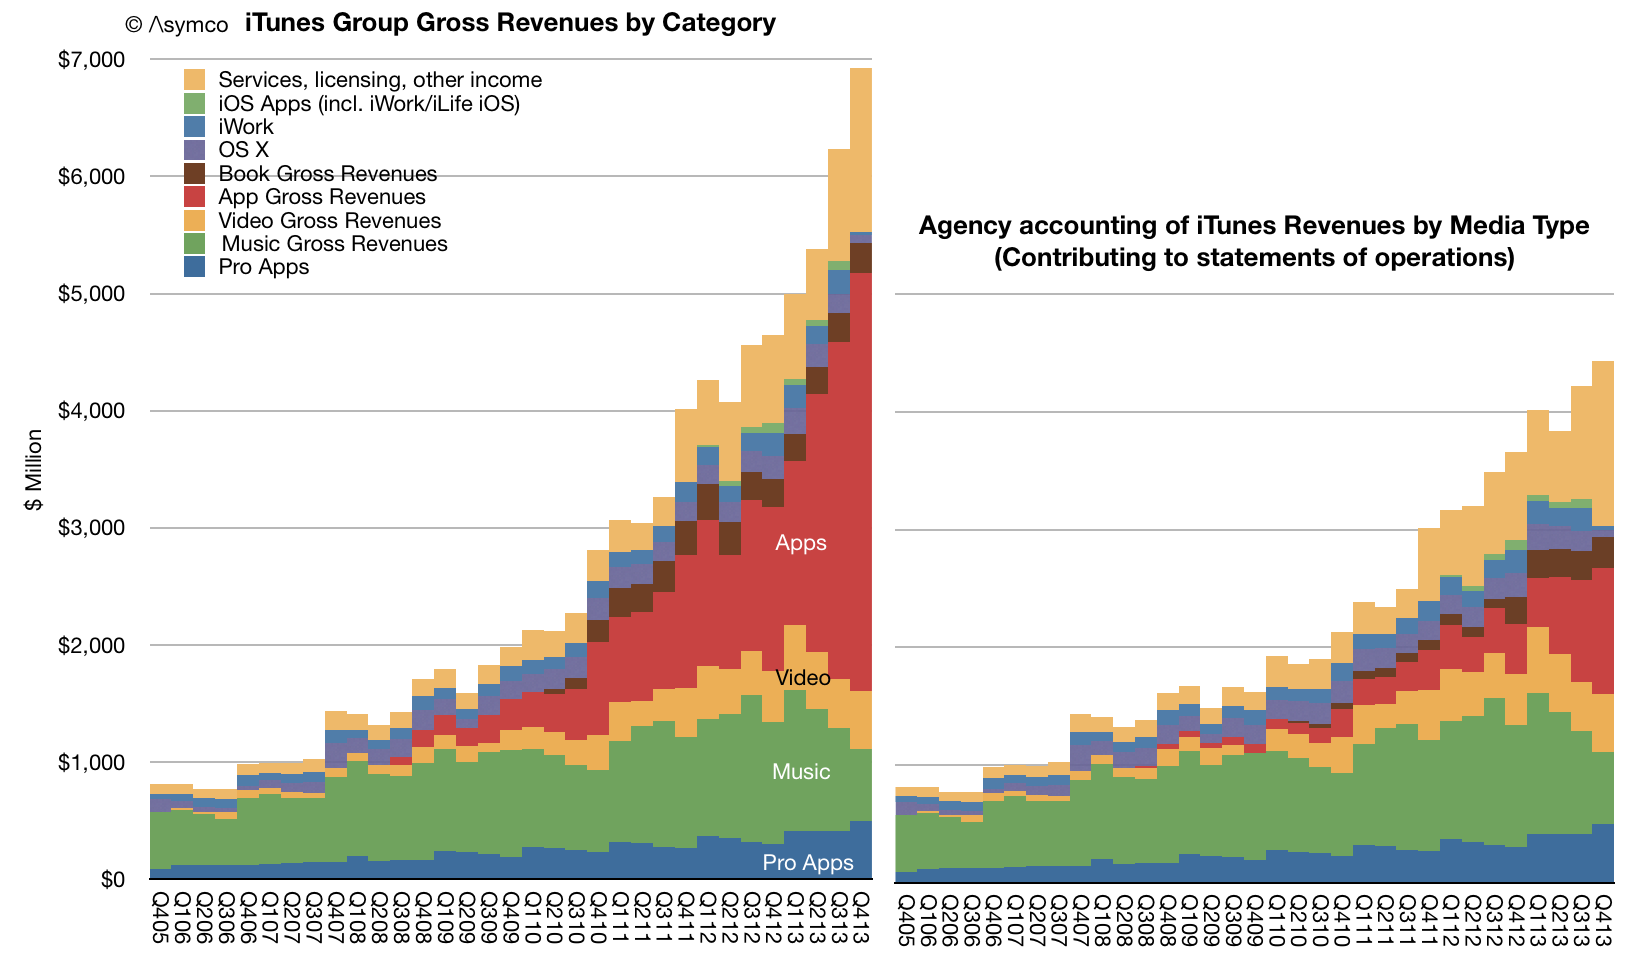
    The total with estimated contributions by media and service components is shown below right.
    Screen Shot 2014-02-10 at 10.05.11 AM

    Note that revenues do not reflect total billings. As Apple reports only the 30% of App transaction values, the full iTunes/Software/Services transaction values are shown in the above graph on the left.

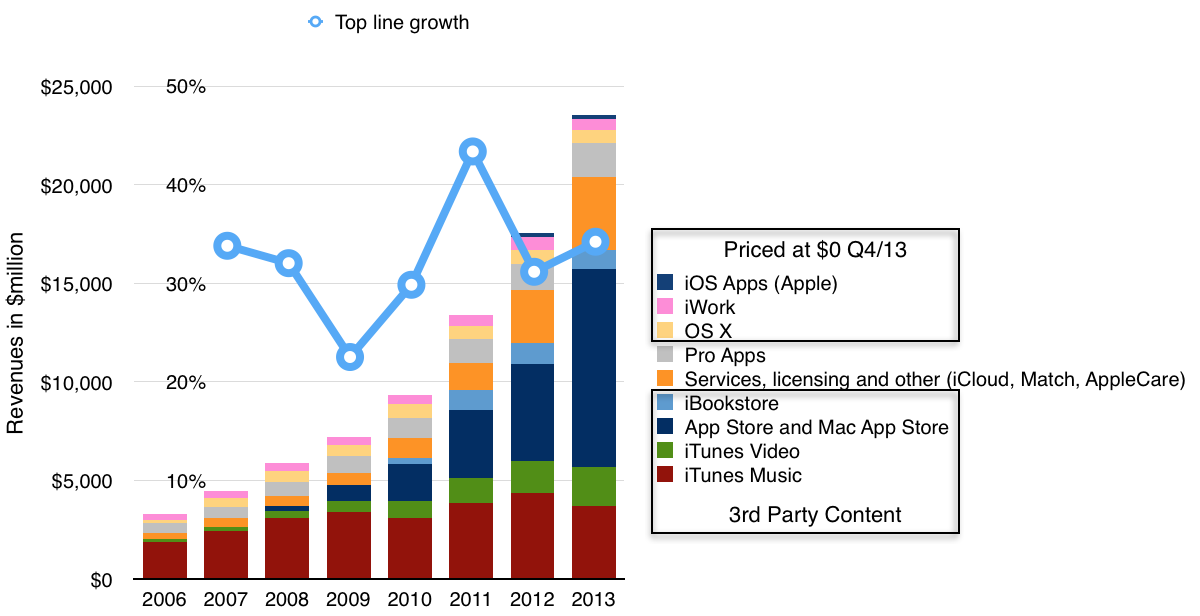
    The "gross" revenues are now nearly $7 billion per quarter. On a yearly basis the iTunes/Software/Services group had gross revenues of $23.5 billion with growth of 34% y/y.
    Screen Shot 2014-02-10 at 10.03.28 AM

    Other estimates for full year 2013 growth are:

    • Third party content +46.6%.
    • Music downloads -14%
    • Video +19%
    • Apps +105%
    • Books -9%
    • Services +37%
    • Pro apps +29%
    • OS X -8%
    • iWork and iLife -8%

    Although iTunes/Software/Services are not usually included in a "sum-of-the-parts" total contributing to Apple's overall enterprise value, the scale of volume and value of transactions is becoming harder to ignore.

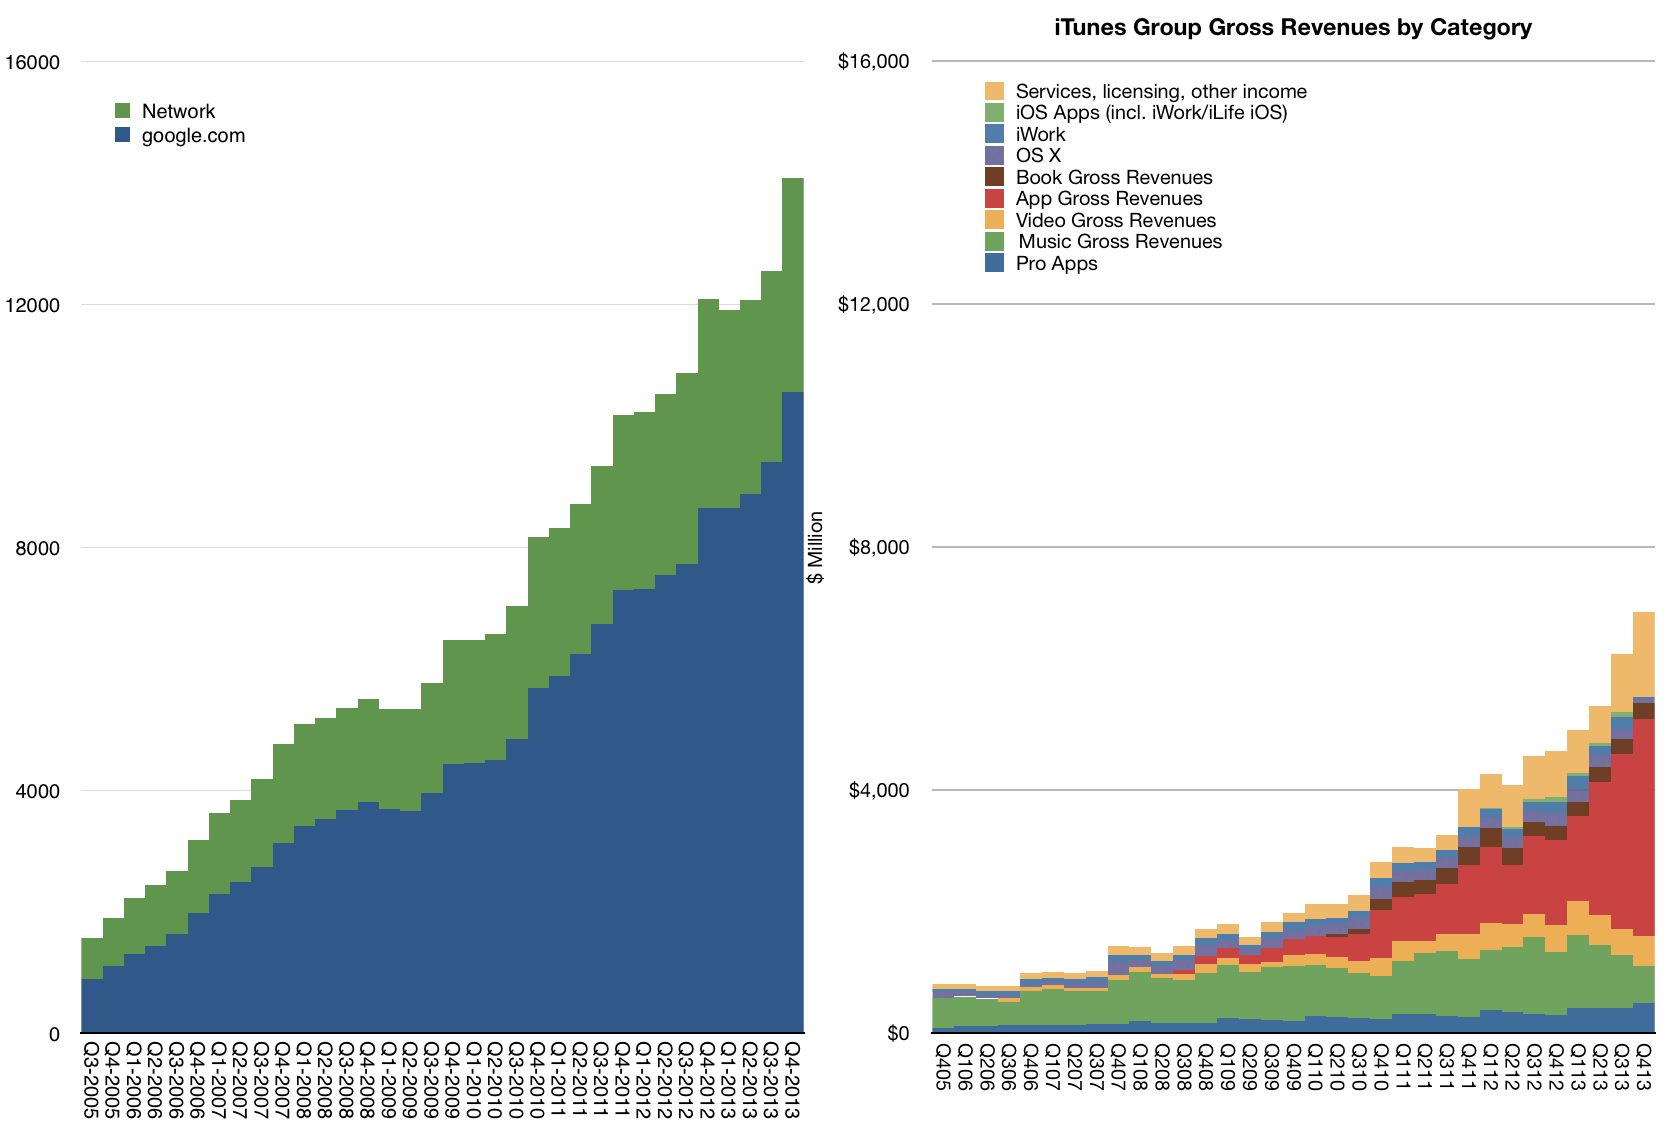
    To illustrate this, I plotted the history of gross iTunes revenues vs. Google's search business ((Excludes Motorola and "Other" segments as reported by Google))
    Screen Shot 2014-02-10 at 10.03.55 AM

    On a yearly basis iTunes/Software/Services is nearly half of Google's core business and growing slightly faster.

    The iTunes "empire" of content and services would be ranked as number 130 in the Fortune 500 ranking of companies (slightly below Alcoa and above Eli Lilly).
  2. Renaissance Session: Opportunities

    Research

    Horace Dediu is an analyst with a focus on the mobile phone industry and especially Apple. Blogging at asymco.com, he often posts surprising facts that confront the conventional "wisdom" of other analysts, who are often predicting doom-and-gloom for Apple.

    We asked Horace to share his thoughts on technology, change, and how to anticipate the next big thing.

    via Renaissance Session: Opportunities.

  3. Invulnerable

    Podcast · 182 comments

    On a recent podcast I noted that Google was perceived as invulnerable. In contrast, Apple is seen as temporarily enjoying a stay of execution. ((The list of Apple Achilles' Heels is so long and creatively composed that it would take ages to compile, but here are just a few: the Mac (vs. Windows), Digital Rights Management (which kept the iPod alive), dozens of lawsuits (including from The Beatles), the Mac (when it ran Windows), PlaysForSure, Music Labels retaliation, the Zune, Android and clones, the Kindle and Amazon in general, more Mac, iTunes, iPod and iPhone and iPad killers than can be counted; Steve Jobs is ill, Jony Ive will quit, Tony Fadell quit, Rubinstein quit, Forstall was fired, etc. Feel free to add more through comments. See also Apple Death Knell Counter.)) This is not necessarily a bad thing for Apple. The more gushing the loathing or scorn, the more likely it's a reaction to love and attraction. A brand dies not from hate but from apathy.

    But nor is it necessarily a good thing for Google be be seen as invulnerable. There might be no "Google death knell counter". There might not be a "Google is doomed" trope. If an executive from Google quits or is fired there is no investor panic. If a product is withdrawn there is no mourning. There are no journalists pursuing Pulitzer prizes by describing some seamy underside of Google. But there are no overt displays of affection either. Google is seen, on balance, as benevolent and hopeful. The discussion on business robustness is simply missing.

    I suspect the absence of scrutiny comes from Google being seen as an analogy of the Internet itself. We don't question the survival of the Internet so we don't question the survival of Google -- its backbone, its index, and its pervasive ads which, somehow, keep the lights on. We believe Google is infrastructure. We don't dwell on whether electric grids are vulnerable, or supplies of fuel, or the weather(!)

    Too complex, too pervasive. These are systems, not things. And people are not designed to contemplate systems. We leave that to experts, or better yet, computers.

    The reason Apple is contemplated at all is that it's not seen as a system. Even the suggestion that Apple is a system is implicitly treated as an impossibility. Because it's not a system it's fragile. It's a person, or an idea, or a product or a singular "key" to something. It is, ultimately, mortal. The only debate is when it will die and points are earned for calling it sooner rather than later.

    But what if Apple were a system? And what if Google were a person (or three?)


  4. But Apple does not pursue profits either!

    Research · 36 comments

    In my essay on Google's absence of profit (or income or business) motives questions were raised on the stated absence of hunger for profits from Apple and what difference there might be from Google's philosophy.

    Indeed, Jony Ive stated:

    "Our goal isn't to make money. Our goal absolutely at Apple is not to make money. It may sound a little flippant, but it's the truth." ((at the British Embassy's Creative Summing in July 2012)).

    He was probably repeating what Jobs had previously stated:

    "I remember very clearly Steve announcing that our goal is not just to make money but to make great products" ((Walter Isaacson's Steve Jobs))

    However, note that both quotes are qualified. In the case of Jobs, he said "not just to make money". Jobs clearly stated that great products lead to money. That great products are causal to money and therefore that if you make great products you make money. One leads to the other.

    Ive also continued in this reasoning:

    "Our goal, and what gets us excited, is to try to make great products. We trust that if we are successful people will like them. And if we are operationally competent we will make revenue. But we are very clear about our goal."

    I would paraphrase the Apple logic as "Great products are the means by which we sustain our business. By focusing on the product, the customer is satisfied and through that satisfaction we create the free cash flows which can be used to fund more products."

    There is a difference between Apple's "indifference to money" and the "indifference to business models" that Google exhibits.

    Google steps even further away from cash flows. Its goals are to build great things guided by their vision and patterns in the data they collect. The value is in the data itself rather than in any transaction.

    As long as the source of money is unfettered, its provenance is uninteresting. A business model is a profit algorithm. It could be linked to the data but it need not be. Markets are messy and imperfect. Data provides much clearer views into value. You could conclude that value itself cannot be trusted to the judgement of the public. Value is to be determined through the recognition of patterns on data privately collected.

    So when I say that Google has disdain for market mechanisms I mean that they believe they can do better. Apple still values the user as the ultimate adjudicator of its actions. Google looks past the user and interprets their intentions.

    Google sees markets as ultimately obsolete.

  5. The Critical Path #106: Can Bitcoin Be Money?

    Podcast · 5 comments

    This the the first of hopefully a series of talks on Bitcoin. The hope is to assess it as a disruption but first we need to understand the differences between a store of wealth, a currency and money. Then we need to understand what jobs each of these is hired to do and whether Bitcoin is better or worse than the incumbents and whether it has "headroom" to get better in those cases where it's not good enough.

    via 5by5 | The Critical Path #106: Can Bitcoin Be Money?.

  6. A way to measure one's life

    Research · 20 comments

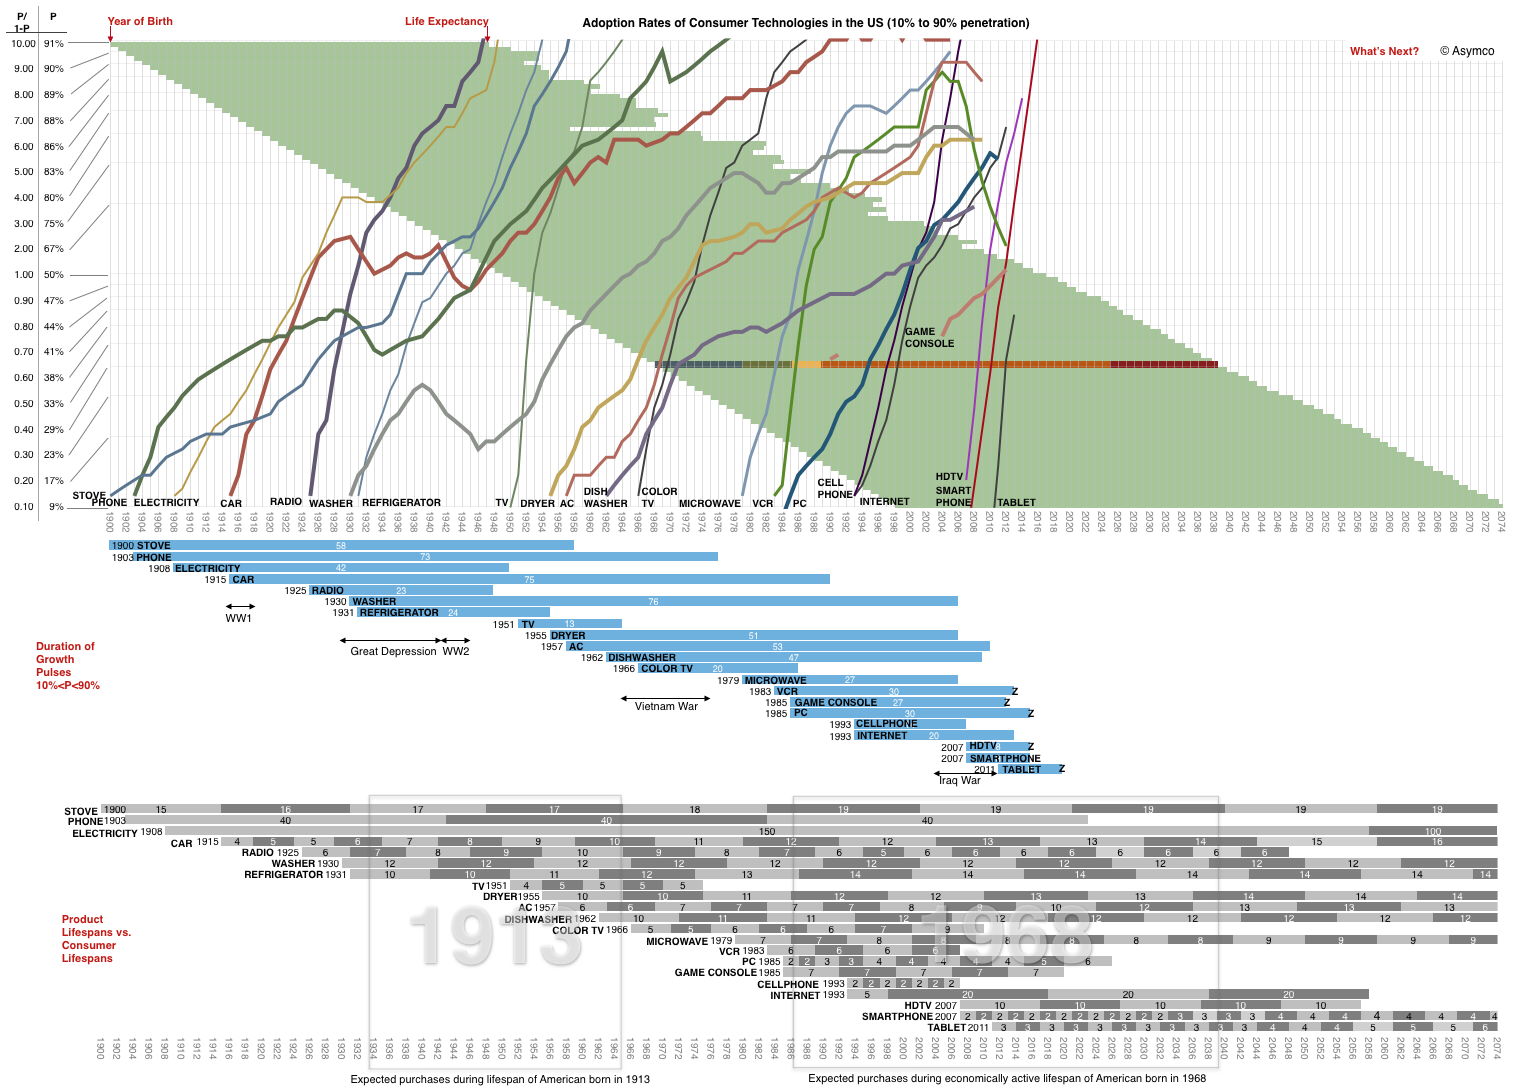
    In the post Seeing What's Next, I showed how the rate of change of adoption of technology varies with time and asked what might be experienced by present and future generations.

    It turns out that knowing how what innovations become universal and the speed at which these technologies are replaced can give us an idea of what individuals might experience in their lifetimes.

    Here's how to think about it:

    Screen Shot 2013-11-19 at 11-19-8.04.42 PM

    You can use the model above to visualize a lifespan, given a year of birth. Follow the line for your year of birth and measure an expected life (the life expectancy in green is a guide). You can skip over childhood years and decide when you might have reached an age when you start buying and using certain products as well as when you think you might stop.

    Trace a rectangle over the grey areas in the bottom graph spanning the years you will start to consume and when you might expect to stop.

    The area within the rectangle will include known products and their expected lifespans (marked in alternating shades of grey with a figure for the longevity of service life.) The total number of segments represents your expected consumption.

    I marked the areas for a person born in 1913 and one born in 1968 ((Corresponding to my grandmother and myself though we were not born in the US.)) What the analysis shows is that I would be expected to own:

    • Three stoves (I've owned one so far.)
    • One regular landline phone service. Mine was discontinued in the late 90s.
    • One electricity subscription. (It seems banal to give electricity a product lifespan but will make more sense if the electric grid is re-achitected.)
    • Five cars (for my household). I've owned more than five but mostly due to vanity.
    • 8 Radios/Stereos. I owned about 5 "sound systems" so far
    • 4 Washers. My household has owned 3 so far.
    • 4 Refrigerators. I've owned three so far.
    • 4 Dryers. Three so far.
    • 7 Air conditioning systems. I've only owned about 3 but I lived in cooler climates.
    • 5 dishwashers. I've owned 3 so far.
    • 4 CRT Color TVs and three HDTV. I've had 4 CRT TVs and one HDTV so far.
    • 4 VCRs. I've owned 4.
    • 11 PCs. I lost track but I think more than that so far.
    • 5 Game consoles. I've owned none. To be fair, consoles are not an universal technology as they have not reached saturation.
    • 7 voice-oriented cell phones. I've had a few more but it's close
    • Three internet service contracts. (This assumes dial-up as first.)
    • 15 Smartphones. 6 so far (excluding company purchases).
    • 10 Tablets. 4 so far.

    A couple of caveats:

    1. My life is not yet over, so there is still time to fulfill my consumption quota.
    2. There will be additional things to count within my life span.
    3. There are many technologies not counted but few of those I can imagine are universal, or saturated. This means that there is little certainty this model can be used reliably.
    4. Some people are early adopters and some are late adopters. Depending on which, it might add or subtract certain product cycles but as adoption rates increase and product lifespans decrease.

    I did the same tally for my grandmother and it matches prettily closely her consumption with the caveats that she did not reside in the US and that she lived almost twice the expected lifespan.

    The obvious next step is to multiply the model by population forecasts.


  7. How many years does Apple have?

    Research · 167 comments

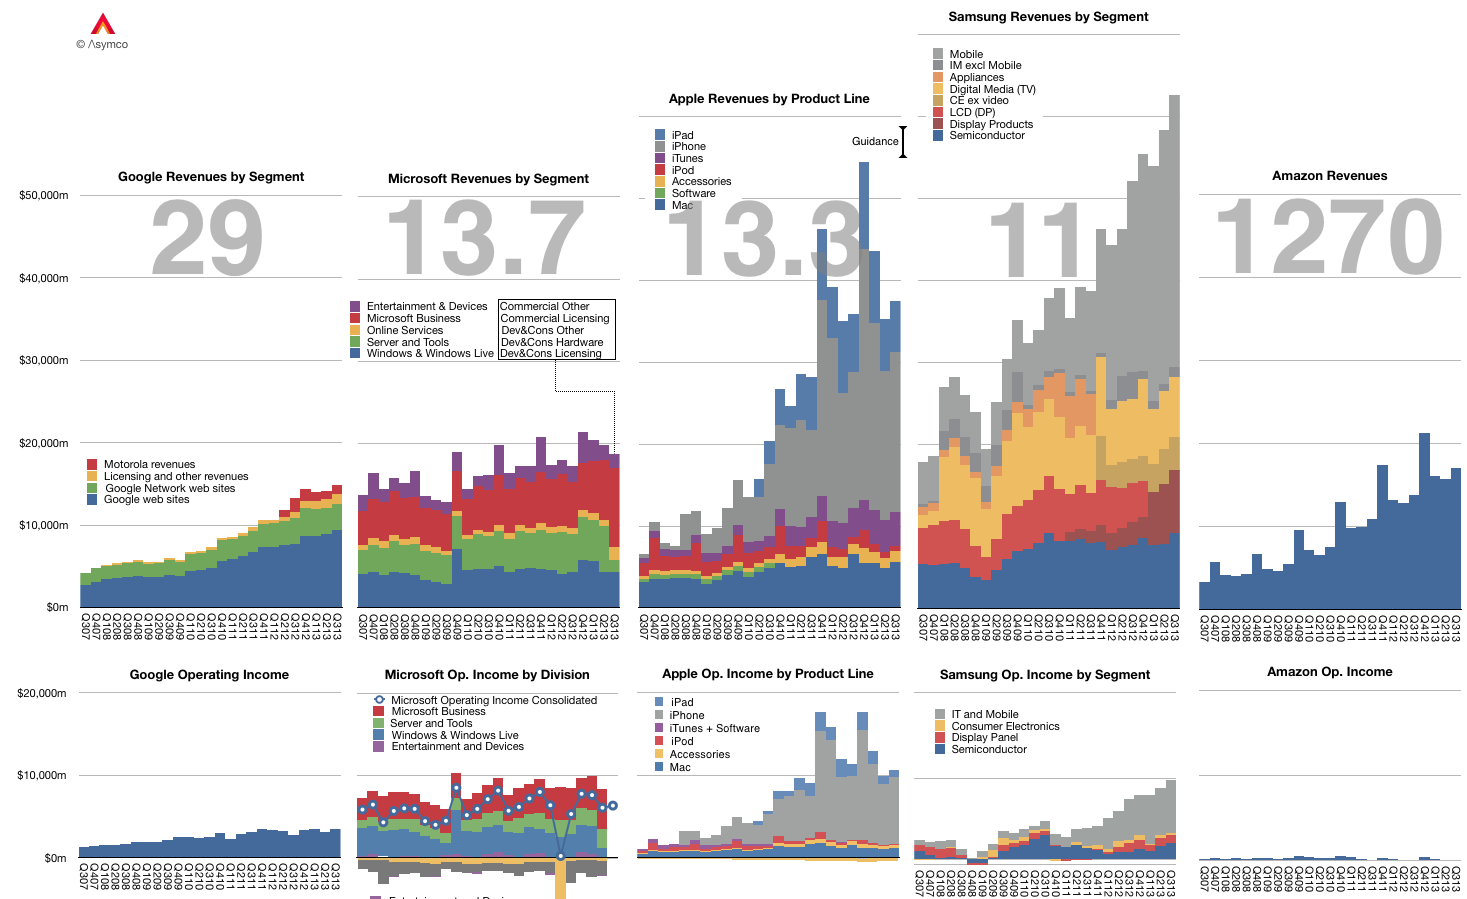
    The graph below shows the Revenue and Operating Income for a select group of companies. The large numbers represent the share price to earnings (trailing twelve months) ratio (P/E or PE ratio).

    Screen Shot 2013-11-06 at 11-6-2.56.25 PM

    Of course the P/E ratio hides a lot of subtlety. It mostly fails to account for the fact that earnings are largely a matter of opinion. A company can defer income (as Apple and Microsoft do), it can invest earnings (as Amazon does) and can otherwise avoid declaring it since it's taxable.

    A better measure is the Enterprise Value to Free Cash Flow ratio (EV/FCF). It reflects a "harder" measure of performance in the form of free cash flow. It is not a matter of opinion but a fact. Enterprise Value also excludes cash which is a measure of past performance.

    Nominally both P/E and EV/FCF measure the valuation of a company. They give what amounts to the number of years that current performance can be expected to last. For example a P/E or EV/FCF of 10 can be read as "If I purchase a share today, I should expect the company to pay me back in earnings in 10 years." Any earnings after 10 years are essentially "profit" for the investor.

    Inverted these ratios are a measure of Yield or how much of the total investment is paid back in a given year. In the example above, the Yield would be 10% or "If I purchase a share today, the company will pay me back 10% a year in earnings."

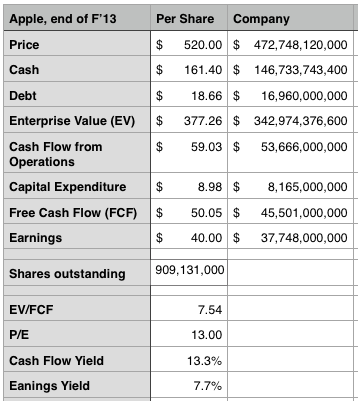
    Relying on P/E is troublesome since, as mentioned above, it's deceptive. We get into difficulty when P/E and EV/FCF differ greatly. If a company has minimal cash and declares all free cash flow as earnings then the ratios are the same. However, consider how different these two ratios are for Apple:

    Screen Shot 2013-11-06 at 11-6-3.11.50 PM

    The P/E ratio is 13 while the EV/FCF is 7.5. ((It would be very interesting to have both ratios available for all the companies in the graph above.))

    This means the investment horizon is nearly half of what P/E suggests. (The cash flow yield should give pause). Put another way, the market suggests that Apple has 7 more years of current profitability and not 13. Note that the P/E ratio for the S&P 500 is above 19.

    As Apple's deferrals are increasing investors should look again at what the company's worth. We had similar confusion when the company was deferring most of its iPhone revenue.

  8. The diffusion of iPhones as a learning process

    Research · 50 comments

    All theoretical and empirical diffusion studies agree that an innovation diffuses along a S-shaped trajectory. Indeed, the S-shaped pattern of diffusion appears to be a basic anthropologic phenomenon.

    This observation dates as far back as 1895 when the French sociologist Gabriel Tarde first described the process of social change by an imitative "group-think" mechanism and a S-shaped pattern. ((Tarde was probably influenced by mathematician Pierre François Verhulst who first published the logistic function in 1845)) In 1983 Everett Rogers, developed a more complete four stage model of the innovation decision process consisting of: (1) knowledge, (2) persuasion, (3) decision and implementation, and (4) confirmation.

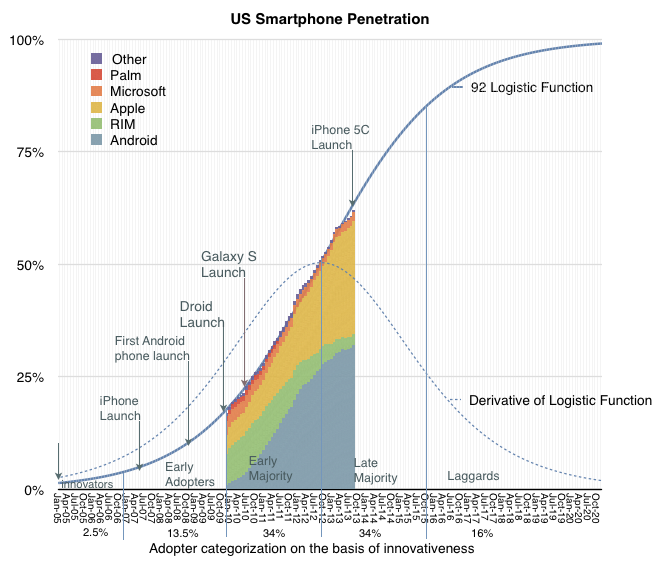
    Consequently, Rogers divided the population of potential adopters according to their adoption date and categorized them in terms of their standard deviation from the mean adoption date. He presented extensive empirical evidence to suggest a symmetric bell shaped curve for the distribution of adopters over time. This curve matches in shape the first derivative of the logistic growth and substitution curve as shown below. 

    Screen Shot 2013-11-06 at 11-6-1.51.57 PM

    In the graph above I applied the Rogers adopter characterization to the data we have on the adoption of smartphones in the US. The latest data covering September is included.

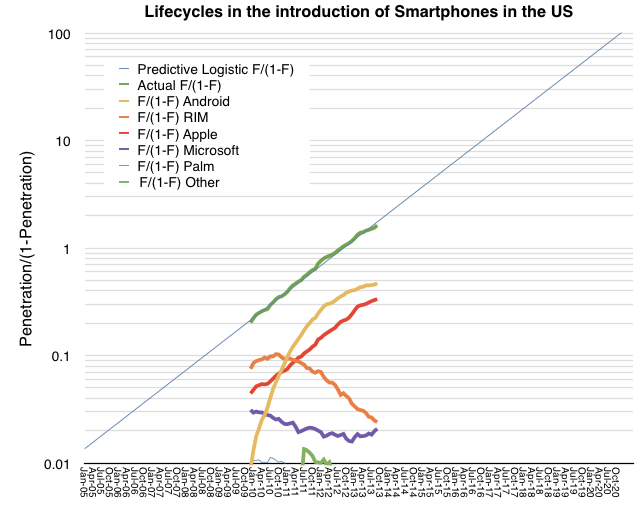
    The fact that smartphones in the US follow the theory is exciting, but what can we conclude about the adoption of specific platforms? There has been quite a bit of turnover in the leadership of the market in the first half of the time frame given. You can see this more clearly in the following fractional market share transformation.

    Screen Shot 2013-11-06 at 11-6-2.16.03 PM

    Note that, with the exception of the iPhone, if each platform is studied individually, it would not follow a logistic (i.e. linear) pattern even though, as a whole, the technology does.

    This then is the big puzzle: while we might be able to predict how smartphones will diffuse into society, we can't seem to predict how any single firm will fare. This means that an investor cannot make a credible "bet" on the technology ((Indeed investors often get burned when new technologies emerge. While the technology booms, individual firms supplying it often fail. See the history of transportation, communication, computing and energy.)). If they choose a single company as proxy, chances are they will lose. If they bet on a basket of companies then, again, chances are they will lose. There is usually one unforeseeably clear winner.

    Before we get further into the question of picking winners or predicting the future division of share among rivals, we should understand the underlying causes for this pattern of adoption.

    Rogers concluded that the learning behavior of individuals is the underlying cause of the symmetry of the diffusion process.

    At the beginning, when an individual is confronted with a new (learning) situation they make many mistakes. These mistakes are gradually reduced (by learning) over time because more and more information is received and acts as a stimulus. The gain in learning per trial is proportional to the product of the amount already learned and the amount remaining to be learned before the limit of learning is reached.

    Arnulf Grübler ((The Rise and Fall of Infrastructures, Physica-Verlag 1990)) explains:

    This is exactly equivalent to the F(1-F) transformation of the logistic curve. It should be emphasized that these properties of the learning process were found in real learning situations and are confirmed by a large number of laboratory and field experiments. Thus each adoption of an innovation in a social system is equivalent to a learning trial by an individual. Thus, the symmetric diffusion pattern results from the way messages about an innovation are emitted and processed by social learning.

    So these observers of the process assign learning behavior as the cause for adoption of a technology. Can the learning behavior be applied to individual platforms? It's tempting.

    The hypothesis would go as follows: adopters are not only processing messages about the new technology but they are also trying different platforms as they enter and as they upgrade their phones. If we see platform choice as a learning process then if one platform has a natural advantage, it settles into a dominant position as users "learn" of its advantage. Conversely, if no platform has an advantage then platform "churn" repeats as rivals gain/lose positions of leverage in the market.

    The pattern shown so far seems to point to Apple's iPhone having a logistic pattern indicating that it might be benefiting from a learning pattern. The alternative platforms may simply be jockeying for temporary advantage.

    It's an interesting hypothesis. To be developed further we need to answer what any learnable advantage might be. I suspect it has to do with the ability to solve unmet and unarticulated needs. In other words, that the winning product solves a set of "jobs to be done" which are difficult to pin down and are perceived rather than defined.