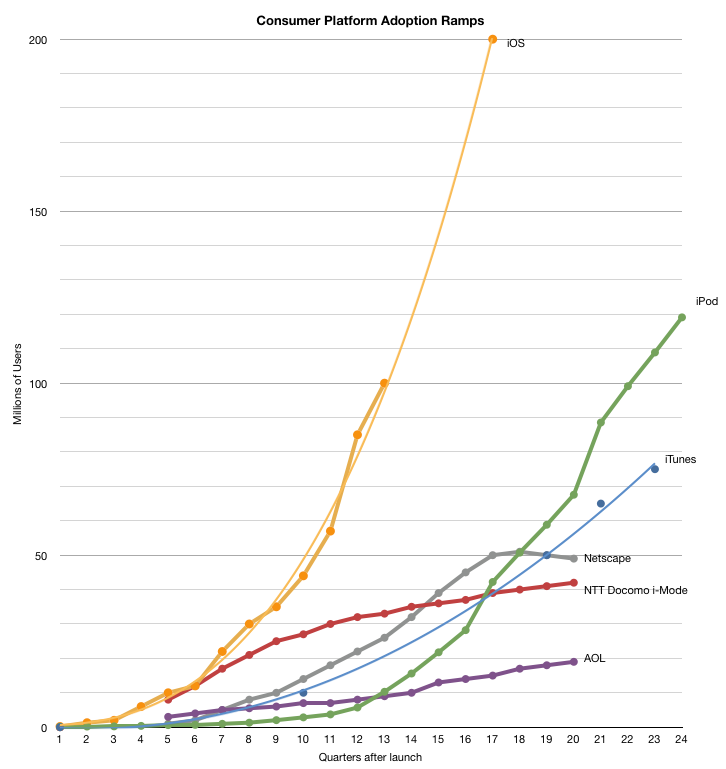
Brian Marshall, an analyst with investment firm Gleacher & Co., predicts that Apple will have sold 200 million iOS devices by this time next year. He expects the iPhone and iPad to represent 68 percent of gross margins for 2010.
My expectations for the next 100 million were made in June:
My expectation is that well over 100 million iOS devices will sell during 2011, but even during the next 12 months (2H ’10 and 1H ’11) the total may well reach 100 million, making 200 million installed by June 2011 very likely.
My current expectation is that iPhone and iPad will account for 70 million additional iOS units for the twelve months following this June quarter. This excludes any Apple TV units moving to iOS.
As iOS moves to more of the iPod line-up it's quite possible that another 30 million iPads with iOS will ship in the same time frame making Marshall's forecast sound reasonable.
Frequent readers of this blog know they're in good company. There have been over 1000 comments in but a few months and, without any qualification, they have all been valuable.
I've been delighted that contributing readers are not only civil and polite, but that they almost always move the intellectual level of the blog higher. That's very gratifying because although one major consideration when publishing is creating a large audience, a high quality audience is much more important. Especially to a site dedicated to elevating analytical discourse.
So, being analytical, I wanted to find out how to characterize the audience and understand the attributes of the readers. Naturally, where appropriate I would like to share that information. I hope to share some stats, perhaps with some interesting highlight, every month.
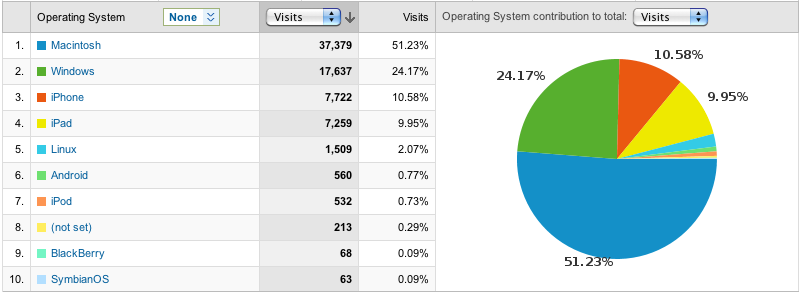
To kick off, here is a snapshot of one month's worth of visits to www.asymco.com ranked by operating system.
What is perhaps unexpected is that mobile platforms (iPhone, iPad, Android etc.) generated more views than Windows. When comparing browsers, I also observed that Internet Explorer makes up only about 5% of views. (If that's not a leading indicator of the intellect of the readers, I don't know what is.)
Time will tell whether these ratios persist, but so far, it seems that Asymco readers are at least eating their own dogfood.
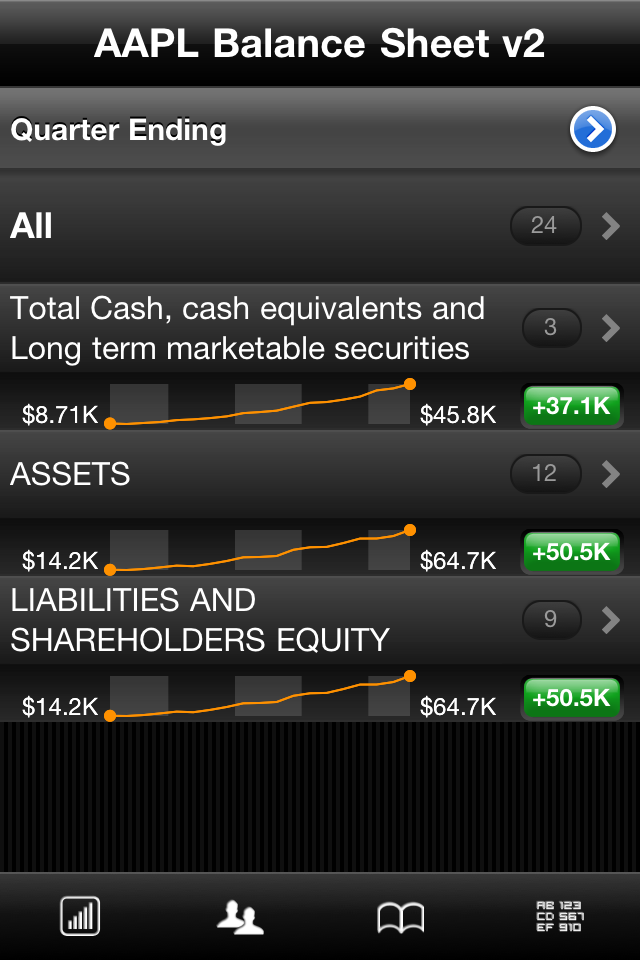
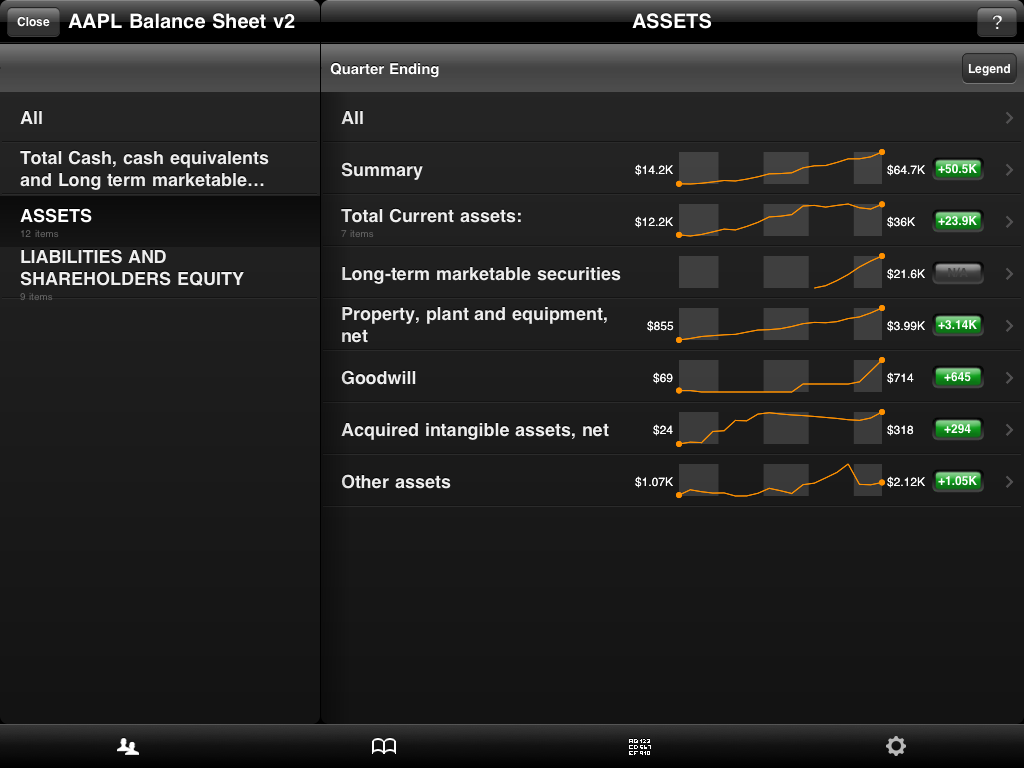
Let your fingers do the walking through Apple's income statements since FQ1 2005. Glide effortlessly through juicy bits of assets and liabilities. Slide your finger through nineteen quarters of financial goodness.
A special bonus: included is a separate visualization of Apple's liquid assets: cash, cash equivalents, Short-term marketable securities and Long-term marketable securities. $$$$$!
Brilliant to use and look at on both iPhone, iPad and iPod touch:
They all bear an outward resemblance to another tablet that was widely panned.
So what strikes me about all of these designs is that they're basically just shiny rectangular things. There is very little you can do as a vendor to stand out with any particular rendition of a rectangle.
This is also becoming obvious with the mechanical design of smartphones. They are all smaller rectangles with shiny black screens.
Which begs the question: as they are all just screens, shouldn't what's on the screen matter more than the screen itself?
The world’s largest mobile-phone maker’s bonds are trading as if Nokia’s rating has been cut, with spreads over government debt widening as the company strives to develop devices with the same mass appeal as the iPhone, Research In Motion Ltd.’s BlackBerry and devices based on Google Inc.’s Android software.
There’s a “significant amount of risk overall with Nokia’s business model,” said Scott Shiffman, who directs bond research at Chapdelaine Credit Partners in New York. “Credit spreads should move wider over time and ratings will continue to move lower. We think the ratings agencies will play catch-up to the business deterioration.”
Microsoft executives told Goldberg during a recent visit to company headquarters that the company, carriers, and manufacturing partners, would spend "billions" of dollars in the first year on marketing and development of Windows Phone 7. Another source estimated a $1 billion price tag for the launch, with half of it going to marketing.
Note the scale of spending here. The number quoted is twice Apple's yearly ad budget, for all its products.
$500 million is roughly the equivalent of Apple's entire advertising budget for its 2009 fiscal year. In its 2009 Form 10-K filing to the SEC, the Cupertino, Calif., company listed $501 million in advertising expenses. Microsoft's fiscal 2009 advertising budget was $1.4 billion.
But beside the unrepentant destruction of Microsoft's shareholder wealth, one other thing jumps out at me: why are the operators and vendors going along with this?
Fragmentation increases the cost of development, marketing, operations and hinders the creation of cohesive ecosystems.
Most companies are very aggressive in consolidating around internal platforms and standards. Supporting R&D teams and marketing teams around each platform is costly and dilutive to one's brand.
With hundreds of Android devices and RIM and Apple increasing distribution, why would operators be willing to spend hundreds on a venture to promote a new platform? This decision is even more puzzling when realizing that the vendor of the new platform left nothing but business model carcasses behind the last time they got involved in the industry.
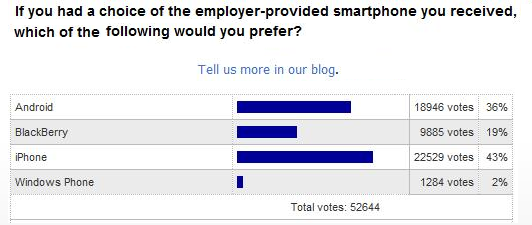
In addition the positioning of this product is suspiciously awkward. One could argue that as a vendor or operator, having an unaddressed or underserved market (say, business users) might mean this platform could expand the distribution of your product or service. But Windows Phone is being positioned as a consumer brand and that's a crowded space where every other platform is also targeted. See the survey data below (unconfirmed source: US Army)
So again, why would operators and licensees spend hundreds of millions to introduce yet another platform in the market?
Much of what is published here relies on data, lots of data. It's important that data be published along with conclusions, but data in spreadsheets is often difficult to read. Spreadsheets are not "productized" so they are hard to explain and therefore impossible to share.
However, I am considering sharing the data I have in a format that is easier to read than a spreadsheet but richer than a screen shot of a chart.
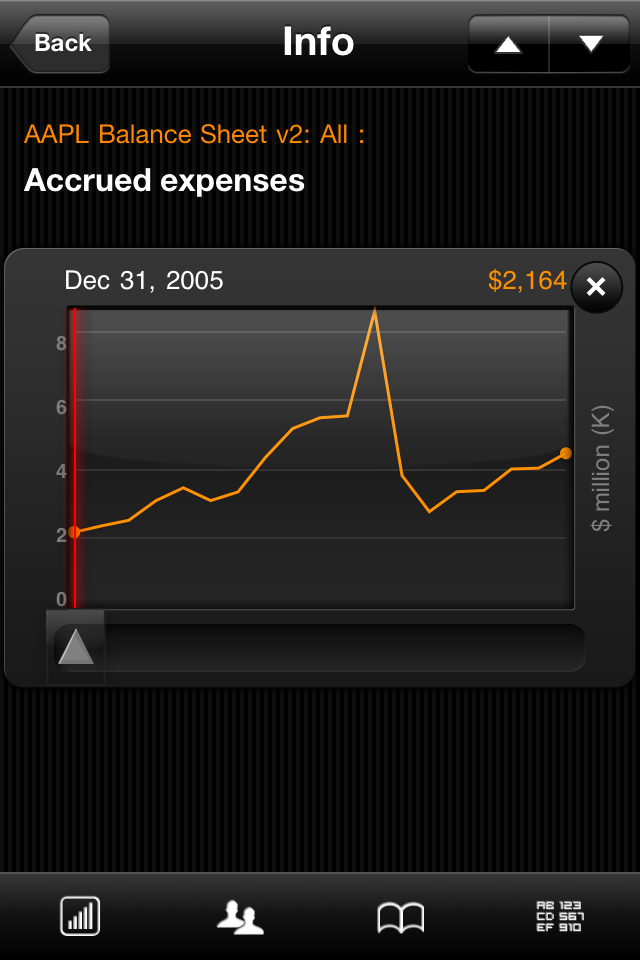
To that end I've begun experimenting with a solution based on a service called Roambi. Interested readers can download Asymco authored "roambi" files which I call ADDs (Asymco Data Downloads) will display rich data sets on iOS devices. These representations are interactive and easy on the eyes.
Rather than bore with details, the following images should be sufficiently descriptive.
A: Hopefully you won't need help, but there is help in the app and at Roambi's site.
Q: Will ADDs work with Android?
A: No.
Q: Will ADDs work with <insert non-iOS device here>?
A: No.
Q: Can I see ADDs on a Windows PC or with a Mac?
A: No.
Q: Can I download the actual spreadsheets?
A: No.
Q: How much does it cost?
A: ADDs are free.
Q: What if I see an error?
A: Send me a message.
Q: Will you publish more of this data, like the Apple financials?
A: Yes. I hope to publish all my data. Stay tuned.
Q: I don't have time to read your blog every day, can I just get the data?
A: I'm considering ways of creating a "premium" service. If you are interested send me a message that you would like to receive email-based links. Send request to: horace.dediu -at- asymco.com.
When I asked members of The Wall Street Journal's CEO Council, a group of chief executives who meet each year to deliberate on issues of public interest, to name the most influential business book they had read, many cited Clayton Christensen's "The Innovator's Dilemma." That book documents how market-leading companies have missed game-changing transformations in industry after industry—computers (mainframes to PCs), telephony (landline to mobile), photography (film to digital), stock markets (floor to online)—not because of "bad" management, but because they followed the dictates of "good" management. They listened closely to their customers. They carefully studied market trends. They allocated capital to the innovations that promised the largest returns. And in the process, they missed disruptive innovations that opened up new customers and markets for lower-margin, blockbuster products.
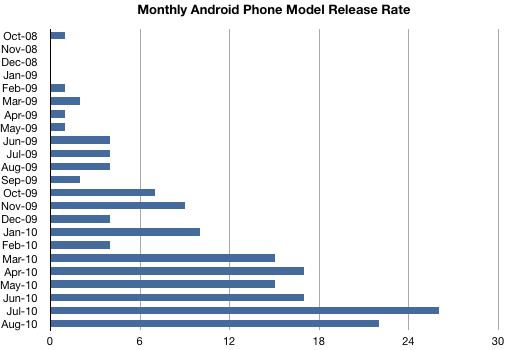
Next month will be the 24th since the first Android device launched in October 2008. The G1 was followed by another HTC device in February of 2010 and a few others in the spring. The summer of '09 showed a steady release of up to four new phones every month. Since then the number of Android phone stock keeping units (SKUs, uniquely identifiable stockable products) increased dramatically, with the release rate increasing to 26 per month during July of this year (source: pdadb.net).
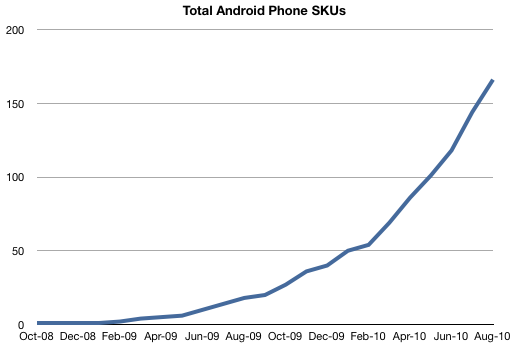
Altogether, there are have been 166 Android phone SKUs in the market with another probable 25 or so ready to launch in the next few months.
Now this may seem like a large number of different phone models in a short time, and it is, but Windows Mobile was even more proliferated as a licensed OS. At its peak over 50 new devices were released every month. The total now is over 1700 and it's still growing.
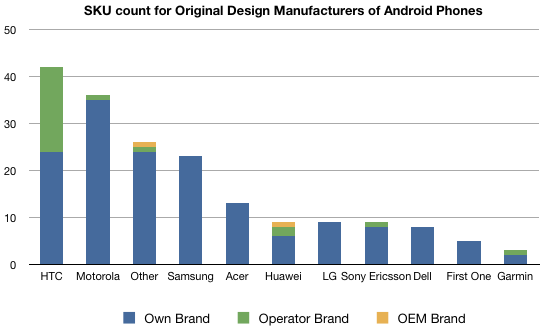
The 183 known Android devices are distributed among 10 principal vendors with another 18 minor vendors. The 18 "other" vendors (see footnote 1) have either one or two devices in the market.
The vendors or original design manufacturers list ranked by most devices follows:
I broke out the devices also by the number of operator branded devices designed by the same manufacturer (green) and any devices designed and built by one vendor but sold under a different vendor's brand (orange). It shows how, excluding "other", HTC is the most prolific Android builder (and seller) but also how it still depends a lot on Operator branding.
The proliferation of Android devices is indeed striking, but as I've pointed out before, the licensing model for Android is symmetric with that for Windows Mobile with the exception that Android is both open source and cost-free to license. This should make it highly disruptive to the paid-license model that Microsoft worked so hard to implement. It should be no surprise then that the adoption dynamics for the platform are very similar, with the same licensees that took Windows Mobile a few years ago embracing Android today.
The proliferation still has a while to go. There is production capacity for over 2000 SKUs among all the vendors in the market (especially the "other" category) and it's only been two years since a stable version of the OS has been available. So it would not be surprising if the total number of licensed Android products will overtake the 1700 or so Windows Mobile SKUs.
So what's the paradox?
The question that should jump out from this data is what's the value to the participants in this, or any mobile OS licensing model? When I analyzed the Windows Mobile field in 2007 or so, it was pretty evident that very few vendors other than HTC shipped enough volumes to make a product profitable. In fact, I coined the phrase Pocket PC Paradox to describe the situation where hundreds of vendors would line up to make undifferentiated products competing for a shrinking pie. This went on first with Pocket PC PDAs, then repeated with Windows Mobile and is now repeating with Android. Nobody ever made money except for HTC, not even Microsoft.
It's still a mystery to me why any manager would decide to make the (n+1)th Android/WinMo phone. It must be difficult to make market projections that justify the cost of developing and marketing this new product.
But here's some help: The total number of Android phones sold through the end of last quarter was about 23 million units. The total number of SKUs launched to date then was about 118. That means that the average Android phone SKU sold 200k units (2).
Now this may seem comically low, but I will again bring up history and point out that while the WinMo bubble was in its zenith, the average Windows Mobile SKU had 50k units sold. With the SKU count increasing more rapidly than the sales rate (40% more SKUs since June) it's very likely that the average units per SKU is dropping. So by my reckoning there's plenty more in the Android bubble to go.
-----
(1) The "other" category includes the following vendors:
Lenovo
Gigabyte
Highscreen
Notion Ink
WayteQ
Forsa Posh
Inventec
Kyocera
Pantech
TechFaith
Saygus
Sharp
Ziss
Alcatel
General Mobile
(2) I'm fully aware that the distribution of sales over the products is not even and very likely exponential, but there is no way to predict whether a given new product will be a "hero" or DOA. The dream for every manager must be that his product will be a star, but the odds get worse and worse over time and the average units sold has to be considered as including these odds.
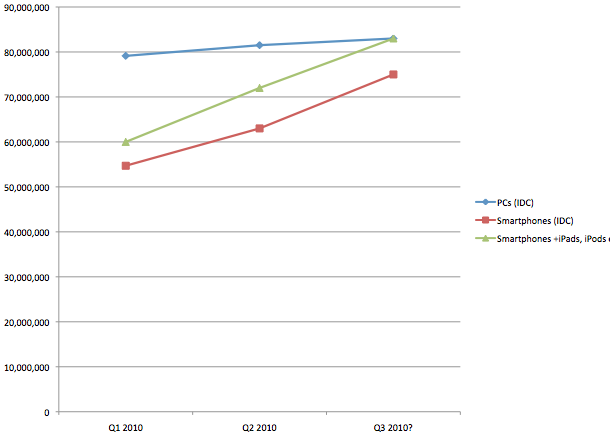
Smartphones, or Mobile devices, will soon become the dominant computing platform for humanity and supplant the PC which has reigned since Apple ignited the Personal Computer revolution in the late 1970's.
I guess Gartner didn't get the memo. By keeping the two categories separate, it implies no overlap in consumption and hence no need to worry if you're in the PC business.