Asymco

Asymmetric Intelligence

Horace Dediu

  1. The Monopolist

    Research · 36 comments

    When the Apple Watch will begin sales, there will have been dozens of "smart watches" released. At CES this week at least 56 "wearables" were on display. One could be forgiven for thinking that Apple's Watch will compete with at least that many alternatives. Those alternatives don't even include the entire existing mechanical and electronic watch market, which, surely, is also filled with competitors.

    When analyzing competition, it's easy to get caught up in one-on-one competitive comparisons, each posited as a decisive life-or-death battle. Consider the list of competitors that Apple has been declared as being in a death-match with:

    • Real Networks. Yes, there was a time when Apple's survival depended on success vs. alternative media encoding technologies.
    • Adobe. Remember Flash? No Flash support meant that Apple's fledgling phone would fail.
    • "The Music Industry". Unhappy partners could surely shut down the iTunes music store, and their insistence on DRM would surely cripple the experience.
    • IBM. In nearly every aspect, their business/strategy/inclination and glimmer of intent was an existential threat the Apple.
    • Microsoft. In nearly every aspect, their business/strategy/inclination and glimmer of intent was an existential threat the Apple.
    • Google. In nearly every aspect, their business/strategy/inclination and glimmer of intent is an existential threat the Apple.
    • Samsung. Obviously. But not just phones or tablets. They have control over key components that Apple used in many of its products, before the iPhone even.
    • Palm/BlackBerry/Nokia/HTC/Huawei/Xiaomi et.al. Every phone maker (and every phone) was/is an existential threat to Apple.
    • Dell/HP/Asus/Lenovo et. al. Every PC maker was a threat to Apple. Some of them made MP3 players. Some of them make tablets.
    • Amazon. Obviously. Not only as an iTunes killer but as a device disruptor. They are working on drones, after all.
    • Sony. Remember them? No longer a PC maker but they moved in many circles Apple moved in. While we're at it, add all the consumer electronics companies in Japan.
    • Dropbox. "If Apple can't do iCloud right, they're doomed".

    This is a very short list (feel free to suggest more) and it becomes clear that the total count of competitors that Apple has to counter "or else" seems to number in the thousands. Practically every hardware, software and service company is positioned as an "Apple Killer". in fact, the more interesting question might be which companies are not competing with Apple.

    Another interesting question relates to why there is no transitive property of competition. I.e. if company A competes with Apple and Apple competes with company B then it does not follow that company A competes with company B.

    To wit, whereas HTC competes with Apple and so does Dropbox, it does not follow that HTC competes with Dropbox. So it's entirely possible that it's axiomatic that

    "Most companies compete with Apple but few of them compete with each other".

    Recognizing a pattern, one could build a model of the technology world where Apple is the focus of all competitive efforts. But this starts to sound absurd.

    Indeed, the flaw in the logic is that these competitive pairings are based on the overlap of features of products/services being offered. The features become the attributes of a product which supposedly defines their competitive power. But this is false for the same reason that the attributes of a buyer do not determine their buying behavior. Buyer attributes ((E.g. demographic, sociographic))  are easy to measure and they may correlate to purchasing behavior but they don't cause it.

    Similarly, product or company attributes are easy to measure and they may correlate to competitive behavior but they don't cause the substitution of a purchase.

    Therefore, appealing to Apple to change its strategy, operations or even its core beliefs in response to a competitor's behavior is deeply misguided. The cause of success and failure in the marketplace is based on being hired by the customer to get a job done. Once hired, the chances are that the trust is secured and the relationship continues even if alternatives are available. There is comfort in the knowledge of whom you're working with.

    This aspect of trusted relationship between the buyer and the product and the interweaving of 'brand' (aka intentions) of the hired is the root of loyalty. Of course, loyalties can be betrayed and trust can be lost. But that implies that the primary responsibility of the manager is the creation and preservation of trust. When seen in this light, an alternative axiom becomes clear:

    "Great companies don't have any competition."

    Great companies are "monopolists of customer trust" and are unaffected by alternatives. They are positioned on and nailing the job their products and services are hired for. The alternatives must not only duplicate the exact job (which they almost never do), but they must also overcome the switching costs.

    Remember this when analyzing the impact of yet another competitor and considering the "Apple must fix/do X or else" assertions.
     

  2. The 2015 "Sleeper Ideas" List: Trends, Stocks, And Private Companies To Watch - Forbes

    Research · 16 comments

    My choices:

    1. Cyanogen. This company should develop a credible path for AOSP (non-Google Android) especially in India. I expect a lot of traction as OEMs who embrace Android reject Google.

    2. iPad. Not as a consumer product but for the Enterprise. The iPad grows up into a solid product for business while being replaced by phones in consumer “jobs to be done”.

    A few more ideas are listed here: The 2015 "Sleeper Ideas" List: Trends, Stocks, And Private Companies To Watch - Forbes.


  3. The Innovator's Stopwatch. Part 2

    Research · 40 comments

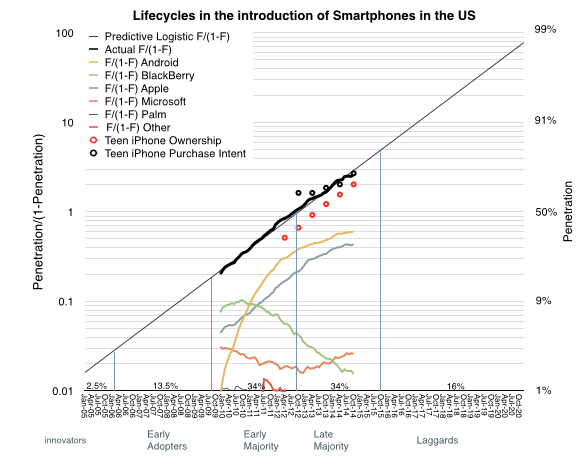
    The adoption curve has been used to categorize adopters into groups by their behavior: innovators, early adopters, early majority, late majority and laggards. This categorization asserts that adoption is function of psychology, or the likelihood of people to act or react within social systems. [Rogers first edition 1962]

    It's a compelling model and has been proposed as a tool for firms to help with their marketing strategy. As diffusion proceeds through each adopter category, the product is re-positioned to address each group's presumed behavior. Innovators (first 2.5% of the population) are offered novelty, a chance to experiment and uniqueness of experience; early adopters are offered a chance to create or enhance their position of social leadership; the early majority build imitate the leadership of the early adopters and justify it with productivity gains; the late majority are skeptics but, given a set of specific benefits, join the earlier adopters. Finally the laggards reluctantly agree to adopt as their preferred alternative of not adopting disappears.

    The theory suggests that a firm can be successful if they modify their marketing and perhaps product mix to accommodate these adopter categories in a timely manner.

    If this is the case however, why is it that those who have access to these data (i.e. who is buying and when) not to do the right thing? Why is it that during a technology adoption curve, there is a high degree of turnover in the firms which capture profits from the products that deliver this technology?

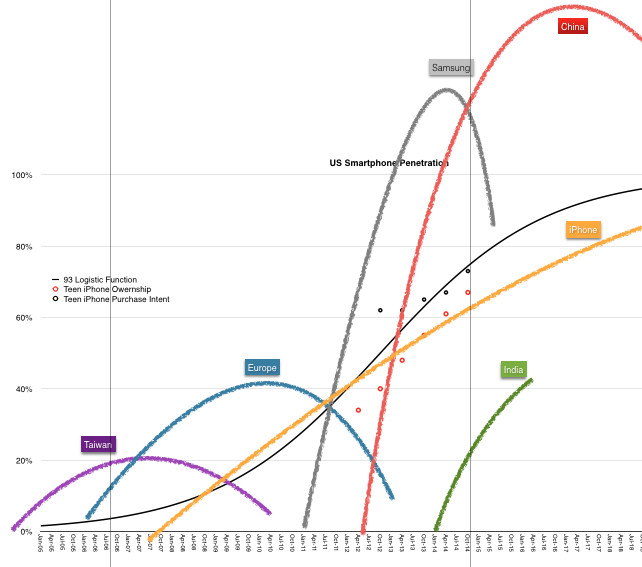
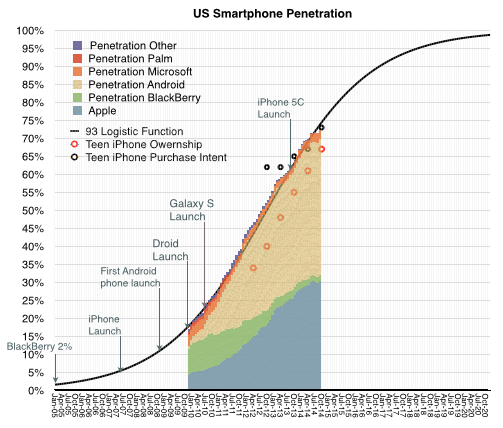
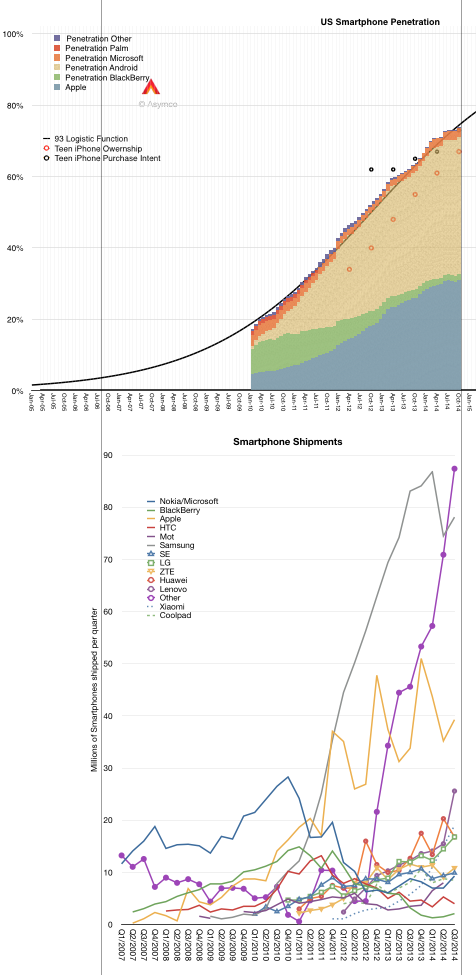
    If you don't believe this to be the case, consider the smartphone market. The data about buyers is easily obtained (even without paying a fee). Shown below is the US smartphone penetration data as obtained by comScore (including teenage survey data from Piper Jaffray).

    Screen Shot 2014-12-16 at 5.07.41 PM

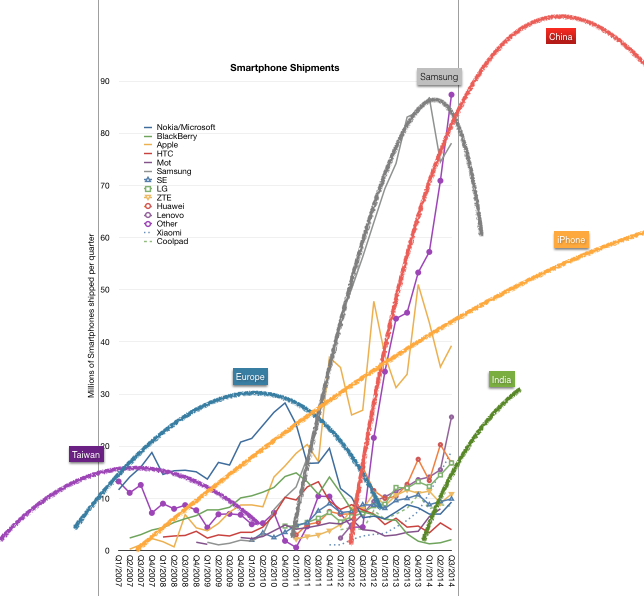
    Following the penetration data there is a second graph showing the smartphone shipments for the largest vendors as well as the sum of the "others" which make up the difference with the total market. I used vertical registration lines to align the different data sets to the same time scale.

    Having observed the market for some time, it's possible to see a set of "epochs" which show the rise and fall of various platforms/vendors/geographic production areas. I applied these "epochs" as a rough sketch over the production data.

    Screen Shot 2014-12-16 at 5.26.11 PM

    I define these epochs as:

    • The Windows Mobile epoch from 2003 to about 2010 peaking in 2007. Competitors from Taiwan using Windows Mobile fielded a large number of devices and led that platform to win over proprietary Palm and Symbian.
    • The Nokia/RIM epoch from 2005 to about 2012 peaking in 2010. Nokia's distribution power takes its platform to global dominance. At the same time BlackBerry surges in popularity peaking at about the same time.
    • The Samsung epoch from 2010 to (probably) 2016 peaking in 2014. Samsung surges from almost no smartphone volumes to double the nearest competitor in a matter of three years.
    • The Chinese epoch from 2012 and ongoing. With a vast number of new competitors doubling or tripling sales over a few short years, "Other" becomes once again the bulk of volumes with additional brands like Lenovo, Huawei, ZTE, Xiaomi, Coolpad adding to the total.
    • The (probable) Indian epoch from 2014. This epoch is not so much of or about India as the "local brands" which begin to have large, even majority, market share in markets such as India, Indonesia, Philippines, Vietnam, etc. This epoch is the triumph of the local over the global and represents the latter stages of adoption.

    Now I deliberately left out Apple because, as can be seen in the shipments data, Apple never held a pre-eminent volume position. It is however a competitor with a steady rate of growth. So steady in fact, that it seems to mirror the overall market. Essentially, Apple shows that there is a potential for growth without competitive flux. A type of growth that is "systemic" rather than a function of some rivalry and hence turnover.

    But Apple is an exception. As so often it tends to be.

    The real puzzle is why are there so many turnovers in leadership in such a short span of time. The idea that five distinct eras can exist in a mere decade seems preposterous. These turnovers are not without economic drama. They are booms as well as busts. They happen in a market where there are literally billions of consumers spending the equivalent of $300 billion/yr. so the stakes are pretty high.

    But it's even more strange. If you super-impose the epochs on the (early) diffusion curve you can observe how a predictable adoption curve ((I.e. one whose shape can be determined well in advance and updated with very high precision)) results in unpredictable success in the market.

    Screen Shot 2014-12-16 at 5.38.51 PM

    There must be something about the way companies behave *while* they are watching the evolution of the market. They seem to be running at a cycle time far faster than the market's overall absorption rate. Is this because competition is forcing them to mis-spend their energies?

    Could it be that the behavior of firms is also a function of the psychology and reward systems of managers? That they seem compelled to optimize for a time frame shorter than the economic lifespan of the technology? That this mismatch of phase between lifespans of a technology market and their profit model leads to premature demise of their market position?


  4. The Innovator's Stopwatch. Part 1

    Research · 16 comments

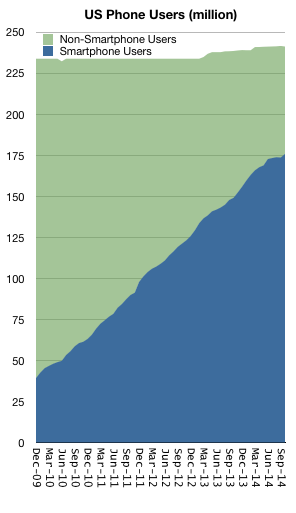
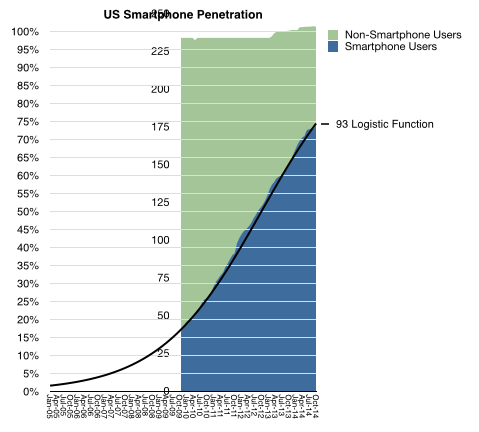
    At the end of October 2014 about 73% of US mobile users owned a smartphone. In March of 2005 2% of US mobile users owned a smartphone  (comScore). In absolute terms the number of users increased from about 4 million to 176 million and these 172 million new users were added in less than one decade.

    Remarkable as that may be, what is even more exciting is that the pattern of adoption is predictable. The following graph charts the adoption of this product category with a monthly resolution between January 2010 and October 2014.

    Screen Shot 2014-12-10 at 2.12.21 PM

    Knowing the datum for March 2005 allows us to fill-in the graph with a logistic function approximation for the period to date.

    Screen Shot 2014-12-10 at 2.13.46 PM

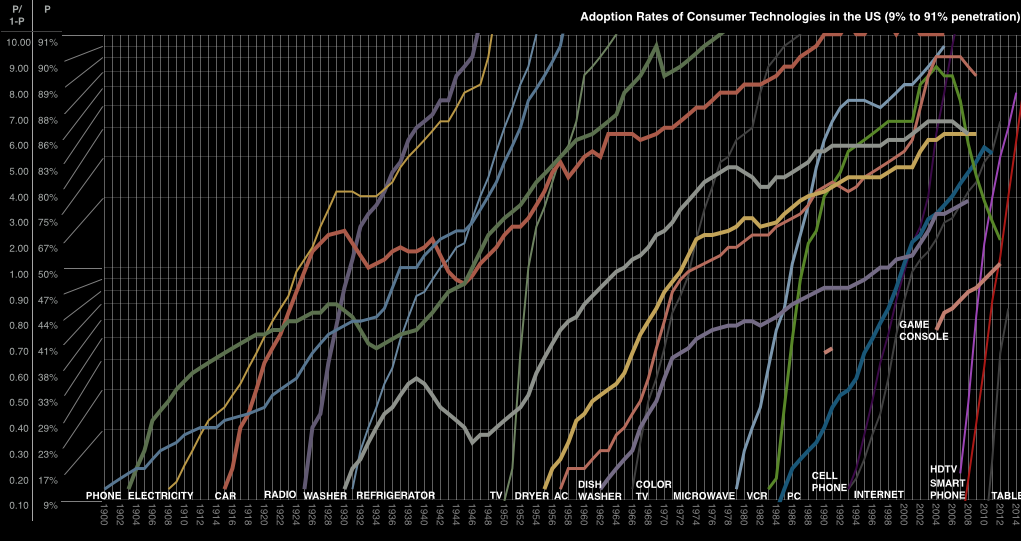
    The logistic function is a wonderful model for how technologies are adopted. It's been evident in samples take for dozens of diffusions, from 18th century canal construction, 19th century railroads, 20th century consumer products as well as industrial and agricultural innovations and the internet itself.

    Screen Shot 2014-12-10 at 2.15.00 PM

    The reason the logistic curve is so commonly observed is because of its reflection of sociological behavior. When a technology serves a manifest need (or can be hired for a distinct, unmet job to be done) its universal adoption is a certainty. The only unknown is the rate at which this happens. As the graphs above show, some technologies are rapid (examples) and some are slow. Some could be constrained by the communication of its benefits or by the presence of regulation or by the unavailability of infrastructure or resources or financing. Conversely, some could be accelerated by conformability with existing infrastructure or by network effects resulting from communication between adopters. The balance between accelerants to adopting and the constraints on adoption yields the "slope" in the logistic curve.

    So given a high degree of confidence in the model, we can forecast how smartphones will be adopted. This model yields further details such as when the various classes of adopter (Early/late/laggard) will join and perhaps that itself will allow managers to plan their marketing and product development.

    It would seem therefore that this tool is the answer to building a successful and sustainable enterprise. It would seem that the early movers would have an advantage as their users create the virtuous cycle of learning which the firm will use to capture later adopters. It would seem that firms can effect strategy changes to adopt to each wave of users added to the user base.

    It would seem but it has not proven to be the case. For most technology categories, the predictability of adoption has not aided or informed success for firms competing to supply the burgeoning market. If we look at the firms which supply the smartphone market in the US (with platforms as proxies) we see how much turnover has occurred. All the early movers are highly disadvantaged and even some of the later entrants are not assured of viability into the later stages of the market.

    Screen Shot 2014-12-10 at 2.17.18 PM
    Screen Shot 2014-12-10 at 2.18.24 PM

    It's a something of a paradox that as a technology takes root we might be able to predict how it gets bought but not who will sell it.

    This paradox is at the root of the volatility in asset pricing around technology firms. The question investors typically sweat is not whether a company is in the right market, but whether it's in the right time.


  5. Retail in 2020

    Research · 5 comments

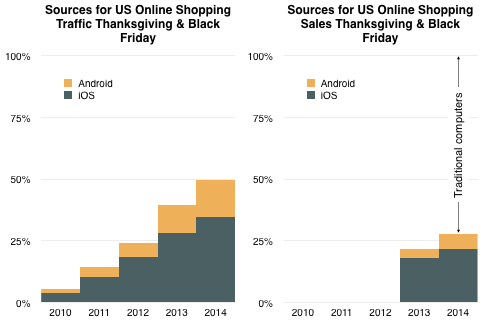
    This year's Thanksgiving and Black Friday data from IBM shows a continuing pattern of growth for mobile devices. As the graph below shows, in the five years since 2010 mobile devices grew from 5% of the online shopping traffic to 50%.  Traditional computing (desktop and laptop) made up the difference.

    Screen Shot 2014-12-01 at 10.34.30 AM

    The graph also shows that sales value via mobile devices crossed over 25% of online spending. The fact that mobile shopping is not equal to mobile spending is due to the convenience factor of mobile. It's more likely that users will spend idle time scanning for bargains or tracking down ideas from friends but wait until they are at home to make the final purchase decisions in front of a computer.

    The transition to spending directly from a device is a slower process, but that process was also one that online had to undertake as buyers became comfortable with online commerce. When it comes to payment, buyers are understandably more cautious.

    This does not change the prediction made last year that "the transition to post-PC consumption will also be practically completed by 2020". That leaves six years for mobile saturation and a total transition time of one decade.

    At that point I expect 90% of browsing and perhaps 75% of spending to be happening on devices. Some of this will undoubtedly be enabled by biometric authentication as shown by Apple Pay. Trust and ease of use in this technology will undoubtedly accelerate the transition making mobile payments more comfortable and secure than on the legacy computer.

    What is less predictable is how much those devices will also be used to transact payments for the physical retail stores. In some scenarios it's possible that by 2020 a majority of all shopping will be enabled by devices. ((There is also the matter of in-store discovery and advertising via NFC and bluetooth i.e. iBeacon)) That would subjugate the retail segment to the power politics of mobile platforms.

    It is interesting therefore to note the mix between the platforms in the graphs above.

  6. Yet another billion dollar business

    Research · 48 comments

    I tried to assess the opportunity of Apple Pay but found it to be mostly dependent on how quickly card payments will overtake cash. It seems that as payments move to a digital format they will move to a mobile device. The hurdle isn't going from a card to a phone but from cash to card.

    Data published in The Growth and Diffusion of Credit Cards in Society  shows that between 1970 and 2001 households with at least one credit card in the US grew from 17% to 70%. More recent data shows 82% of US consumers have at least one credit card and 77% have a debit card.

    The Total Addressable Market for Apple Pay then is dependent on how quickly this pattern repeats over the markets where iOS devices are in widespread use. Once cards are in use they are used with higher frequency and quickly overtake cash for the user.

    The only assumption that needs to be made is that the device then replaces the plastic card. This seems a safe assumption as the benefits of the device as payment authenticator are high and the costs are negligible given a penetrated market.

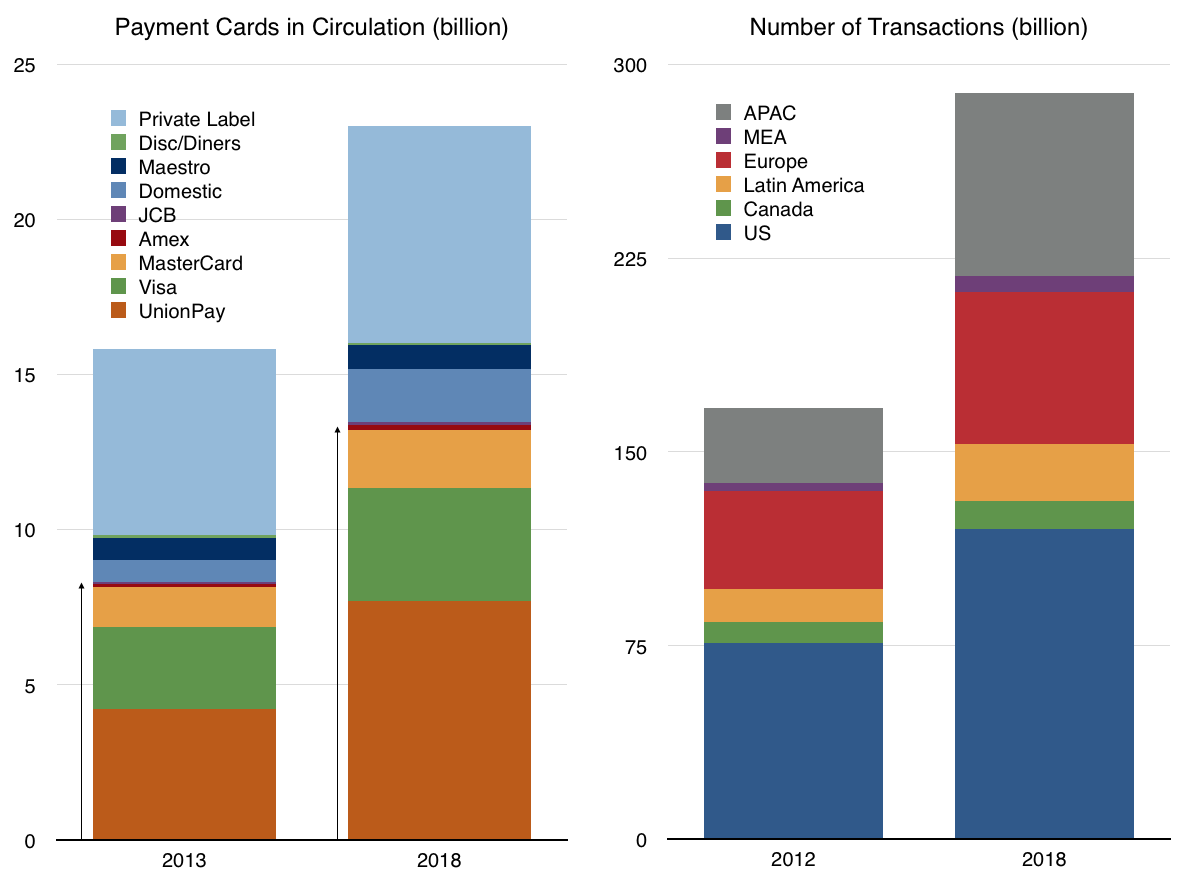
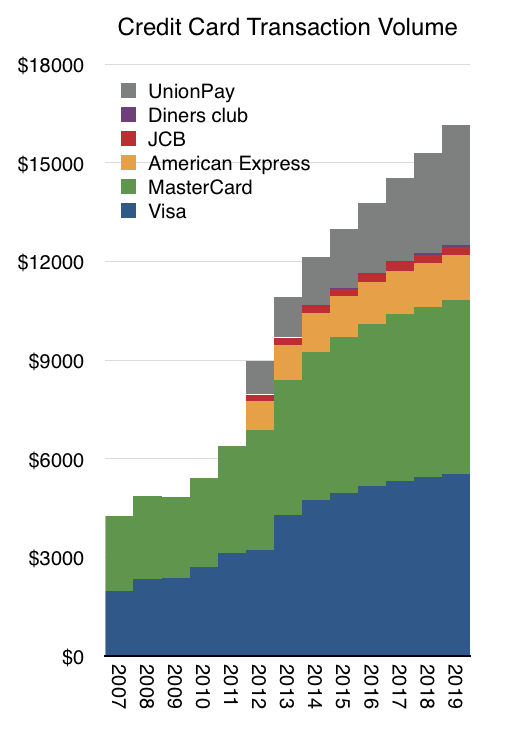
    The following graph shows an extrapolation of transaction volumes where Visa and MasterCard and Amex are showing moderating growth with UnionPay showing 20% constant growth through 2019. ((Supporting these assumptions is a forecast from Nilsen showing total number of cards in circulation by issuer and a forecast of total transactions

    Screen Shot 2014-11-28 at 1.40.01 PM

    ))

    Screen Shot 2014-11-28 at 12.58.21 PM

    Two more assumptions are needed: the share of transaction value captured by Apple Pay and the Apple Pay fee. I used 15 basis points ($15/$10000) as the assumed Apple fee and a share schedule as follows:

    • 2015: 0.5%
    • 2016: 1%
    • 2017: 1.5%
    • 2018: 2%
    • 2019: 3%

    These assumptions result in a cumulative revenue of over $1 billion by 2018 and a yearly run rate of $1 billion in revenue by 2020.

    Although this is not a huge amount relative to Apple's overall revenues ((No more than half of one percent of 2015 revenues)), it's important to note that these revenues are likely to go directly to earnings ((About 2% of 2015 earnings)) as there are negligible costs associated with the transactions that Apple needs to bear.

    These assumptions make the statement that Apple Pay can become "A Billion Dollar Business" plausible by 2020. Perhaps sooner.