Horace Dediu and Guy English join Moisés to look at the rallying forces in the arms race for content. Does Apple have too well-entrenched a lead? How will their gaming strategy compete with traditional consoles? How and why would they make a TV set?
The functional organizational structure may be causal to successful disruption. Although this hypothesis needs much more research and testing, there are correlations in the anecdotal evidence. One of the principles of this theory is that functional organizations are less prone to "political infighting" where a powerful division can disable a self-disruption through the wielding of the power of the Profit/Loss statement.
Under the divisional structure the modus operandi is that once an internal threat is detected, the incumbent division unleashes antibodies to destroy the smaller and less powerful opponent. This is possible because as soon as the threat is perceived, a threat response kicks in and the power to deflect the threat is abundant in the reward and incentive structure. This response mechanism is so common and well understood that it forms the basis of the Innovator's Dilemma.
My hypothesis is that in the absence of product/divisional level power bases, the threat is not felt and the political power to respond is not available. In a functional organization there is no "business leadership", where the P/L "belongs" to one person. Only the CEO has life-and-death power over products and their decision is "purchased" through discussion with functional heads who stand to benefit as much as to lose from disruptive change.
This functional organization decision process is typical if not universal in small companies and atypical if not unheard of in large companies. It's one of the reasons small companies are inherently more disruptive. The challenge for a growing company is that functional organizations don't scale well. There are very few and all depend on vigilant, almost maniacal defense of the structure. Divisional organizations are "natural" at scale and the preservation of functional structures is like fighting entropy.
The organizations which seem to preserve functionality at scale are militaries. This is why I've been thinking about it takes to manage such organizations and preserve their apolitical status.
As it turns out, militaries are also not immune from the corrosive effects of political power. In fact, the slide into corruption begins with the formation of elite divisions. The rationale is simple: elite soldiers whose loyalty and skill are most valuable are chosen for special roles and status. They begin by usually acting as bodyguards to the leadership or the state.
Historically the most prominent such politicized military force was the Roman Praetorian Guard. Having started as bodyguards to the field commander, they transitioned into protectors of the state and, eventually, into destroyers of the state. Their leader, the Praetorian Prefect, became one of the most powerful administrators of the state and his Guard became responsible for numerous coups d'état, assassinations and corruption.
So-called "Republican Guards" became common in many militaries since then. Napoleon's Imperial Guard, the SS in Nazi Germany, the Iraqi and today's Iranian Republican Guards continue in a political role. In democracies, the politicized military is less common but the threat of their emergence is one states must always remain vigilant for.
And so it must be for the functional organization. The emergence of an elite which, by its skill and achievement, gains more responsibility and hence more power is the good intention which paves the road to hell. Leading an innovative organization means having a process of denying power to those who are elites. It means preempting the Praetorian Guards.
Doing so is a dilemma in itself as the elite are not likely to remain loyal if denied their opportunity to power. Managing the motivations of the bright and ambitious is where the art of disruption management lies.
Horace reflects on his analysis of iTunes purchase data, details the just-announced AirShow in Chicago, and touches on fascinating "heat maps" of mobile platform use. We close our week of three shows by talking about "deep focus" and Citizen Kane.
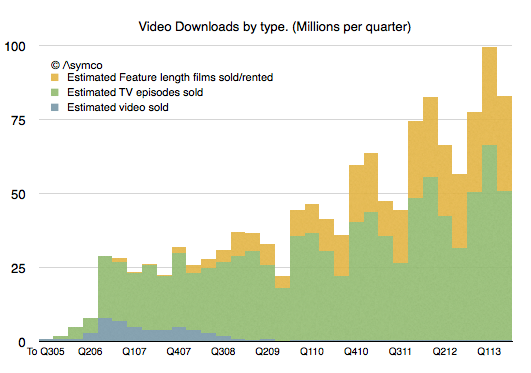
It's been five years since we had an update on TV show downloads and six years since we've had an update on movie downloads from Apple. In Q3 2008 Apple announced 200 million TV show downloads and in Q2 2007 2 million movies. That's a long period with no information making a tough extrapolation to the present.
Nevertheless, I tried. My estimates for these two quantities were 963 million TV Shows and 108.2 million movies to date.
So I was quite surprised to see that figures for both TV show downloads and Movie downloads were published today. The figures were 1 billion and 380 million respectively.
My TV show forecast has proven to be very accurate but I severely underestimated movie download rates. Apple states that the movie download rate is 350k/day. My estimate was only about 126k/day.
After adjusting for the new data, the picture of downloads that emerges looks like this:
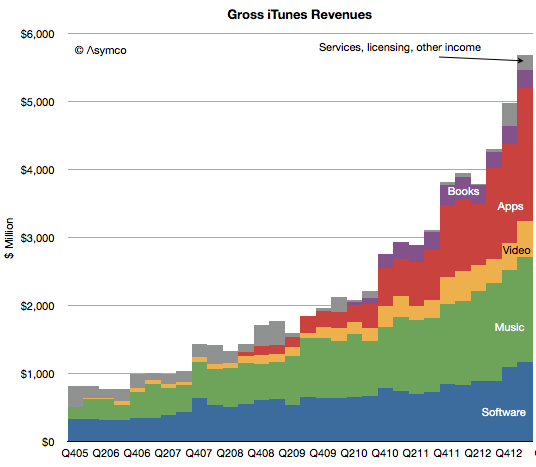
The overall iTunes gross revenues by sub-component becomes:
As a result, my new estimate for the rate of spending on iTunes video is about $1.75 billion/yr. This is much more substantial than prior estimates mainly because movies are much more valuable. A tripling of the download rate shows up as a significant rise in the profile of video vis-à-vis the other media types.
Apps and software are firmly defined and music was somewhat clear. The upward adjustment in Video means that I have to reduce either Music or services. I presently am reducing service revenues but might adjust music as well.
The overall picture of iTunes is becoming clearer every day. We have more information about number of users (575 million), what they spend on media and software and services ($20 billion/yr.) and, increasingly what they spend on each media type (about $9/yr on Software, $2/yr on books, $16/yr on apps $12/yr on music and $4/yr on video.)
We're excited to bring the second Airshow to Chicago in July. Thanks to Ryan Singer and Jason Fried of 37signals.com for offering to host us this summer. Their venue is ideal for our particular pedagogy.
Speaking of which, I should explain what it is.
Our first Airshow (San Francisco, June 9th) had several objectives:
To explain a theory of narration with data, especially big data
To narrate this explanation with a tool called Perspective
To reveal and test a new feature within Perspective called airshow
Now that we have revealed the feature (mirror your presentation including your direct manipulation of the visuals to any member of the audience—wherever they may be—on their own device, available in version 3.0) we can talk more freely about the structure of the show.
It's in three parts:
Performance
Cooking Show
Theory
The Performance is the "keynote story" whose recipe we show in the Cooking Show and whose motivation and foundations we deconstruct in the Theory. You can think of the sections as as answering "{What, How and Why} make a great story."
The show is self-referential in that we use the process we teach to do the teaching. In other words, we use a great storytelling tool to tell great stories about storytelling. Furthermore, Airshow, as a show, uses a tool whose feature is itself called airshow.
It's not that complicated; at least not if you understand recursion.
In the second part of our WWDC wrapup, we delve into the large-scale shift represented by iOS 7. Siri guides us on the journey from navigation to consumption in our latest AsymCar segment, and Horace examines what iWork for iCloud means.
In the first part of a post-WWDC "doubleheader", we look back at AirShow and begin our dive into the keynote, with regard to Apples hardcore product Mac Pro, Mavericks, iTunes Radio, and examining discovery versus playback.
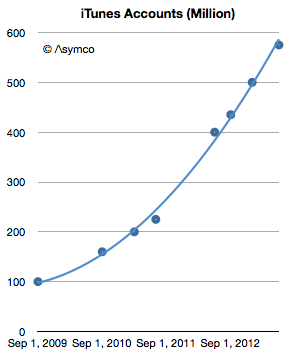
This week Apple announced that iTunes has 575 million accounts. This is the 8th update (that I know of) over the last four years. The history of this data is shown in the following graph.
The number of accounts has increased by almost a factor of six since late 2009. It amounts to an account growth rate of about 500,000/day or 44% compounded annually. Not bad, but along with this increase what happened to revenues per user?
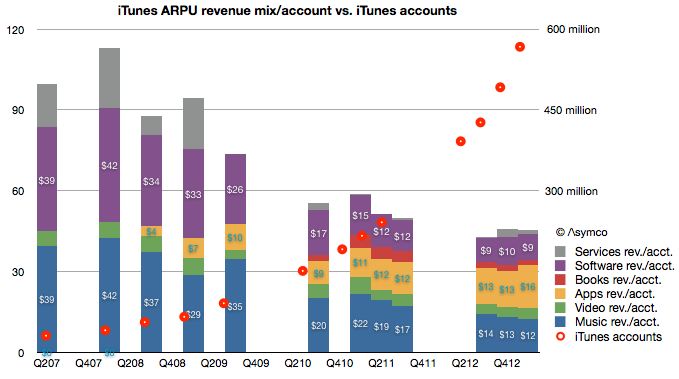
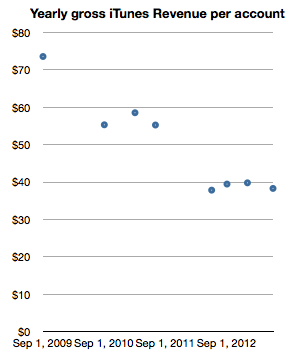
Looking at iTunes revenue (gross) reveals a picture of revenues/account, shown below:
This can be read as: "Each of the current 575 million accounts generates about half the revenue of the 100 million accounts of 2009." One would expect such a decline as an user base expands and this approximate 50% decline in revenues per account seems reasonable for a six-fold base increase. In absolute terms the graph shows that an iTunes account generates about $3.2/month in transactions.[1] Put another way, during the last year, an average of $40/yr of economic value is generated by every iTunes account.
Stretching further, one could also use the 575 million iTunes accounts as a proxy for "the Apple customer base". The assumption would be that iTunes accounts are attached to some Apple product, be it an iPhone, iPod or Mac. As a bounds check, a total of 865 million Apple devices (which interact with iTunes) have been sold since 2007. Assuming 575 million users does not seem to be a contradiction.
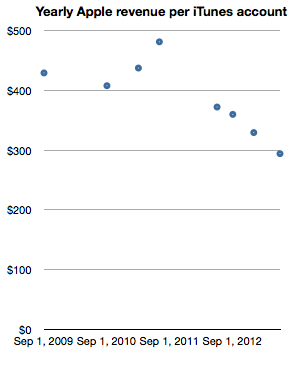
The logic deployed would be that it's unlikely for a consumer to have an iTunes account without owning or using an Apple product. If we take this leap in logic then it would make sense to measure Apple (not just iTunes) revenues per iTunes account. In order to smooth out seasonality I took trailing twelve months' average quarterly revenues and measured the following company revenues per iTunes account.
Note again the reduction in revenue per "customer" as the base grows. The reduction is less pronounced however, with about one third lower spending for a sextupling of the base. One can read this graph as "Three years ago an Apple customer used to spend $400/yr on Apple products but as the number of users increased six-fold the spending decreased to about $300/yr per customer."
The practice of valuing a company by the rate of spending of its customer base is not uncommon, especially when the customer base is relatively loyal. Apple emphasized the importance of customer satisfaction (and, implicitly, loyalty) during its WWDC presentation. It was singled out as the most important metric they track. So perhaps valuing Apple itself on the basis of repeat purchase behavior should be considered.
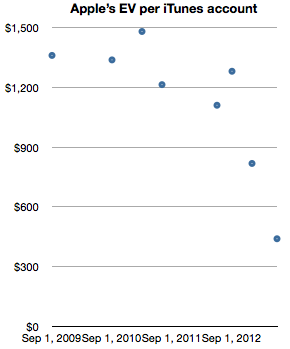
When framing the value of of the company itself as a function of users (in the form of iTunes accounts) we get the following graph.
The graph measures the Enterprise Value (i.e. Market cap minus cash) on a per-customer (i.e. iTunes account) basis.
It shows that for a number of years—from 2009 until late 2012—Apple's users were valued (implicitly by the stock market) as likely to create a net present value of about $1200 in earnings. The current value is about a third of that, or $440 in earnings. Today's expectation is therefore that each current customer will buy the equivalent of 1.8 iPhones. And nothing more, ever. A few months ago it was expected that each customer would buy three times as much.
Although the rate of spending of each customer is decreasing, the number of new customers is increasing more rapidly. As this is happening the company's equity is being priced such that an Apple user is considered less than half as valuable as she used to be—from 3.2x revenues to 1.5x revenues. This change in user value has been quite abrupt, happening only within the last nine months. What could justify a drop in user value would be a drop in customer satisfaction or loyalty. So far, I have seen no evidence of this happening.
--
Notes:
Note that these revenues include App Store, Music Store, TV Shows, Movies, iBookstore, Mac App store, and Services (including iCloud). Some of this revenue is not reported as part of Apple's statement of operations since some content is treated with an agency model.
One of the most startling announcements during the WWDC 2013 was iOS in the car. The mockup that was shown seems to indicate the use of the car's in-dash display as an "external monitor" for an iOS device while control would come from inputs using Siri.
The technical details were not released so it's hard to know the protocol used to accommodate this interface. However it seems that it will be generic enough that a number of launch brands signed up for the launch. The list includes Honda, Mercedes-Benz, Nissan, Ferrari, Chevy, Infiniti, Kia, Hyundai, Volvo, Acura, Opel and Jaguar.
Is this a significant opportunity?
Before we get excited, it's important to note that this will likely take a very long time. It won't even begin until 2014 and the number of new models may trickle into showrooms quite slowly. Consider that the time it took for automakers to universally support external audio input (mostly the trivial line-in) was about a decade.
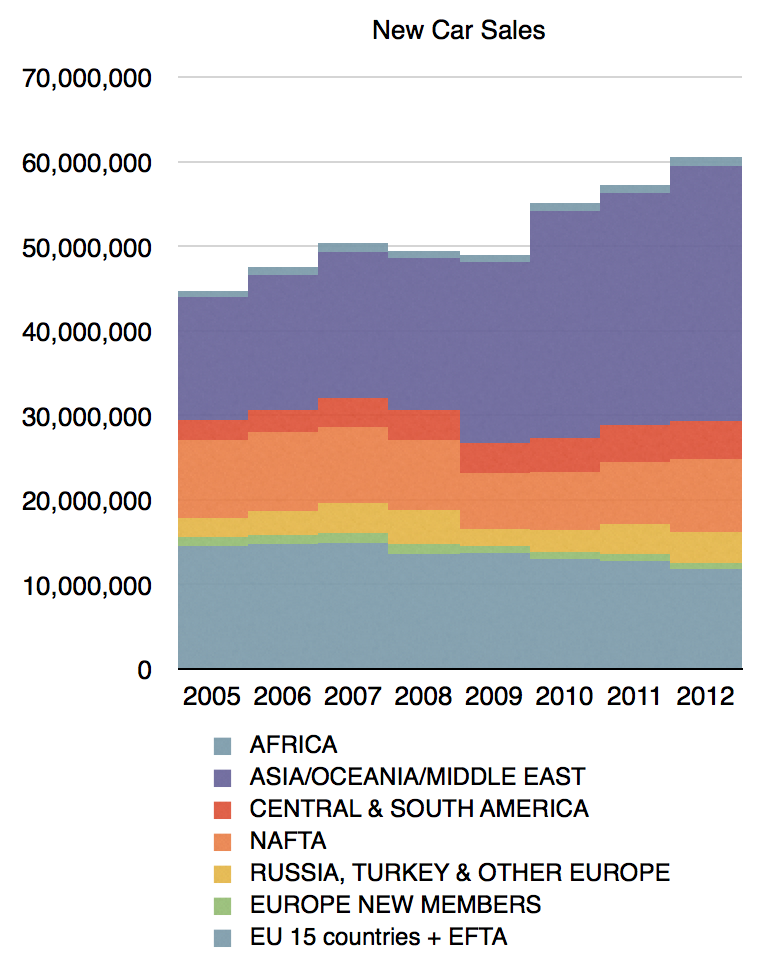
To also curb our enthusiasm we need to realize that the car industry does not produce many units. In 2012 there were over 60 million cars produced (with the following regional mix:)
In contrast, 60 million is about the number of phones sold every two weeks. In 2013 there will be more iPads sold than cars.
In particular the companies mentioned had the following production figures in 2011:
Honda (including Acura): 2.9 million
Mercedes Benz (Daimler): 1.44 million
Nissan (including Infiniti): 4.5 million
Fiat (Ferrari parent): 2.4 million
GM (Chevy, Opel parent): 9.1 million
Kia: 1.6 million
Hyundai: 6.6 million
Volvo: 315k
Tata (parent of Jaguar): 1 million
Including the parent companies and all vehicle types they produce, the total is about 30 million units, or about half of the world-wide production. Obviously, not many of the cars produced will have iOS in the car capability.
Therefore the total unit opportunity is not very significant, perhaps less than 10 million a year. Is there a per-unit cost that compensates for this?
This is harder to answer. The way Apple has been licensing accessory makers is through the MFi (Made for i) program. There used to be a flat 10% fee off of the retail price of the accessory sold. However, there may have been changes. The licensing fees are not public and it's quite possible that the price is a flat amount per unit and that it's a negotiable. It's hard to know what terms are being negotiated with automakers but my bet is that it's not likely to be a significant source of revenue per unit.
So the total revenue from licensing the "Made for iPhone" trademark to automakers won't be significant.
But it is significant for the car industry. The significance is that cars have finally risen to the role of being phone accessories. They have acquired the ability to participate in a computing ecosystem. During all these decades when the world has embraced the information society and intelligence has been embedded in the fabric of life, automakers have resolutely avoided being a part of it. Automotive information, connectivity and user experiences have remained in a Galapagos Syndrome-like isolation from reality. The reasons are rooted in the crisis of rigidity that plagues the industry, something I've touched on briefly in The Critical Path podcasts (e.g. Asymcar).
So this is a hopeful development. If.
If it actually moves at a slightly-faster-than-glacial speed.
If sufficient cars get display systems (billions are produced for the pockets of young and old, poor and rich; but cars have to be considered "luxury" to be graced with an LCD)
If standards are adhered to.
If all brands (which operate individually as autonomous divisions irrespective of group-level strategy) accept the notion.
If these and many other conditions are met, it would allow, finally, the migration of autos to the status of information appliances and, eventually, to being hired for jobs that are currently left undone.
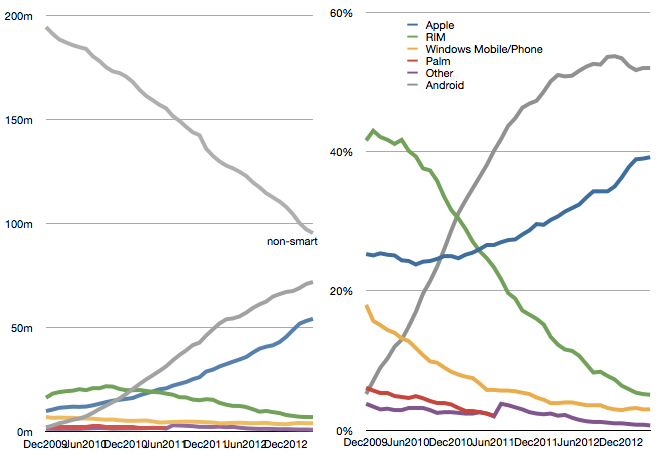
The latest comScore US smartphone install base data is in and there are few surprises. iPhone has reached a new record high penetration (39.2%) and user base (54.3 million). Android has reached a new high in user base (72 million) but share at 52% is below the peak reached in November 2012.
This pattern of gradual iPhone share gain in the US has been consistent for over two years even while Android has catapulted into an overall lead. The surprising thing is how Android seems to have peaked in share. There are still 95 million non-smartphone users and there seems to be headroom for growth even though the other platforms have been tapped out. But it does not seem that Android phones have any particular advantage over iPhone. My hypothesis remains that as price is taken out as a differentiation, the adoption of iOS is slightly higher than Android.
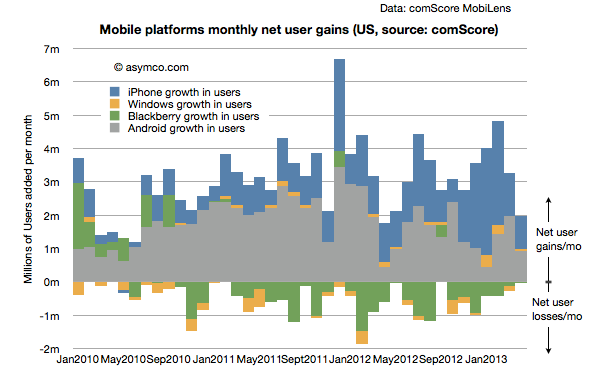
Another measure of market performance is the implied net platform user gains which is shown below:
It shows that iOS added more users in the last few months than Android.
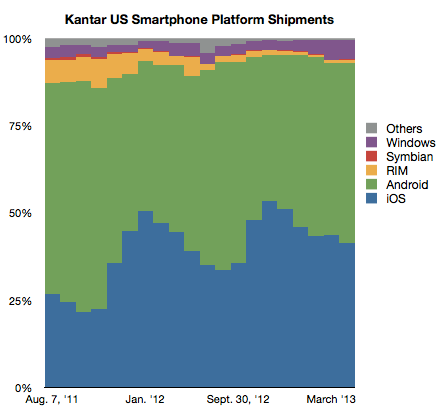
The problem is that Kantar Worldpanel measures shipments and their share data shows a seemingly different picture.
In their data Android is shown as selling more units during January through April while Apple sold more during October through December. Of course we don't have the absolute number of units so can't see the effect of higher holiday overall sales volume. Nevertheless, the balance of growth seems to be disproportionately in favor of Android relative to the data from comScore.
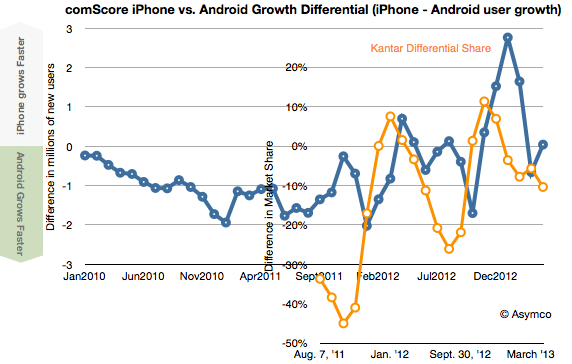
To look at the situation more closely I measured the differential in user adds for comScore and the differential in market share for Kantar's data. Then I overlaid the two differentials so that months are matching, as shown below:
There is a similarity to the frequency of oscillation with comScore data showing a delay (as would be expected since their data is sampling over a three month period). However, we are still facing a vertical offset where there is apparently more growth bias for iPhone in the comScore data.
Possible factors which might be explanatory:
Methodologies used. comScore data excludes ages below 13 and non-personal devices (business expensed phones.)
Replacement sales are invisible in comScore data since the user base does not change when phones are replaced (and old ones are discarded.)
Missing data from Kantar. Given their survey methods it's possible that their panels miss some market segments.