Asymco

Asymmetric Intelligence

Horace Dediu

  1. The cost of building Galaxies (and iPhones)

    Research · 33 comments

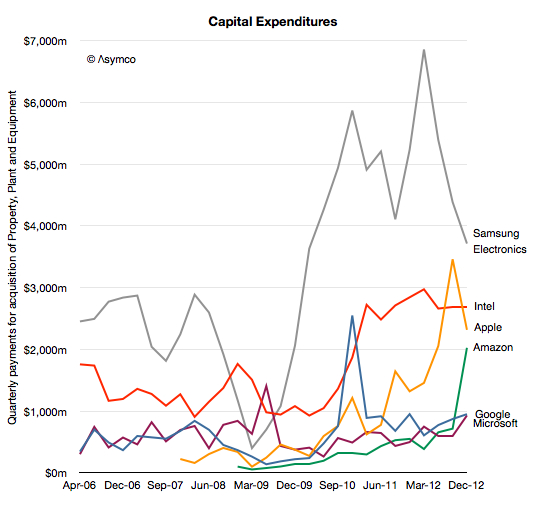
    Although Samsung and Apple are acclaimed as the leaders in profit capture for smart (and otherwise) phones, what is not lauded is how much they spend on capital equipment used in the making of these phones.

    In 2012 Samsung spent around $20 billion while Apple spent about $10 billion (excluding leasehold improvements or Apple stores but including real estate).

    Compare these figures with Intel at $11 billion, Google at $3.2 billion, Microsoft about $2.8 billion and Amazon $3.8 billion (including presumably new distribution centers.)
    Screen Shot 2013-04-04 at 4-4-5.51.15 PM

    What each company spends on differs depending on its business model, but as the graph above shows it's easy to see that there is a class of "big spenders" who spend so much that it makes it hard to imagine just what $10 billion/yr could actually buy.

    To get an idea of just how big that figure is consider that a Nimitz class aircraft carrier costs about $4.5 billion to build and it takes several years to do it. Or consider that the largest data center in the world probably costs about $1 billion or that the largest office building will cost between $4 and $5 billion. Either of these infrastructure projects are massive multi-year projects. Apple, Intel and Samsung spend well more than this every six months.

    So it's a special class of equipment which falls in the multi-billion dollar range: semiconductor process equipment.

    Whereas in the case of Intel it's the obvious target for the funds, how can we assume it's the case for Apple and Samsung.

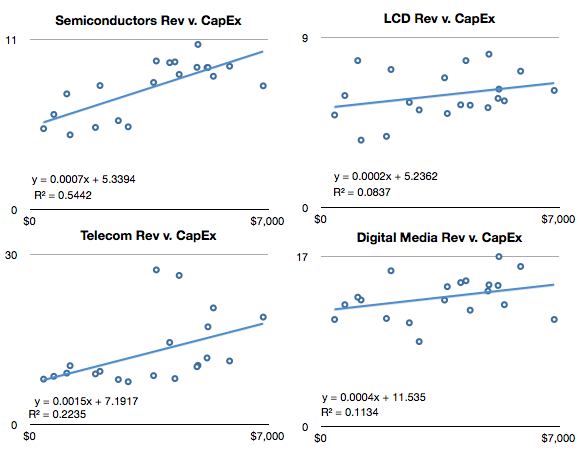
    We don't have proof but there is a remarkable correlation between CapEx and Semiconductors in Samsung's divisional financial reports:
    Screen Shot 2013-04-04 at 4-4-5.58.22 PM

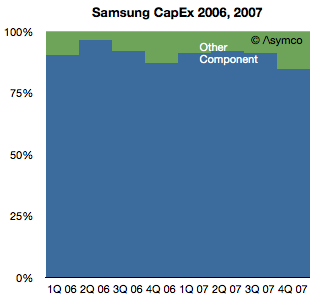
    We also have the historically reported allocation of CapEx as reported prior to 2008:
    Screen Shot 2013-04-04 at 4-4-6.00.26 PM


    Therefore I consider it safe to assume that the bulk of Samsung's Capital Expenditures are in support of semiconductor production (note that this does not include display panels).

    Note however that in the first graph, Samsung's expenditures seem to be declining. Measured in Won, the level in Q4 '12 was about the same as that in Q1 2010 and down 30% y/y. Apple's spending also dropped sequentially in Q4 but was up 75% y/y. It's also nearly ten times higher than what Apple spent in Q1 2010.

    So the question I would ask is whether Samsung's reduction CapEx (which is safely assumed to be supporting semiconductor production, and which, in turn, is, to a large degree, supporting Apple) is being picked up by Apple.

    If so then then this would be evidence of the re-alignment of role and control in the value chain of a terribly important industry.
  2. The cost of selling Galaxies, updated

    Research · 63 comments

    Thanks to @jtk0621 via twitter I was able to obtain a quarterly view into Samsung's SG&A expenditures by cost category.

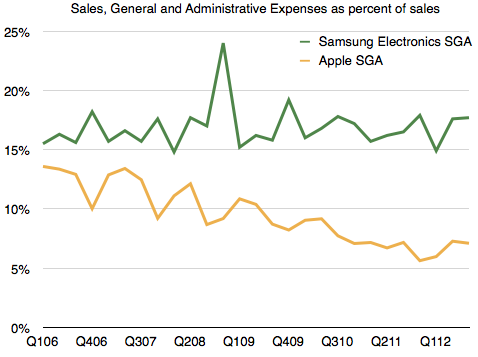
    The value of this data is in being able to understand why Samsung SG&A as a percent of sales remains fairly constant. To recap, the discrepancy with Samsung's SG&A is that it has grown in proportion to rapidly rising sales. Normally, when sales grow, SG&A grows but when sales grow very rapidly, SG&A grows a bit more slowly since it's primarily a function of headcount and hiring is necessarily organic and hence slower as a process.

    The contrast is shown in the following comparison between Apple's SG&A and Samsung's SG&A as a percent of sales. [For more detail on Samsung revenue composition see: The Cost of Selling Galaxies].

    Screen Shot 2013-04-02 at 4-2-3.09.39 PM

    Apple's SG&A has declined as a percent of sales, as one would expect, but Samsung's hasn't.

    I have hypothesized that the reason for this might be in the practice of "outsourcing" many marketing functions. As Samsung expands promotional efforts, it does so partially by hiring people but even more so by farming out a lot more work. In this way, if and when sales subside, it can pare costs. This practice ensures that it's not exposed to a huge cost structure that is hard to control. The downside to this approach might be obtaining "quality" marketing as oversight is still depending on inside teams who still have limited resources.

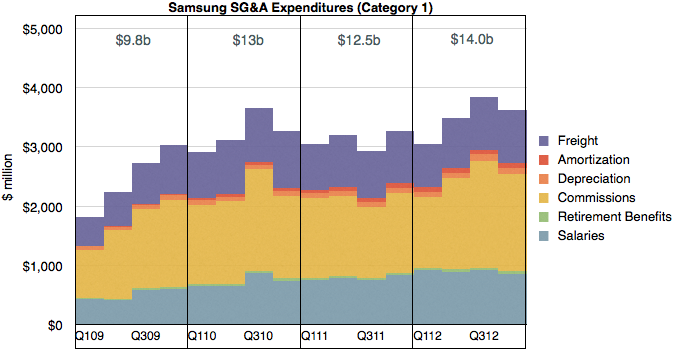
    To test this hypothesis, I looked at the types of costs it reports and divided them into two categories:

    Category 1 are what might be considered "internal" costs which are in function of employees or operations. These costs are:

    • Salaries
    • Retirement Benefits
    • Commissions
    • Depreciation
    • Amortization
    • Freight

    I graphed these costs over time below:

    Screen Shot 2013-04-02 at 4-2-3.12.09 PM

    Category 2 costs are those which can be "outsourced" and are in function of budget items. These are:

    • Advertising
    • Sales Promotion/Marketing
    • After Service Expense
    • Public Relations
    • Other

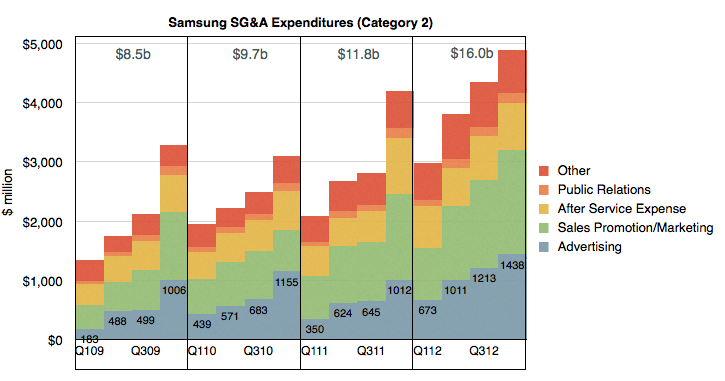
    I graphed Category 2 costs below:

    Screen Shot 2013-04-02 at 4-2-3.12.58 PM

    In both cases I created year-sized buckets summarizing these expenditure categories.

    It becomes apparent at first glance that through the period shown (2009 through 2012) Category 2 costs grew much more rapidly than Category 1. In 2009 Category 2 were less than 1 but the order was reversed in 2012. On a yearly basis Category 2 nearly doubled while Category 1 grew by about 40%.

    When seen in this context, the hypothesis is proven. The growth in Samsung SG&A has been driven by a vast expansion of primarily Advertising and Sales Promotions.

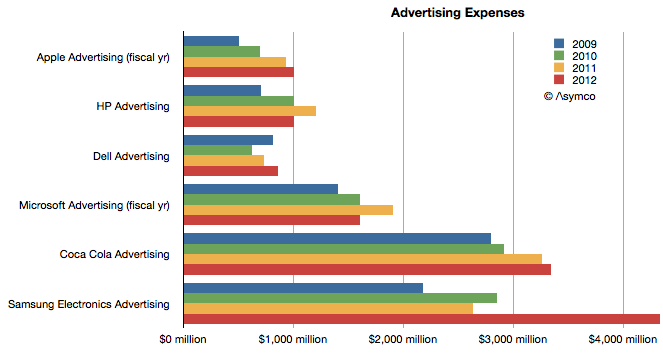
    It's hard to get an appreciation of the scale involved due to the lack of comparable SG&A category reporting from other companies.  What we do have however is that US companies typically report their advertising spending on a yearly basis.

    So taking only the Advertising figure from Samsung Electronics, we can get the following comparison with Apple, HP, Dell, Microsoft and Coca Cola.

    Screen Shot 2013-04-02 at 4-2-3.20.48 PM

    In this context we can see that while both Apple and Samsung grew their  advertising almost at the same rate, doubling their budgets during the last four years, Samsung Electronics has a far higher ad budget. More than four times higher, actually.

    Regarding Sales Promotions however, the comparison is far harder to make. I haven't any way to guess how much Apple spends relative to the $5.3 billion Samsung spent.


  3. How many iPhones will T-Mobile USA sell?

    Research · 54 comments

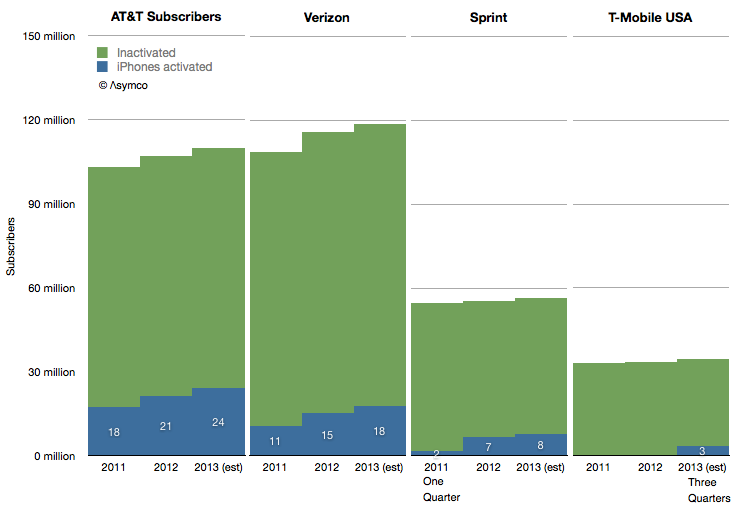
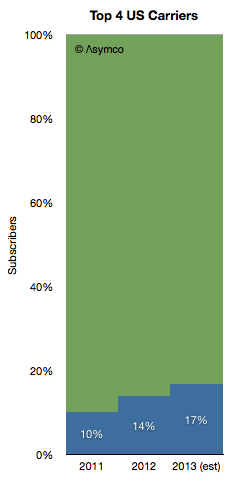
    From the initial product launch until the end of 2012, AT&T has activated 72 million iPhones. Verizon began selling iPhones four years after AT&T and managed to activate 26 million since. Sprint began nine months after Verizon and has activated 8.5 million.

    In proportion of their subscriber bases, the activations are shown in the following graph.

    Screen Shot 2013-03-28 at 3-28-12.50.06 PM


    I identified the reported iPhone activations with blue areas while the sum of green and blue areas represent total subs at the end a the given year.

    I also took the liberty of forecasting 2013 data in order to try to estimate T-Mobile's contribution.

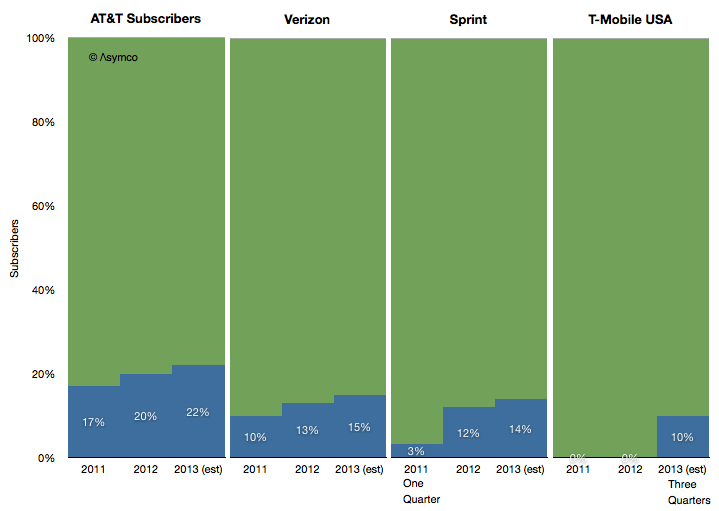
    The method used was to look at the percent of total subs that each operator has been activating. Accounting for the limited sales period for Sprint in 2011, the sales patterns are consistent across the carriers. The longer the product is available, the higher the activation rate.

    Screen Shot 2013-03-28 at 3-28-1.01.35 PM

    Therefore I estimated that in 2013 T-Mobile USA will sell about 10% of its subs base an iPhone. That would make its contribution to iPhone sales about 3.4 million.

    It would also imply US sales among the top operators of 53 million iPhones in 2013.

    That itself is 17% of 320 million subs.

    Screen Shot 2013-03-28 at 3-28-1.02.25 PM

    So perhaps it's time for Apple to celebrate. This year, after six years, Apple will have completed entry into its first major phone market. The rest of the world will not be as quick.

  4. Apple retail vs. Amazon retail

    Research · 55 comments

    As part of a continuing series on the iTunes economy I described how iTunes fits within Apple's overall revenue and cost structure. The operation is a modest contributor accounting for single-digits percent of revenue and operating margins.

    One additional question is how does iTunes compare with other non-Apple retail businesses. The obvious comparable businesses are Google Play and Amazon's digital content businesses. Unfortunately we can't compare iTunes with Google Play because Google does not reveal any details about Play revenues (or units sold/downloaded or payments to developers or any other data.)

    Also unfortunately, we can't compare iTunes with Amazon digital sales because Amazon does not provide that detail either.

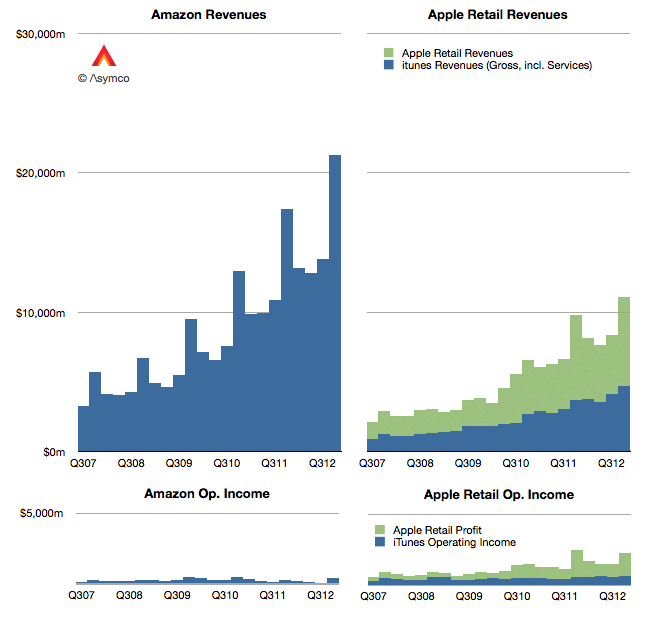
    What we do have is Amazon's overall revenues (and operating margin.) So that's what I have compared:

    Screen Shot 2013-03-27 at 3-27-2.09.30 PM

    Since we have Amazon's overall retail revenues it seemed fitting to also add Apple's physical store retail data on top of iTunes for additional perspective.

    Here are some observations:

    1. Since 2008, Amazon's sales grew by a factor of 2.18. Apple's combined iTunes+Retail grew by 2.14x.
    2. Apple's gross retail revenue was $11.1 billion in Q4, 52% of Amazon's overall revenues.
    3. Apple's operating income from retail in 2012 was $6.8 billion, over ten times Amazon's $676 million.

    Although Apple's overall retail operations are only about half of Amazon's they are far more profitable on an operating level. They are also growing at a similar pace. Amazon as an equity is priced at approximately twice sales. By that ratio, Apple's retail business would be worth $70 billion. Of course, that valuation presumes that, as with Amazon, operating profits are disposable.

  5. iTunes Segment Revenues in Context

    Research · 22 comments

    In the last few posts I estimated the iTunes economy in some detail. In absolute figures, the revenues and cost structures of iTunes are substantial:

    • 6.3 billion transactions in the last quarter
    • $4.6 billion consolidated revenues (including software & services)
    • $3.3 billion in content payments
    • $650 million in operating income

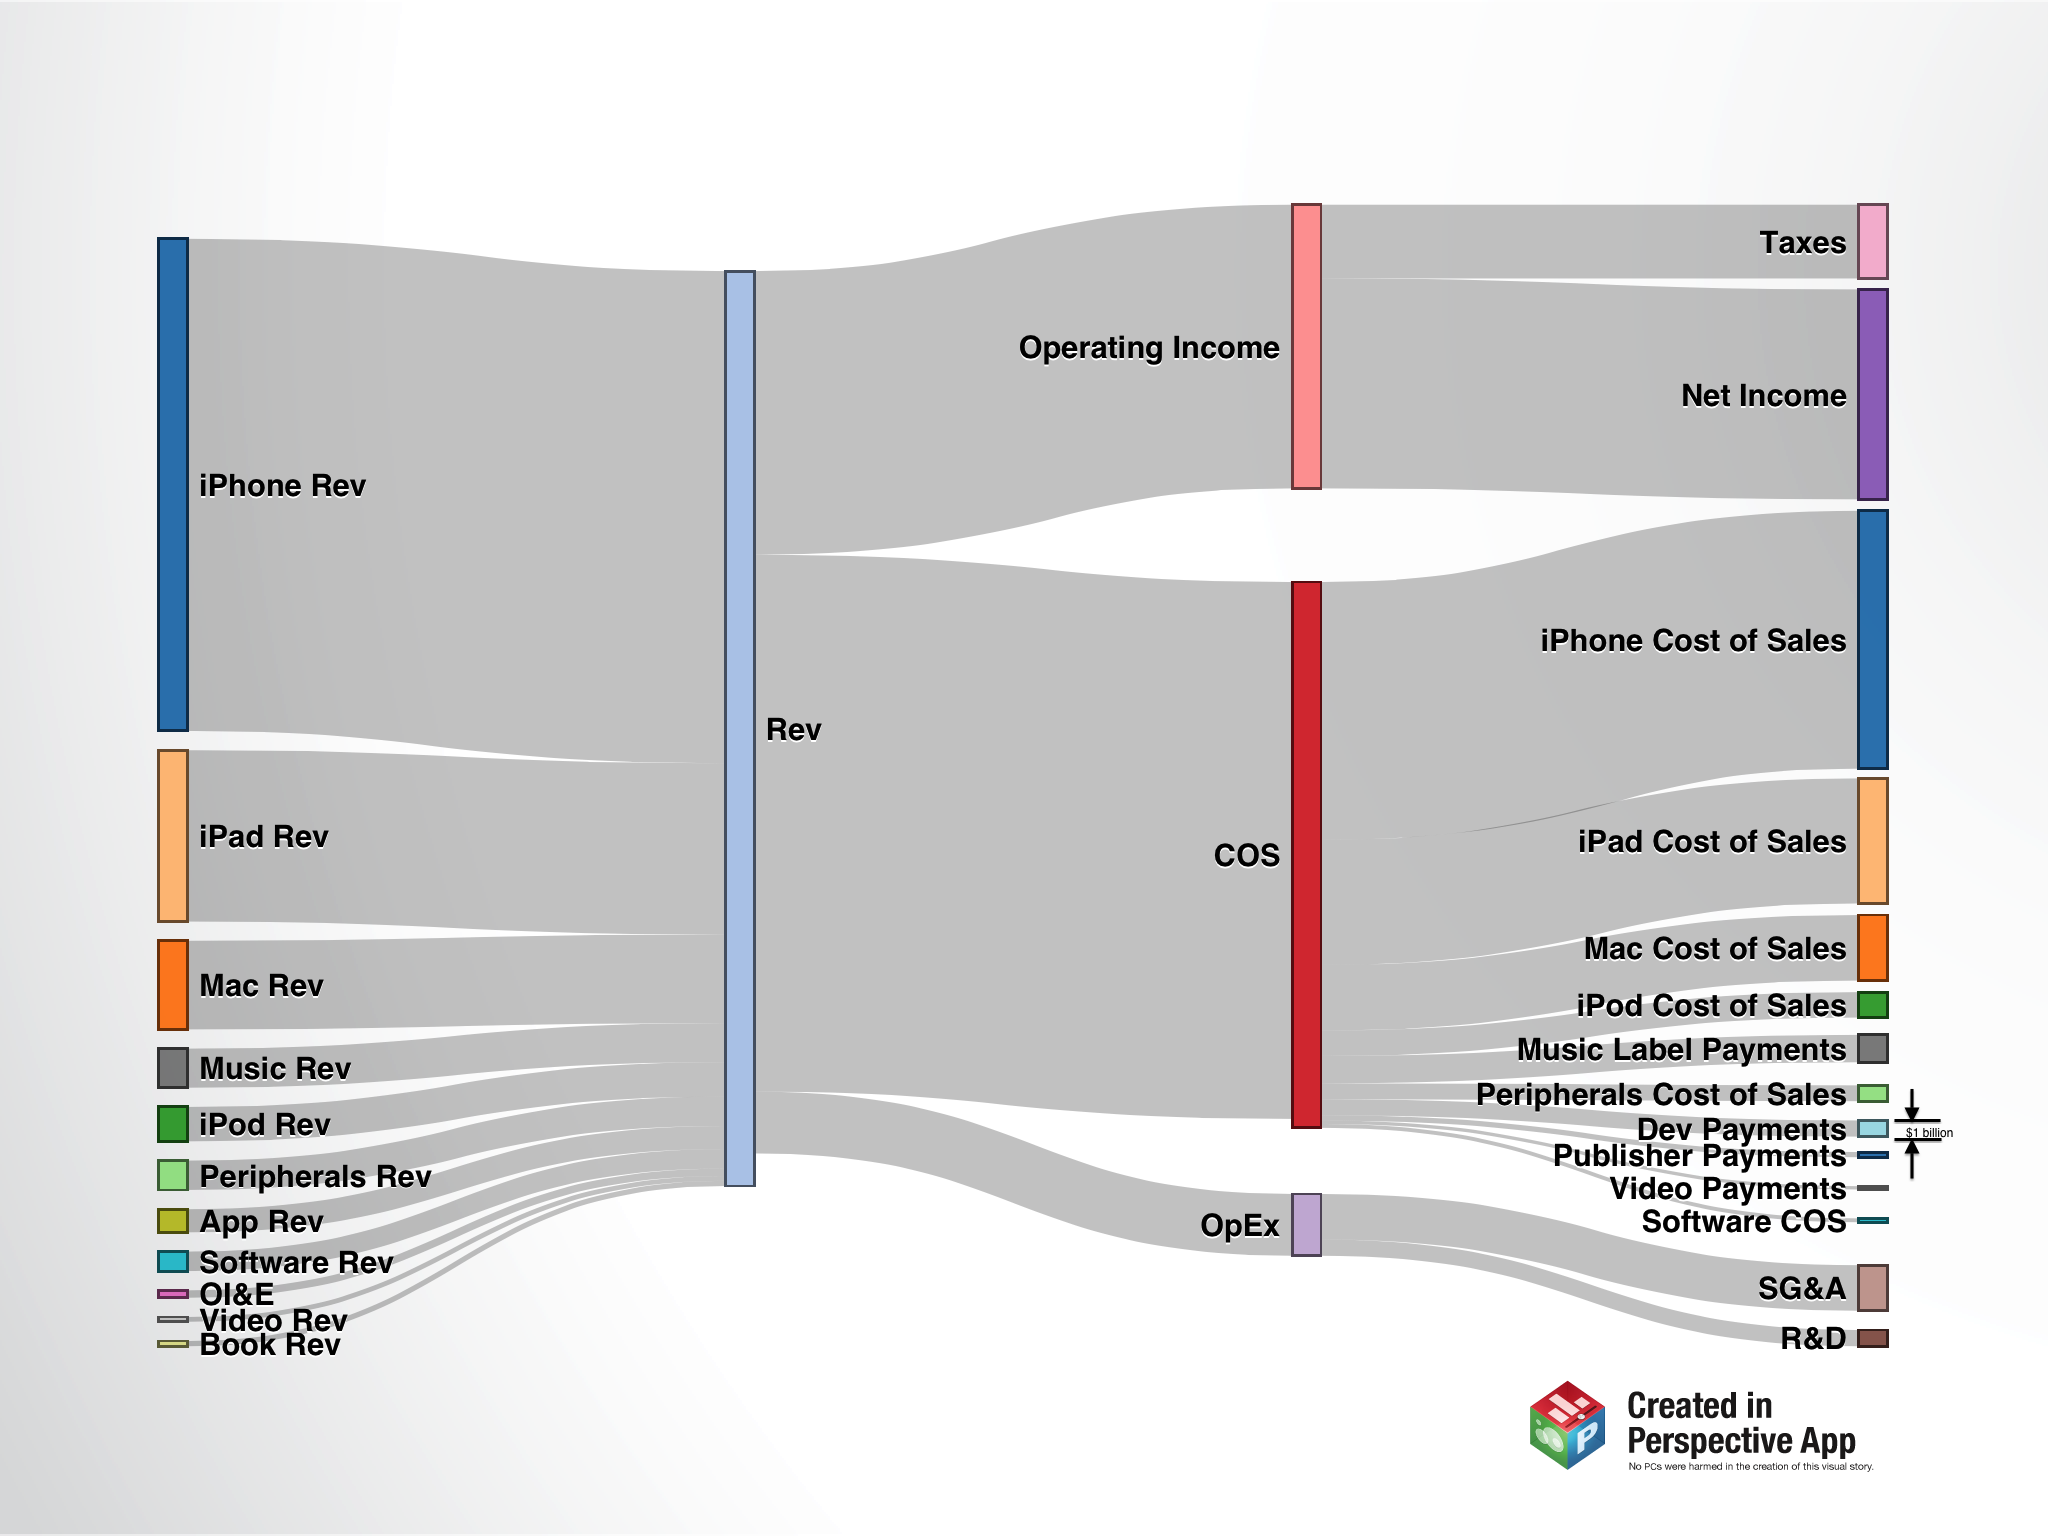
    However, as a part of the entire Apple revenue model, iTunes appears to be a small contributor. The following diagrams shows where revenues came from and where they were spent during the last quarter

    Sankey-Income1

    A few notes:

    1. Click on image to enlarge. The graph was produced using an iPad and it is rendered at iPad retina resolution.
    2. The data covers only the Fourth Calendar Quarter of 2012.
    3. For scale reference, "Dev Payments" equals $1 billion (as marked.)
    4. When zoomed in, each pixel represents about $50 million (vertical dimension).
    5. Revenues shown are "gross" and therefore greater than reported. See post on iTunes Revenue Recognition. �The same reason affects the total Cost of Sales (COS).
    6. Sources of revenue are ranked according to size. Note that Music is higher than iPod or Peripherals and Apps are higher than Software.
    7. Different Cost of Sales components are also ranked by value.
    8. iTunes which is the sum of Music, App, Software, Video and books makes up about 7% of overall revenues but 10% of costs of sales and hence contribute about 4% (est.) of total operating margin.

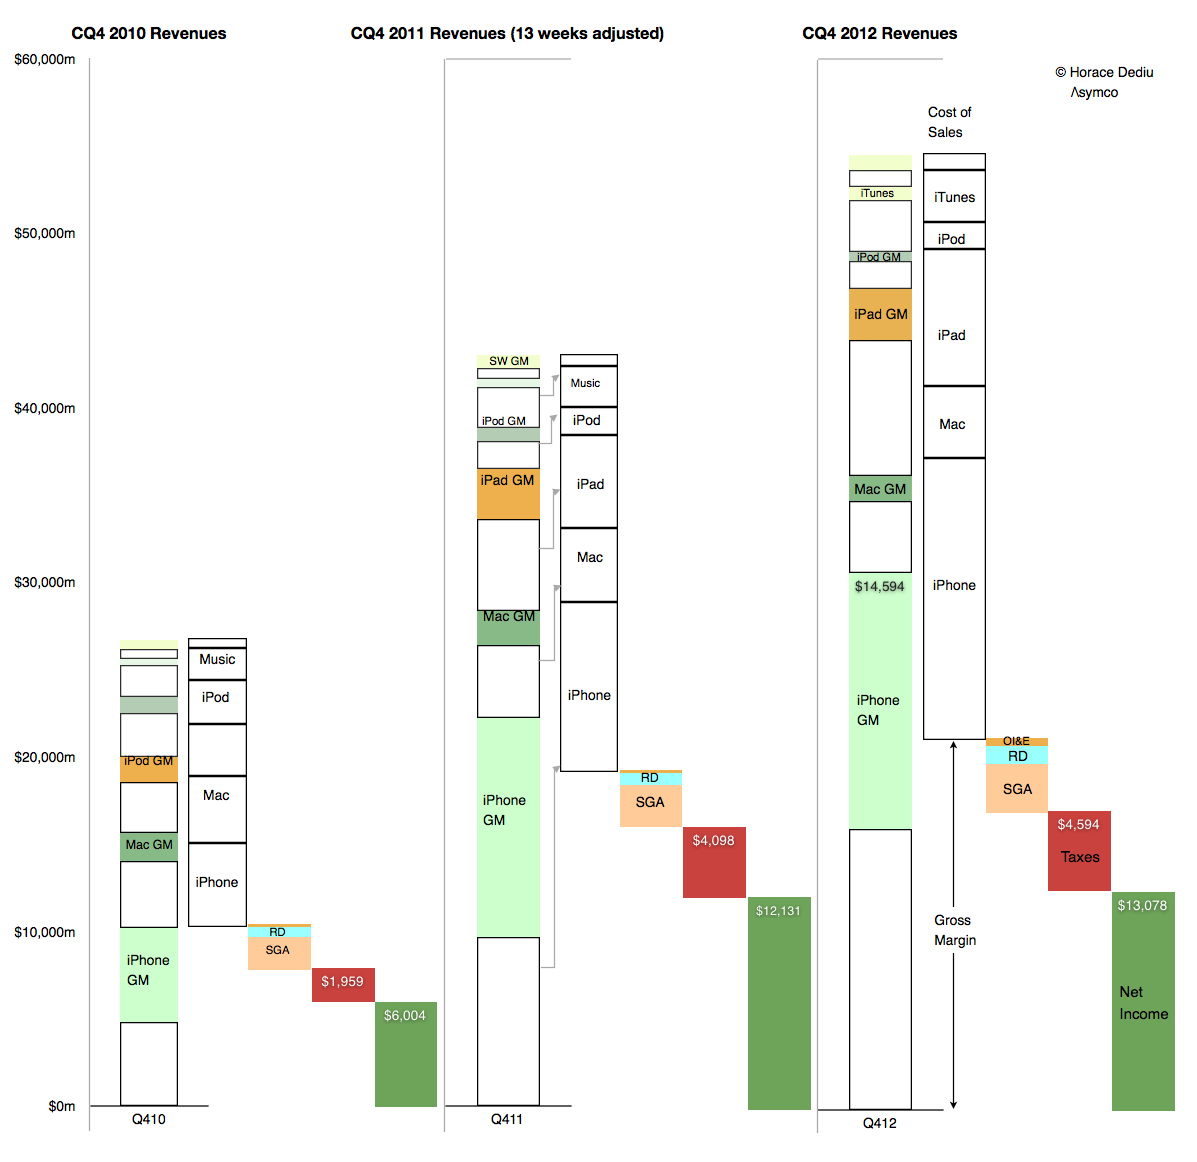
    A three year view of the same data is shown below:

    Screen Shot 2013-03-26 at 3-26-2.07.06 PM
  6. The Critical Path #77: Making Sausages

    Podcast · 1 comment

    The more we deconstruct and take apart iTunes, the more we come to respect how is cannot exist independent of the system it's a part of. Its scope and scale and its history and future all indicate that there is more to it than just a store and that it might be a platform in its own right. We get into some more details about all these details and talk about where it came from and where we think it will end up.

    via 5by5 | The Critical Path #77: Making Sausages.

  7. So long, break-even

    Research · 112 comments

    The following is another excerpt from a report titled "iTunes Business Review" which will soon be available for purchase through the Asymco Store. If you are interested in the product please get in touch.

    ---

    iTunes store will be 10 years old next month. From its inception Apple has stated that it aims to run the store "at break-even".  The business has grown so rapidly however that its profit-free nature has come under severe pressure.

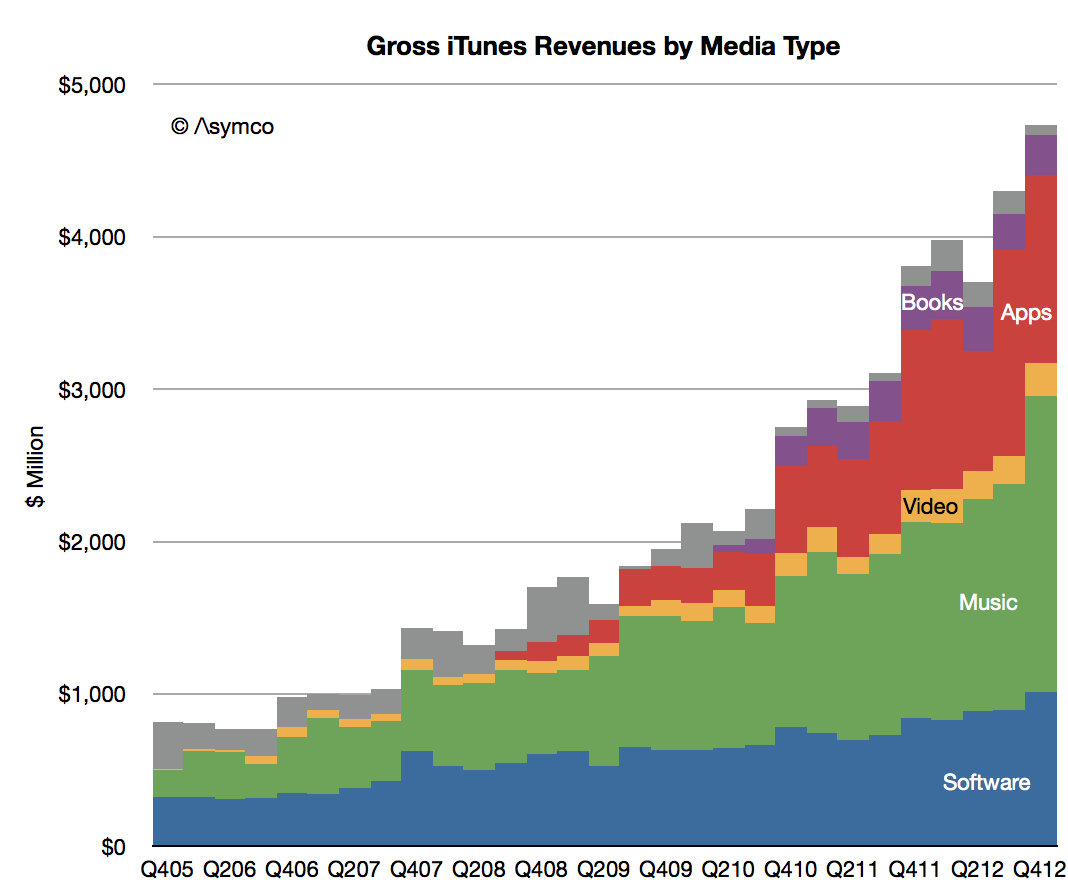
    The reasoning goes that as more media types have been added costs have increased but revenues have increased even faster. Consider the estimated gross revenue base as shown below:

    Screen Shot 2013-03-22 at 3-22-2.39.55 PM

    What is known as iTunes today has quintupled in seven years. Although cost of content sales are likely to have been preserved as a ratio (about 30%) the vastness of transaction volume (estimated at 23 billion item transactions in 2012 alone) implies that there are some significant economies of scale.

    This implies that the operating costs are spread more evenly and that therefore the possibility exists for some operating margin.

    Put another way, at break-even the cost of operating iTunes stores would be about $3.75 billion. It's hard to imagine this level of operational expense for digital content.

    For this reason, management has begun since 2010 to suggest that at least the App Store is run "a little over break-even". How little is a good question. A one percent operating margin (from gross revenues) would imply as much as $45 million margin. I estimate 2% is possible on Apps and 1% on Music.

    That's $150 million in margin content. Heady stuff.

    However, since folding its Software group into iTunes (the blue area in the graph above) the margin picture changes dramatically.

    The Software group is one of the forgotten heroes of Apple.

    Apple’s software division “Apple Software” is responsible for the following products:

    • iWork which includes Pages, Numbers and Keynote. These are available through the Mac App store at about $20 per product and the iOS App Store for $10.
    • iLife which includes iMovie, iTunes, iPhoto, GarageBand. The OS X versions are available free with new computers but they are also available as paid downloads for OS X through the Mac App Store at $15 each and for iOS devices through the App store at $4.99 per app.
    • OS products including downloads of iOS and OS X. These are mostly free but some OS X updates are not free (typically $19.99 for new version including the server version of OS X.)
    • Professional tools which include the following products: Final Cut Pro (Video editor $299.99), Logic Pro (Music editor $199.99), Aperture (Professional Photo workflow $79.99), Compressor (additional features for Final Cut Pro $49.99), Motion (video transition editing for Final Cut Pro $49.99)
    • Administration and development tools which include:  Xcode integrated development environment which is free Apple Remote Desktop which is priced at $79.99.

    All these products are now sold through either iTunes App Store or Mac App Store. They used to be sold as traditional boxed software for many years but Apple has transitioned them all to be download-only and folded them into the catalog of third party apps while lowering prices.

    My estimate is that Apple’s own software generated $3.6 billion in Revenues in 2012. As you can imagine, this is a high margin business  which grows at nearly 20%/yr. Although I estimate that the software business has been overtaken by the Apps and Music businesses in gross revenues, it keeps an operating margin similar to that of Microsoft or about 50%.

    This means that iTunes inclusive of Apple's own Software generates as much as 15% operating margin on gross revenues. That's over $2 billion a year.

    So much for breaking even.

  8. The Conundrum of iTunes' Recognition of Revenues

    Research · 10 comments

    An excerpt from a report titled "iTunes Business Review" which I'm currently writing:

    Revenue Recognition

    Before proceeding it’s also important to understand one more detail: The company does not report all transactions through iTunes as revenue. To quote the 2012 Annual Report (10 K):

    For third-party applications sold through the App Store and Mac App Store and certain digital content sold through the iTunes Store, the Company does not determine the selling price of the products and is not the primary obligor to the customer. Therefore, the Company accounts for such sales on a net basis by recognizing in net sales only the commission it retains from each sale. The portion of the gross amount billed to customers that is remitted by the Company to third-party app developers and certain digital content owners is not reflected in the Company’s Consolidated Statements of Operations.

    What this means is that App revenues are only reported at the 30% level that is retained by Apple. The 70% paid to developers is excluded from Apple’s financial reports. The same is true for other products for which it considers to be acting as an agent. The difference seems to be mostly in cases where Apple does not define the end user pricing. This is mostly true for ebooks however that may not be true for all book titles.

    This distinction between “gross” revenues and “reported” revenues is maintained in this report but both are presented for consideration. Gross revenues are needed for comparing the media businesses against each other and for competitive assessment but reported revenues are needed to test assumptions against ground truth.

    This can be explained with an example:

    If a song sells for 99c then Apple reports all 99c as Revenue and then pays the record company about 70c and uses 30c to operate the store and pay for transaction costs. In the case of music it means the Gross Revenue is 99c and the Reported Revenue is also 99c.

    However, if an app sells for 99c then Apple reports only about 30c as Revenue. It does not consider the portion paid to developers as revenues for itself. It spends a portion of the 30c to pay for transactions, hosting, and the time testing and accepting the apps. In the case of apps and books it means the Gross Revenue is 99c and the Reported Revenue is 30c.

    So if Apple sells one song and one app then the Consolidated Gross Revenue is 2 x 99c or $1.98 but the Consolidated Reported Revenue is only $1.29 (99c + 30c).

    The difference in accounting is sometimes called "agency" vs. "wholesale" and it applies in some retail businesses. Another term sometimes used for used goods is selling items "on consignment".

    The reasoning for why some media are treated one way or another is cited in the Annual report as "the Company does not determine the selling price of the products and is not the primary obligor to the customer". In the case of Apps, the price is set by the developer and the developer is obligated to deliver on the promise. Apple acts as transaction processor and they don't consider that they ever owned (and hence never sold) the app. Note that this accounting is probably discretionary. They decided to do it this way and it's not clear that it was necessary to do it this way by any regulation.

    This distinction between two treatments of revenue makes it difficult to understand the complete story behind iTunes.

    --

    If you're interested in the full report, contact me directly.

    UPDATE:

    Apple’s rationale can be partly justified from a reading of a Financial Accounting Standards Board statement titled “Reporting Revenue Gross as a Principal versus Net as an Agent” (Emerging Issues Task Force Abstract EITF 99-19 http://www.fasb.org/pdf/abs99-19.pdf) a portion of which is quoted below.

    “Indicators of Net Revenue Reporting

    15. The supplier (not the company) is the primary obligor in the arrangement— Whether a supplier or a company is responsible for providing the product or service desired by a customer is a strong indicator of the company's role in the transaction. If a supplier (and not the company) is responsible for fulfillment, including the acceptability of the product(s) or service(s) ordered or purchased by a customer, that fact may indicate that the company does not have risks and rewards as principal in the transaction and that it should record revenue net based on the amount retained (that is, the amount billed to the customer less the amount paid to a supplier). Representations (written or otherwise) made by a company during marketing and the terms of the sales contract generally will provide evidence as to a customer's understanding of whether the company or the supplier is responsible for fulfilling the ordered product or service.