2013 will see two billion phones shipped to over 4 billion consumers. Contrary to the common assumption that larger markets sustain more competitors, this rapidly growing market is profitable for only two device vendors. Horace Dediu seeks answers to this paradox at the Harvard Business School Technology and Operations Management Digital Seminar Series. Self-recorded live on March 7, 2013, 45mins, 22.5Mb.
This interview took place on the eve of the launch of the Galaxy S4. Anouch Seydtaghia is Deputy Head of the Economic & Finance Section chez Le Temps Geneva, Switzerland.
---
Q: How can you explain that Samsung organizes such a huge event in NY for the S4?
A: The S4 is a very important product as it's probably the second most profitable mobile phone in the world. Samsung is trying to position it as a premium product and is using every means available to do so.
What are your thoughts about the huge marketing budget of Samsung?
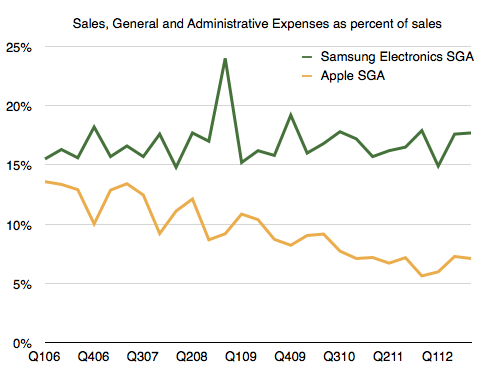
Samsung's marketing budget has been a constant percent of their sales (approximately). As sales have risen, the budget has risen. This is not considered a normal situation if sales grow very rapidly but Samsung seems to consider x% of sales to be appropriate spending level. Note that Apple's marketing has fallen as a percent of sales while its sales have grown dramatically.
If we read the media, we see a lot of speculation about the features of the future S4. Can we now compare that to the expectations before a new iPhone?
There are speculations about all phones, from Nokia to HTC and BlackBerry. I don't see the speculation to be different between all the major companies.
Can Apple regain the lead in the smartphone market? If yes, how?
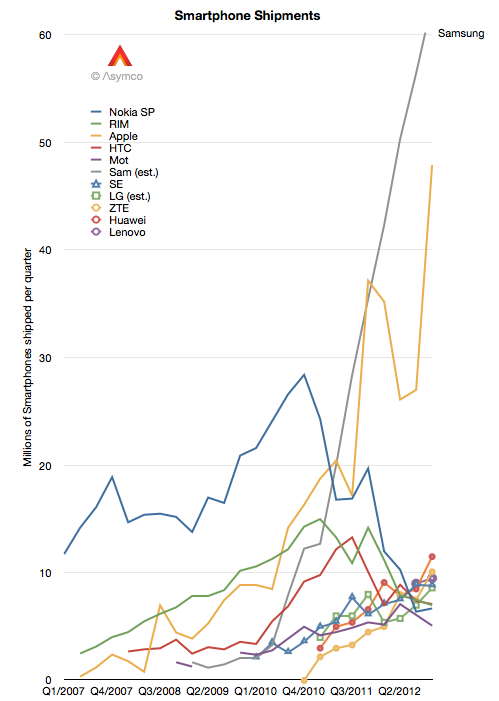
Apple had leadership in the phone market for two quarters (see graphic below.)
It's a myth to think that Apple was dominant for any extended period of time. The top spot is very difficult to obtain unless a company has a large portfolio of products which are sold in all markets. Apple has less than half the operator distribution of Samsung and keeps only one new product in the market each year.
Apple also has a very high price due to the distribution model it uses for the iPhone. The primary buyers are operators who made large volume purchase commitments a few years ago. The iPhone strategy can be summarized as "skimming" where they pick the most profitable customers rather than "penetration" where there is a focus on market share. It's therefore very surprising that Apple was able to ship as many phones as it did.
Is there a difference between what Samsung and Apple invest in R&D?
Of course, but we don't have details. Samsung Electronics has to develop semiconductor processes and build large fabrication plants. Apple has a vast software engineering operation. Apple has iTunes and web services while Samsung has appliances and TVs. The two R&D efforts are vastly different.
What could be the new features in the next smartphone?
The most important innovation in smartphones will be a product that is not a smartphone. The category will be eliminated through a disruptive approach just like all other technologies that have come before it. My expectation is that when it comes it won't be recognized as important or relevant.
As a follow-up:
- Thank you very much! So do you mean that for Apple, marketing is just 1% of sales?
It's difficult to compare the two exactly.
We don't have specific data on Apple's marketing. We have either Advertising or SG&A (which includes marketing.) Samsung reports “Marketing Expenses” every quarter but these figures appear to be the sum of Ad spending, Sales Promotions, Public Relations and a portion of “other” expenses as a part of SG&A.
What seems to be happening is that Samsung increases its spending in proportion to sales while Apple grows marketing a bit more slowly.
Basically, Samsung is treating SG&A as a "variable" expense which is tied to sales whereas Apple is managing it as organic growth.
The difference might be that Marketing at Apple is mostly an internal effort and thus depending on headcount while Samsung might be spending mostly externally. If costs are internal then it would be hard to pare them down if sales slow whereas if they are external then they can easily be made variable.
I've received comments suggesting that Samsung's approach is unorthodox and that the quality of marketing cannot be maintained if it grows as quickly as Samsung has grown it. This is a matter of speculation however.
Two days after I posted a reminder that Google had not updated their Android activations for five months, Google updated their Android activations.
The new total is 750 million. My expectation (based on a rate of activation acceleration of 30,000 activations/day/week) was 800 million. Google did not update their download rate but it can be derived. Between September and March the average has been about 1.4 million/day. I had previously estimated that the rate of activation was 2 million/day.
This is a modest increase from the 1.3 million/day that was reported in September implying that activation acceleration has slowed.
After resetting the acceleration to 5,000 activations/day/week my new forecast for 1 billion activations moves to the end of August.
Coincident with this update on activations, Google reported that Andy Rubin has stepped aside as the head of Android and that Android and Chrome would be under the same management.
Putting aside the exit of the founder, the implications of the merger with Chrome will need significant contemplation.
Google occasionally reports data regarding Android. Very occasionally. The last time we had some data was in September 2012 when we learned that activations were running at 1.3 million per day and that a total of 500 million total activations had taken place.
As of today, being March 2013, the time between updates has reached five months. It's the longest gap so far. Benedict Evans also notes that it's been five months since the data regarding screen size stats has been updated on the Android developer site.
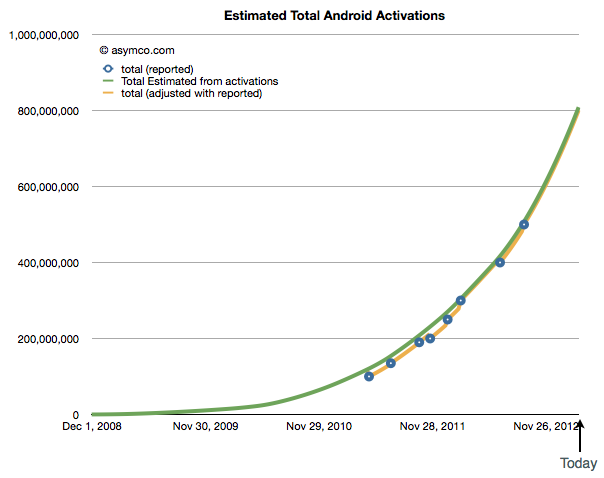
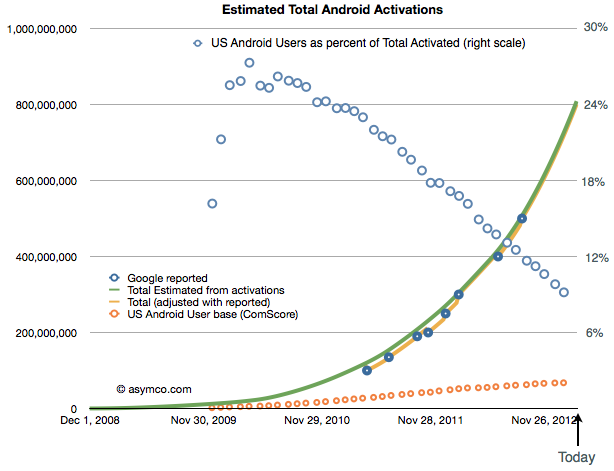
But we have to live with what we get and, in the absence of an update, the pattern of growth in Android, if sustained, looks like this:
It implies that 800 million Android activations have taken place to date and the rate is about 2 million per day. One billion activations could thus happen by June.
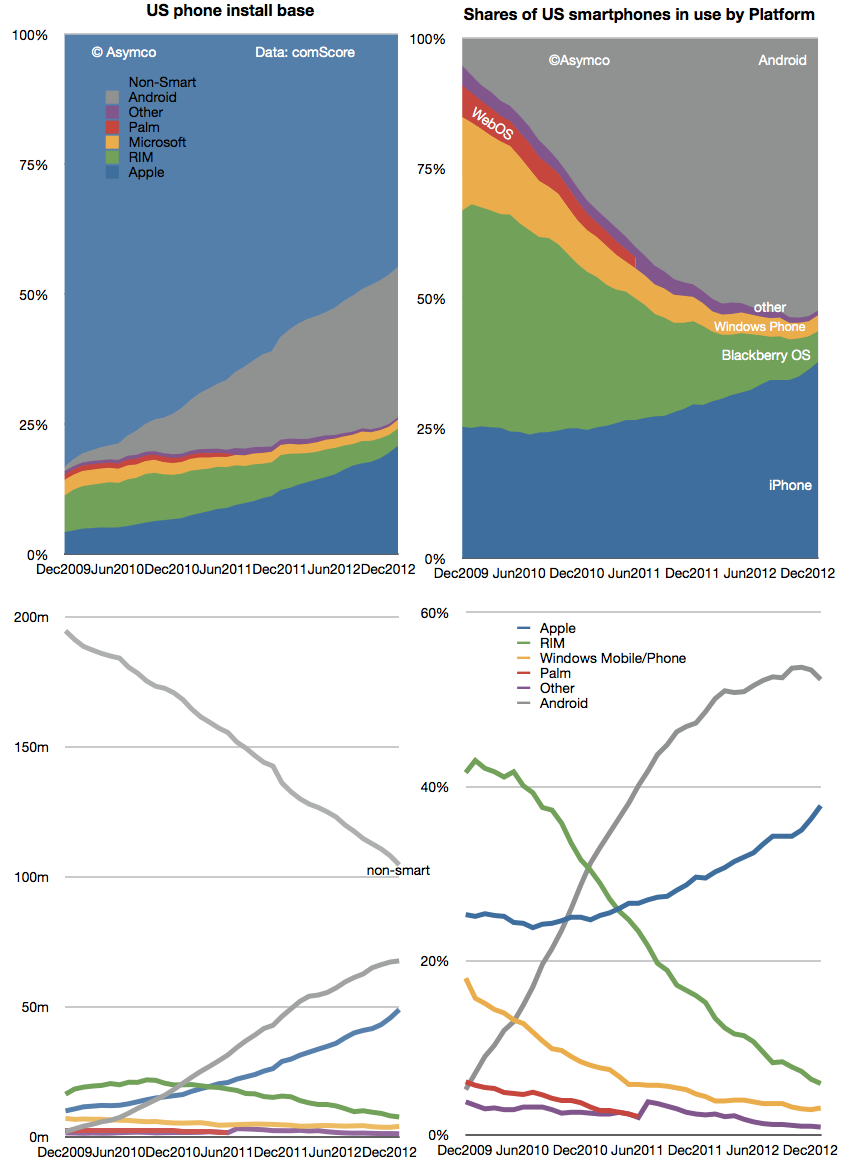
There is however another set of data regarding Android which is updated more frequently. The comScore mobiLens survey covers the US and provides updates on a monthly basis. That data shows that Android users in the US reached about 68 million as of the end of January. See the updated data below:
I included the install base and share of total users as reported. Combining the comScore data with Google's activations gives the following picture of US as a percent of global Android (orange circles represent US base and blue circles the precent of total activations that the US might represent)[1].
The data implies about 9% of Android usage is in the US. The more startling thing is the difference in growth: it implies that with a US growth rate of only about 13.3k/day, global growth is 150 times faster than US growth. In other words, that 0.6% of new users are in the US and that 99.4% of Android growth is outside the US.
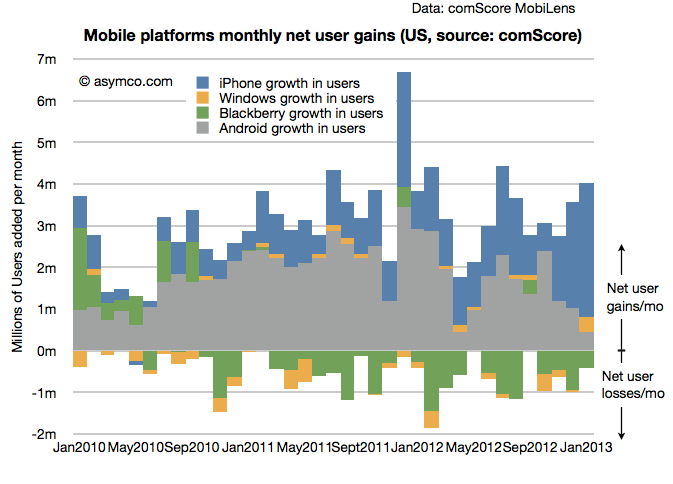
That's an interesting story. But it's even more interesting that this is not the case with the iPhone. The iPhone is growing considerably faster in the US than Android. One can see this more easily with a graph of the US mobile platform net user gain rate as shown below:
Looking at the the same contrast between global and US, from Apple's financial reports, in the fourth quarter the global "activation rate" (i.e. sales rate) for iPhone was 525k/day (nearly one quarter of the extrapolated Android rate). The comScore data suggests the US gains are running at 106k/day. Therefore we can calculate that about 20% of iPhone growth is in the US and 80% is outside the US.
Even accounting for some potential error in the Android estimates, the contrast is quite stunning: 1% vs. 20% share of growth suggests something is very different about the US with respect to the two platforms.
My suspicion is that it has something to do with the fact that the US is one of the few (but largest) market where the iPhone is available as a "low end" offering. At a minimum price of $0 (with a contract) many consumers are finding the iPhone attractive relative to a $0 (with a contract) Android phone. This price parity (illusory as it may be) allows iPhone to grow even faster than Android in this particular market.
One wonders what would happen if such price parity were present globally.
---
Notes:
Android activation data as reported by Google includes tablets but excludes many unofficial Android builds e.g. Amazon Kindle and many Chinese phones and tablets that don't register with Google services. comScore data includes only primary devices used by consumers and excludes corporate purchases and devices whose primary users are younger than 13 years.
When: It's taking place at 3:00 PM on Thursday March 7th.
Who can attend: The talk is open to the public, seating is limited.
Location: The Cotting House on the campus of the Harvard Business School (map linked), Boston. There is parking in the main lot with entrance across from the Harvard Stadium for $14/day.
New data allows us to estimate the components of iTunes with more precision. The entire business is now transacting over $17 billion a year. We take a look at how this insight can be gained and what it means for the future of commercial media.
In June of 2011 Apple announced that 130 million ebooks were sold through iTunes. In October of 2012 it announced that 400 million sold.
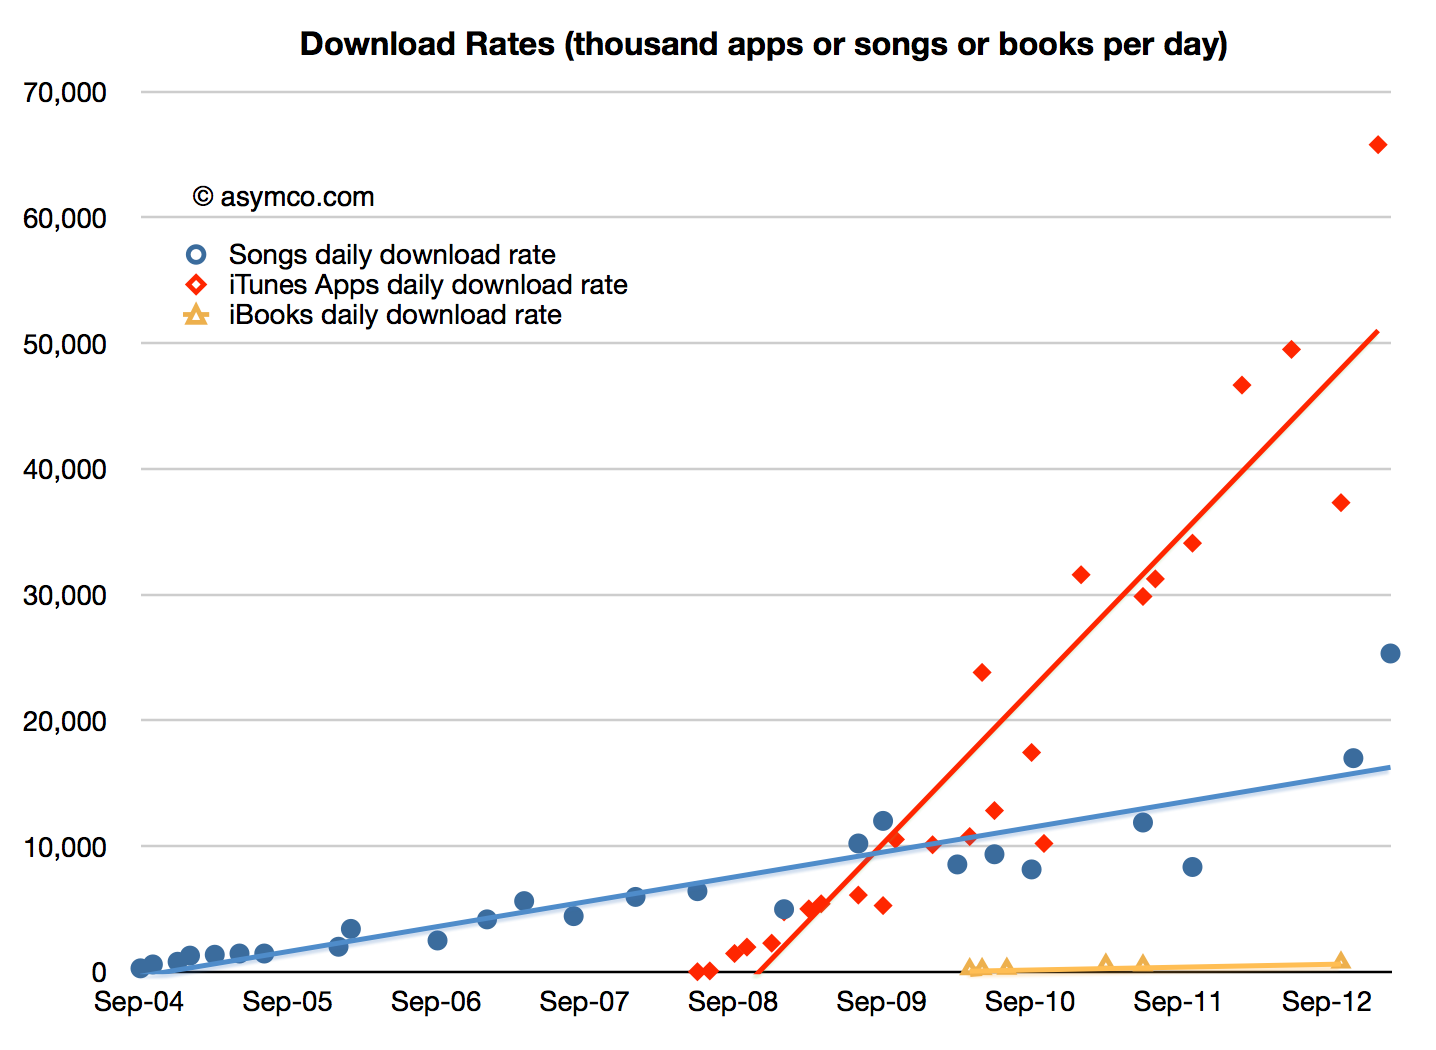
That means 270 million ebooks were sold in 16 months. Or about 17 million units per month, on average. It also suggests 2012 ebook sales of about 200 million units.[1] The following graph shows the download rate of books relative to apps and songs:
The download rate looks paltry but we need to remember that Apps have a very low average selling price (about 23 cents including in-app purchases) and that Songs are probably priced around $1.1 on average. In contrast each ebook could be generating about $10 per download.
However that may be a bit high. We don't know the mix of lower priced and higher priced books. Many best sellers are $13 or $14 but there might be some free books in the mix as well.
If I choose a more conservative $9 average selling price and assuming a 70% share for the publisher then Apple's iBooks generated about $1.3 billion in payments and grossed about $1.8 billion.
In the past few posts I measured the iTunes App ecosystem and the Music economy. With the iBook market now measured we can derive the size of the only remaining media type: video.
---
Notes:
I've seen one estimate that world-wide ebook unit sales reached 860 million implying Apple's share was about 24%.
LG Electronics has acquired HP's WebOS for an undisclosed amount. When last it changed hands WebOS was part of Palm which was purchased for $1.2 billion in 2010.
Palm has thus been effectively divided into several smaller pieces distributed as follows:
HP will own:
Support of existing Palm users
Palm back-end assets including source code, infrastructure and talent
webOS patents
LG will own:
Stewardship of the Open WebOS and Enyo open-source projects where the source code resides
Associated talent
WebOS websites
License for IP related to webOS
LG announced that it plans to offer an "intuitive user experience an Internet services across a range of consumer electronics devices." In an interview, the CTO of LG said that given the current situation with Android, LG does not plan on making smartphones running webOS but will use it in televisions and other devices such as cars, signage and appliances where there are no embedded OS's. "We'd like to secure a software platform across all devices."
Most commentary regarding the deal focused on the use of the platform for TVs but management seems to consider all devices, perhaps even phones, at some future date, to be webOS targets.
The TV however seems to be low hanging fruit today. The TV as an app platform will be the new ecosystem war and no platform today has a lock on the developers or users. The way this rivalry will shape up will not mirror other device classes for the same reason that current device classes are platform silos.
PCs, music players, tablets and phones all have different super-majority platform leaders. The association of a platform with a device class depends first on the distribution model, which favors a specific business model which favors a specific vendor which favors a specific platform. As each device is distributed differently, a different platform takes precedence.
Consider that the PC has historically been purchased by IT departments which led to a monoculture of Windows which led to a persistent leadership for Microsoft.
The music player created dominance around iTunes mostly because the distribution model for music labels was baked-in. With network effects, the iPod quickly gained and perpetually retained market share leadership.
The smartphone business initially favored Symbian and BlackBerry because they had the market access through operators. After the touch UI became dominant (and incumbents failed to respond in a timely manner), Apple and Google took leadership as soon as they accepted the operator distribution model. Android in particular is especially resonant with operators and has been developed with their requirements in mind.
The tablet business is more like the PC business but without enterprise requirements or patterns of purchase. This has meant that app/content ecosystems and retail distribution were the key gating factors. The story is still unfolding but so far Microsoft has not found a foothold while iOS and Android and Amazon have.
That leads to the question of how will smart TVs be sold and which business model (or go-to-market strategy) will succeed. Steve Jobs pointed out the difficulty in trying to deliver innovation into a value chain dominated by cable companies which can effectively block it. A TV which is an application execution device rather than a content terminal will require a re-definition of the category. That will require a re-positioining of this product. Few companies are able to do that. [See also my post Tele Vision from mid-2011].
Which brings us back to the question of webOS. As long as LG sells TVs as content terminals they might not obtain much value from webOS. If, on the other hand, LG were to use webOS to re-define their televisions to be something else entirely, namely software execution devices, sold differently and hired to do a different job than a TV, then webOS becomes not only necessary but potentially a source of great prosperity.
The International Federation of the Phonographic Industry (IFPI) reported that global digital revenues were $5.6 billion in 2012. This represented about 9% growth from 2011 and accounted for 34% of total industry revenues[1].
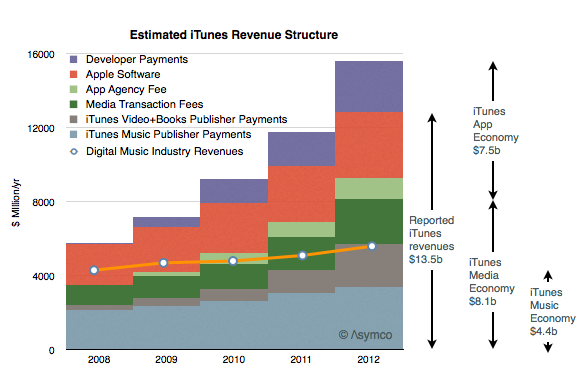
Apple regularly reports iTunes as a separate revenue item and occasionally it also reports payments data for developers and app download rates. By interpolating the data published and combining it with some assumptions it's possible to estimate the mix of revenues (and costs) associated with iTunes.
My yearly estimates are summarized below.
Note that I also included historic digital music industry revenues (as a line). I also included the following summary items:
iTunes reported revenues were $13.5 billion (including Apple's own software sales)
iTunes gross revenues were about $15.6 billion (including payments to developers)
The iOS and OSX "App Economy" was about $7.5 billion while the iTunes "Media Economy" was about $8.1 billion (both figures include transaction costs.)
The iTunes Music economy was $4.3 billion of which $3.4b was paid to music labels.[2]
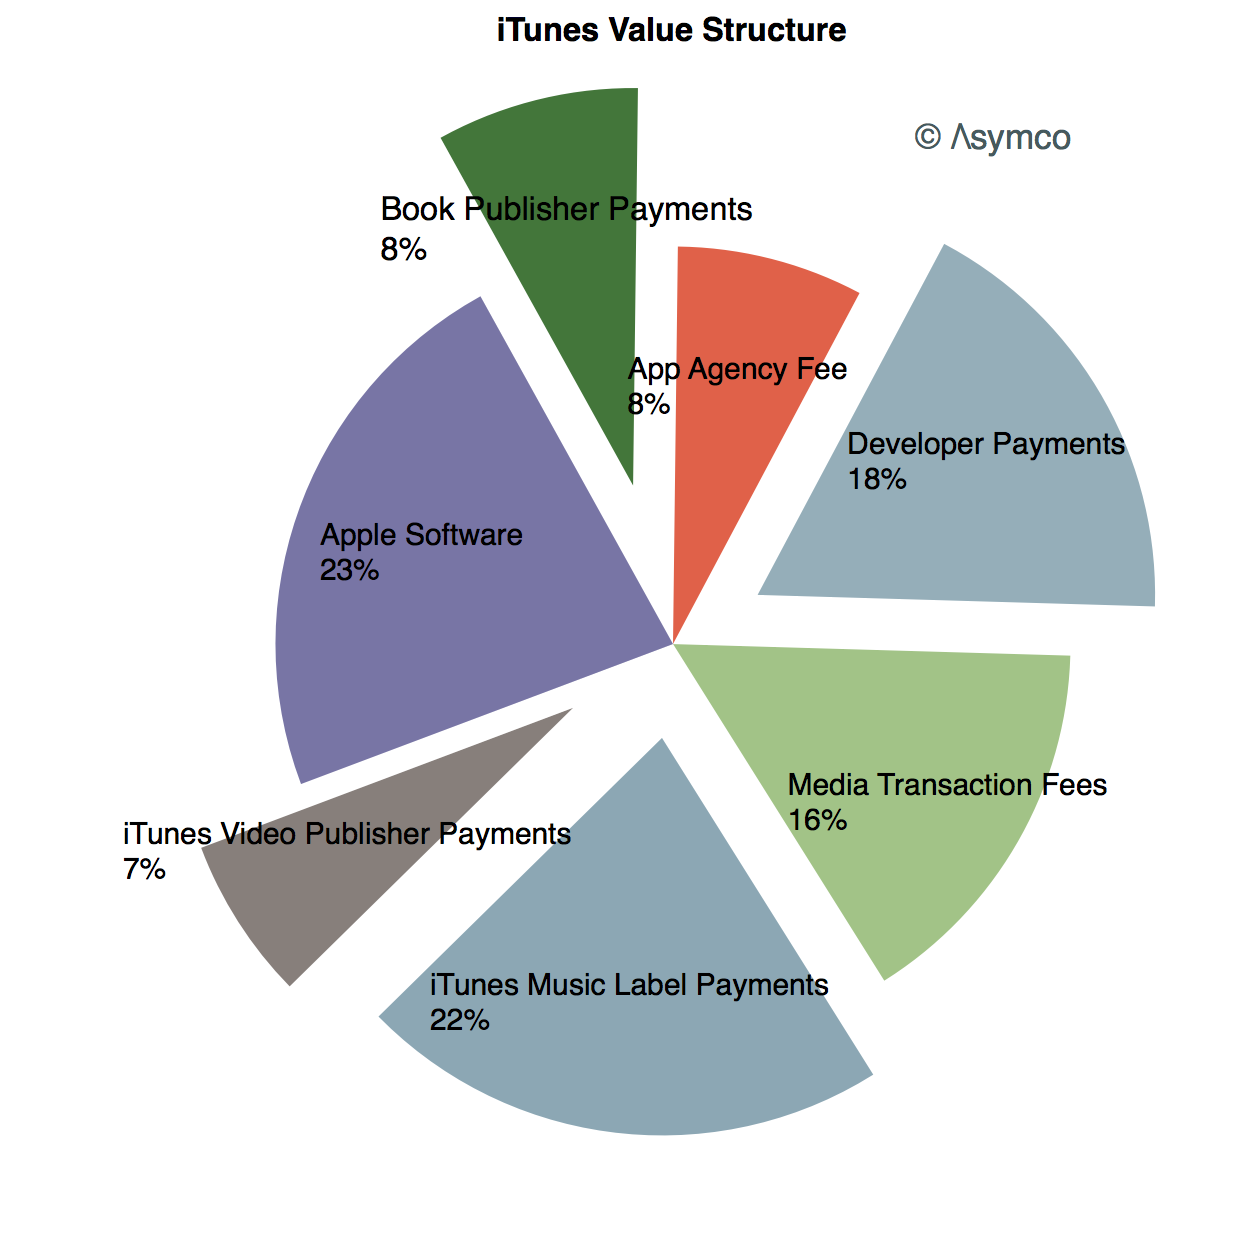
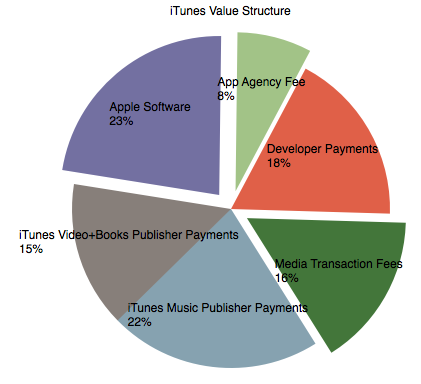
In terms of percent of total value the components are:
Looking at growth, these estimates imply that App revenues are growing at about 50% while iTunes Music is at 10% and Video+other at 90%.
Looking at profitability, there is potential for operating margin in Apple Software and App Agency Fees and perhaps some of the Media Transaction Fees (exploded wedges above). Historically, Apple suggested that their App and Media stores ran at break-even but that may no longer be the case. Operating margins from Software may be significant.
---
Notes:
These revenues were from recorded music and don't include live performance
My estimate for the iTunes Music payments to publishers is equivalent to about 60% of total industry revenues.
Why do some companies seem to be able to build products that fit their customers' needs exactly while some do not? How to build a company that builds the right thing?