Foreshadowing iPhone sales
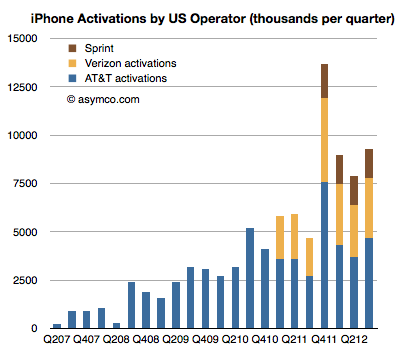
AT&T, Verizon and Sprint have all reported the number of iPhone units shipped in Q3 2012. The history of the these sales is shown in the following graph:
Read more:

AT&T, Verizon and Sprint have all reported the number of iPhone units shipped in Q3 2012. The history of the these sales is shown in the following graph:
Read more:
Research #Market · 56 comments
Having reached 100 million iPads shipped in 2.5 years the natural question is how long will it take for the next 100 million iPads?
The ramp of cumulative units shipped is shown below.
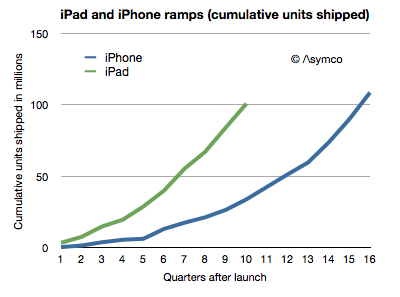
I also added the equivalent ramp for the iPhone. [The last data point for the iPad is based on an estimate of 16.5 million units in Q3 which may need revision depending on company reporting.]
The next 100 million will depend to a large degree on the success of the new iPad mini. To make an estimate we have to realize that there are several aspects of the tablet market which differ from the phone market and that therefore the predictive power for previous data is weak.
First, the channels are different. Tablets are sold as media consumption or "computing" products. They are not sold as communication devices. Therefore operators have few incentives to promote and subsidize them. They do participate in the distribution but not with the same level of commitment. That means less "push" and opportunity for discovery. Apple has an advantage in this case with their stores and brand value. The lack of operator engagement and lack of points of sale might be one reason why Android tablets have not ramped as quickly.
Second, for some competitors, the tablet itself is a loss leader and acts more as a terminal into an ecosystem rather than a product in itself. In cases where tablets are given away it's possible that consumers might own one for each platform or ecosystem. This is similar to the game console model where the cost of the console is not a barrier to many avid gamers. This means that penetration of tablets can reach above 100% of users in some markets. Although network connections (i.e. SIM cards) can and do reach well above 100%, the number of phones in use by one person simultaneously is bounded.
Third, the lifetime of the product is as yet undetermined. Phones tend to last 2 years. This is due to evolving standards as well as high wear and tear and breakage or losses. Tablets are not as "mobile" and are less likely to be used and the basic functionality does not evolve as rapidly. It's possible that replacement rates for tablets will follow more that of notebook computers than phones. Perhaps between 2 and 4 years. I suspect most iPads purchased are still in use today, including the first version. There will be some obsolescence from system upgrades, but the older systems will keep going.
Some of these aspects of the product could lead to slower growth and some to faster growth. That and the fact that it's a completely new category with business and consumer and educational and vertical applications makes it a difficult product to forecast.
Having said that, the product is extremely resonant with buyers. The growth to 100 million is testament to that. The liquidity of the product, with no carrier locking and no pricing illusions means that it reaches all parts of the world quickly. So there is no obvious upper bound on the size of population who might buy it. The new price points and form factor may lead to a wave of new adoption, similar to the impact the iPod mini had on the iPod line.
There are still many factors that can slow growth, especially production capacity, but I believe that the iPad could growth between 50% and 80% which would mean 100 million more iPads could be sold by the end of 2013.
Research #Industry #Market #Nostalgia · 47 comments
Days after Nokia announced the end of life for the Symbian platform I wrote a post titled Who will buy the next 150 million Symbian smartphones? The reference was to claim by management that before there would be a complete transition to Windows Phone, 150 million legacy Symbian phones would be sold, keeping the company financially stable before the new ecosystem took root.
I reproduce the original forecast I made below with the addition of what actually happened.
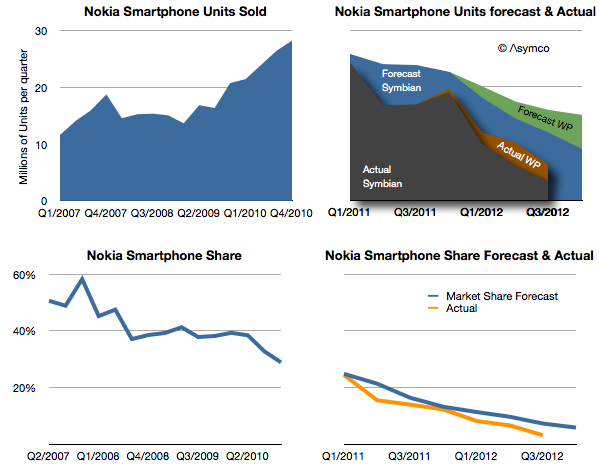
[Note that the Actual stack area chart is independent of the forecast area chart as indicated by shading.]
My forecast in early 2011 was based on the 150 million Symbian phones being sold over a two year transition period. The implication with the forecast for Windows Phone was that this would still lead to a difficult contraction of volumes.
As it turns out, only 96 million Symbian devices have been sold in the 7 quarters since the platform was deprecated. It's unlikely that there will be ever by 150 million units sold as last quarter only 3.4 million shipped. In any case, management has already retracted that claim.
What about the Windows Phone forecast? It turns out that by this point in time (Q3 2012) I had expected Lumia shipments to total 9 million. Actual shipments reached about 9.5 million, so not bad. However, the market grew faster than I had expected and overall Nokia smartphone market share turned out to be slightly lower (6.3% in Q2 vs. 10% estimated.)
The just ended quarter shares are not yet available but it's quite possible that overall Nokia smartphones could be well below 5%, and may slip to 3% during the transition period.
My warning in February 2012 was that 150 million Symbian units would not ship since I expected there would be a stigma associated with the products among distributors, even if consumers were fine with them (which they weren't).
The public execution of Symbian (and any other alternative being developed inside Nokia) will probably be a classic case study in disruption management. To wit: even if a platform needs to be led out to pasture, there are ways of managing decline other than suicide. Nokia's failure is not so much having chosen the wrong alternative to Symbian, but having chosen exclusively.
However, there's a twist. The company did not accept exclusivity of one supplier without a concession: In exchange for exclusivity, Nokia negotiated $250 million every quarter in the form of "platform support payments" from Microsoft. Nokia has to date received over $1 billion in such payments. (For the last quarter that amounts to $86 for each Lumia phone shipped.)
The tragedy comes from this $1 billion/yr not being enough. The foregone revenues from Symbian (assuming they had been able to maintain the decline to the level of 150 million units that they had originally forecast) would be about $9 billion. This means that had Nokia not knifed Symbian and had sold the shortfall units at an average price of $200 they would have received an additional $9 billion in sales. Furthermore, assuming a margin of 33% for those units, Nokia received from Microsoft one third from of what she gave up for exclusivity.
In other words, the net cost of the Microsoft exclusive relationship is at least $2 billion in operating profit.
This turns out to be the difference between being profitable and being distressed.
We will never know if this scenario would have ever happened, but the forecast management made 21 months ago suggests that at least they thought this was what they were going to get out of the bargain.
This reminds me of another article posted around the same time.
Research #padcast · 47 comments
My talk at the Arctic 15 conference October 18th in which I review the data on App Store performance and question the viability of intermediaries in content distribution.
Reflects and complements my recent Omnivorous App post.
Requires the (free) Perpective™ app and an iPad.
Research #Industry · 29 comments
Last July I asked the question "How many Lumia phones were shipped in the US?"
My answer was 630k through the first half of this year.
I revisit this question following Nokia's latest quarterly report.
As a quick review, Nokia reported the following performance for its mobile phones operations:
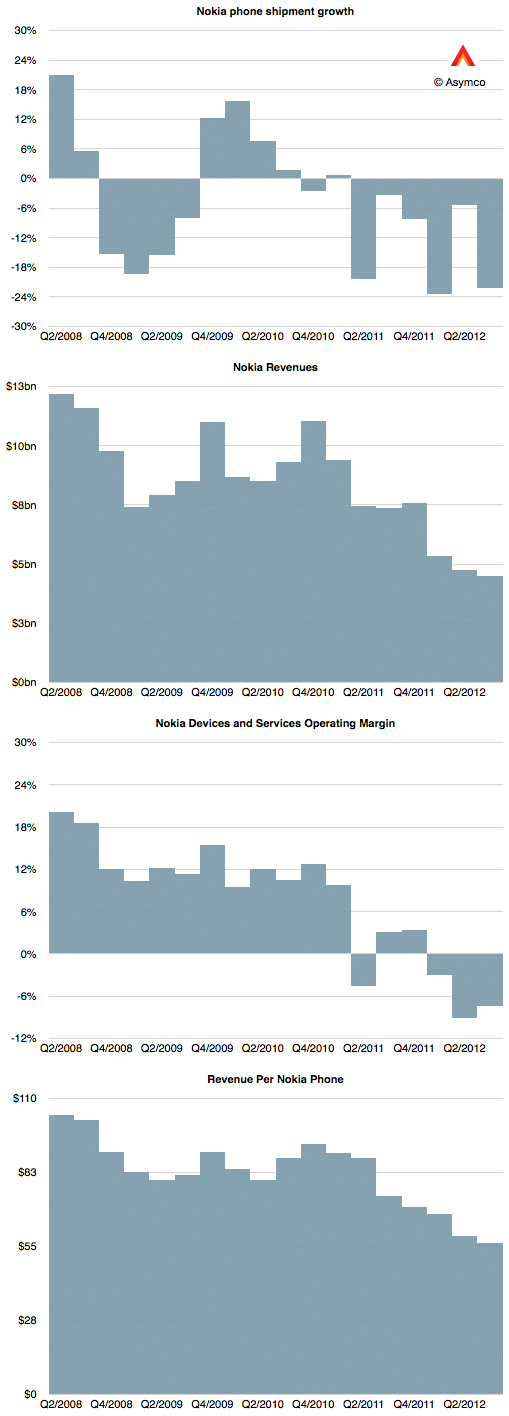
The most worrying thing of all however is that Nokia's smartphone performance has collapsed. With only 6.3 million units shipped, the company may be the worst performer among eight competitors I track. They were below RIM's shipment total.
The value of 6.3 represents only 7.6% of their overall phone shipments.
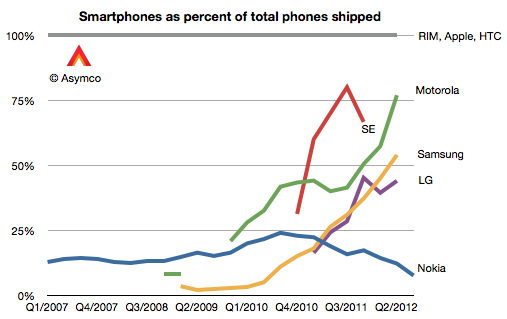
As the graph above shows, Nokia is going in the wrong direction with respect to moving to a smartphone portfolio.[1]
Of the total 6.3 million smartphones (aka smart devices, as per Nokia's reporting nomenclature) 2.9 million were Lumia Windows Phone units.
Using information about average selling prices and total volumes into North America, I was able to estimate that there were about 180,000 units sold into North America during the last quarter.
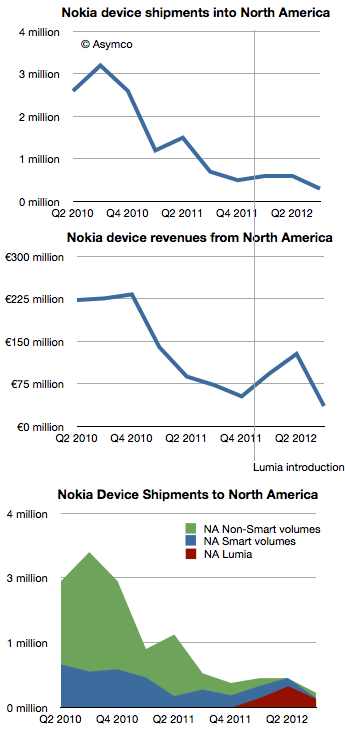
Since launch, my estimate is that Lumia has sold 810k units in the North American market.
This cannot be seen as a good performance. There are mitigating factors such as the lack of upgradeability to Windows Phone 8 which probably deflated demand[2]. However, it's a poignant observation that during the last quarter the US reached 50% smartphone penetration by users. As traction is still absent from both Nokia and Microsoft in the US market, we are back to the question of how to compete.
As the market in the US transitions from competition against non-consumption to competition among rival platforms, the Lumia brand is being forced into targeting smartphone "switchers" rather than smartphone "adopters". The switching option is expensive, requiring aggressive advertising (see Samsung Electronics' $11 billion ad budget).
There's only one source of cash for that sort of strategy.
---
Notes:
Research #Industry · 35 comments
With the iPad mini launch imminent, it's time to think about the expanding iOS portfolio. We don't know how much the "mini" will cost or what variants will be available but I took some rumors as a basis to form a hypothesis.
The idea is that there will be 24 variants which have three dimensions:
The starting point would be $250 for an 8 Gb WiFi only model and increases of $100 for each doubling of capacity and $130 for the addition of cellular chipsets.
The results would slot into an increasingly broad price spectrum. I included all the models of iPod touch, iPhone and iPad that we already have available and built the following graph.
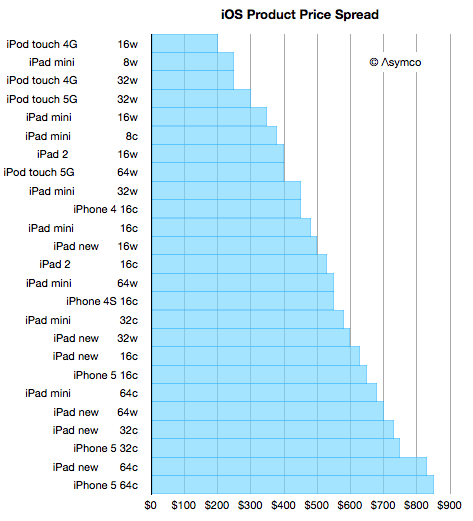
The number after each product name is capacity in Gb and the letter "w" signifies Wifi only and "c" signifies WiFi and Cellular.
You can look through the list and see whether products of comparable prices are "competing for a purchase decision" or whether there is some marketing logic to the arrangement. I consider the purchase decision not to be determined by price but by many factors like the job being offered by the product.
But in many cases buyers have a budget and are looking to fit a product into that price. This is more common when the product is a gift.
So with that in mind I created a quick motion chart in Perspective to answer the question: Given a budget, how much iOS device can you buy? You can "dial in" various price points and see what products are available with graphical representation of capacity.
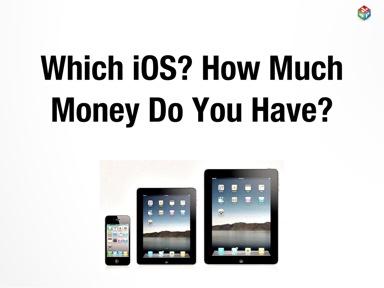
If you are on an iPad and have Perspective, you can launch the story (with voice-over) through the following link:
Which iOS? How Much Money Do You Have?.
If you're not an iPad but have one click on the "Send e-mail" to get a link in your inbox and open it on the iPad.
If you don't have an iPad but have an iPhone, stay tuned as an iPhone version of the app will be ready soon.
Research #Nostalgia #Theory · 67 comments
Marc Andreessen famously coined the phrase "software is eating the world." It's an apt observation. If you look back on the history of computing you're likely to measure computers sold or devices sold or users harvested or productivity gained. These things are measured because they can be measured. But the greatest cause of value created and captured has been the development of software. An ephemeral product whose value is often ignored in analytical discourse.
Software is not easily measured and it's not easily valued due to its intractable nature. Firstly, because businesses that make software tend to have weird cost structures--absurdly high fixed costs and operating margins: They operate without income for years and then suddenly are massively profitable with a minimal set of resources. They have a non-linear, "big bang" trajectory.
Secondly, software companies tend to capture revenues from something other than the direct sale of the good. Software is rarely sold. Services sometimes are sold on the basis of software but more likely audiences for services are sold to a set of bidders, or revenue is obtained in even more circuitous ways.
Thirdly, because there are curious multi-sided markets for software platforms. Charlie Kindel hints strongly at how difficult it is to understand the dynamics of software platforms. There is the prospect of lock-in of users and data. There are relationships to nurture with developers and there's the principle of an ecosystem that creates network effects. The virtuous/vicious cycles are non-linear and unpredictable even for the experts who have been at it for decades (e.g. Microsoft).
Given these difficulties, software is seldom seen as the core value proposition for a particular business. But make no mistake about it, Apple, Google, Microsoft, Facebook and Amazon are all software companies. They "monetize" or integrate software differently but software is causal to their profits. Their use of software has also made them all disruptive. Software enabled the disruption of consumer electronics, retail, computers, advertising and broadcast media.
But we have not seen anything yet. There is another class of software that is poised to lay waste to a new set of industries. The lowly app coupled with cloud-based services[1] is the termite that is set to eat the foundations of the largest of the industries still standing.
Consider the following:
Although these are enormous opportunities in themselves, this is in addition to several industries that are already crumbling (photography, book publishing, to name two).
I don't need to rely on prose alone to make the point. A graph can also lend a hand.
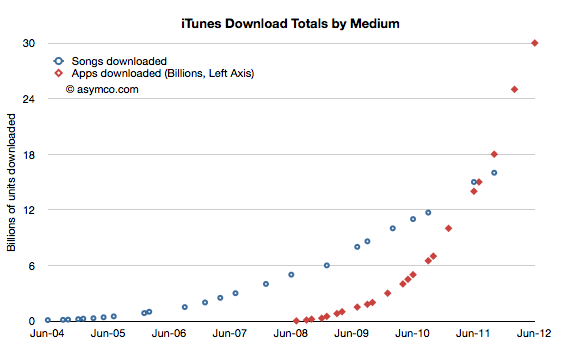
Consider that Apple's App Store and Google Play together have had over 50 billion installs in less than four years and that the number of users of apps is at least 750 million. Furthermore, consider that apps have moved from a smartphone phenomenon to tablets and even PCs using OS X or Windows. Within one year these software capsules are going to be in use by one fourth of the global population.
Nothing has this kind of reach or engagement, not even browsers. What makes the app disruptive, even ahead of a browser-based service, is that it includes incentives for developers (or, more precisely, app producers) to get paid and to have a relationship with the buyer. These two value propositions, in isolation or in combination, are available to millions and consumable by billions. The most democratized market that can be imagined. An unbounded set of producers and an unbounded set of consumers and a persistent connection after the purchase with nothing in between them except a payment mechanism
The world has never seen such an opportunity.
The consequences are unforeseeable. Apps are a form of software that goes beyond its ancestral "application" as a product and as a business model. It's the software that will take in and assimilate everything in sight.
---
Notes:
I talk to Jean-Louis Gassée about the early years of personal computing. The conversation spans from 1968 to 1991 and covers his roles at HP, Exxon Office Systems and his years at Apple. The story takes us back to a time and place that seems so distant and yet so familiar.
via 5by5 | The Critical Path #59: Gut-level Affection, An interview with Jean-Louis Gassée.
Research #padcast · 9 comments
Steve Jobs once joked that engineers think Hollywood writers do their work by drinking beer and telling jokes and Hollywood thinks building software is as easy as writing a check for the tech. In reality creating software and creating art are more similar than they are different. The phenomenon of mass market software in the form of entertainment has blurred the lines even further--making software has become more like making movies than making machines. There are lessons to be learned by all developers.
File Size 14.9MB, Talk duration about 30 min. Requires iPad.
The Price/Earnings ratio is a very simple measure of the "value" a company has. The Price is the current share price and the Earnings is usually the sum of the last 12 months' earnings per share. In other words it measures how many of the last year's earnings are built into the share price. Put yet another way it's the answer to the question "If earnings don't change, how many years will I have to wait before I'm paid back for my share purchase with retained earnings."
So a company with a P/E of 10 implies that if nothing changes, in 10 years a share owner would "earn" back the price they paid for the share. Any earnings after 10 years would be "profit" for the share owner. You can imagine it even more simply as buying not shares but an actual small business of your own. You pay up front for it and then wait until it pays you back. After getting paid back for the initial purchase you then make money that you can set aside.
Obviously this figure of P/E is very sensitive to growth in earnings. Consider paying $100 for a share of a company having just earned $10/share last year. It would have a P/E of 10. If earnings stayed at $10/yr for 10 years, you'd "get your money back" in 10 years. However if earnings grow at 20% then next year the earnings would be $12 then 14.4 then 17.3 then 20.7 etc. Adding these up means you'd get your $100 back in five years, not 10.
So with a company growing at 20% the "realized P/E" is 5. You realized the price of $100 in five years' worth of earnings. In the scenario above you paid expecting to wait 10 years but you got paid in five. If that's your retirement plan then you can retire five years early. Not bad.
Let's then look at what Apple gave investors as "realized P/E."
If you bought shares in the first Friday of 2006 you would have paid $76.3/share. At the time the company had $9.36 in cash so you actually paid $66.94 for any future earnings. The P/E ratio at the time was around 35.
The company went on to earn $2.78 in 2006. Another $4.63 in 2007, $7.47 in 2008 and 10.24 in 2009 and 17.91 in 2010. Then in 2011 it earned $35.11.
If you add these values up you realize that Apple reached your price about two thirds of the way into 2011. So the company earned your purchase price in 5.7 years. That becomes the realized P/E if you bought in early 2006. The following diagram shows the time period as a box encompassing the earnings (and cash) for a share purchase in early 2006.
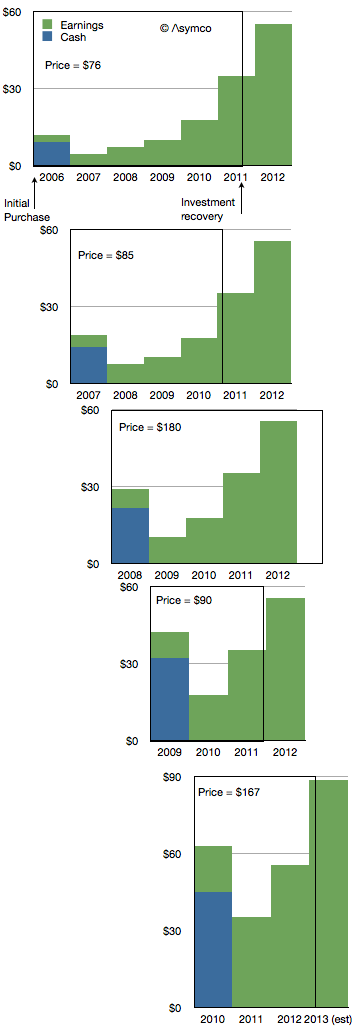
I repeated this for purchase in early 2007. The result is a Realized P/E of 4.9. I did it for 2008 as well[1] and got 5.4 then 2009 yielded an astonishing 2.9. 2010 was not much different with 3.2.
Investing in Apple between 2006 to 2010 meant obtaining a payback period of less than 4.5 years, on average. In other words, regardless of what the trailing or forward P/Es getting quoted at the time (trailing is illustrated below), buyers actually paid for only about 4.5 years of earnings. In other words they actually bought Apple for a P/E of about 4.5.
Using our small business analogy, buying Apple in the past few years has meant getting paid back in less than five years. That makes it a very low risk opportunity.
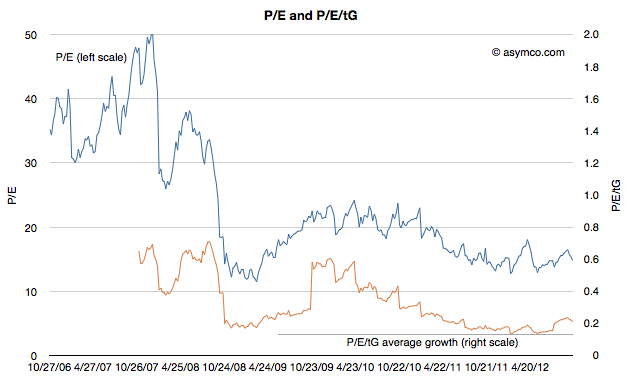
I could try to repeat the process for years 2010 onward but it would require making forecasts beyond 2013, something I leave as an exercise to the reader.
---
Notes:
We discuss composing presentations on an iPad while on the road and, at long last, the completion of the Critical Path book. We examine Apple's honing technique in design, and how it contributes to forging products that are as uniquely experiential as the traditional samurai sword.
What job is there for the iPad mini to do? How do we stay focused on fundamentals when it comes to analyzing Apple's stock price?
