Asymco

Asymmetric Intelligence

Horace Dediu

  1. The late smartphone adopter paradox

    Research · 70 comments

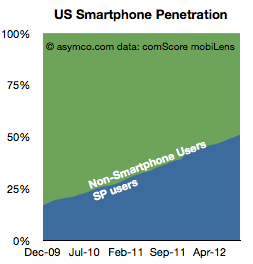
    comScore reports that US smartphone penetration has decisively crossed over 50% in August. This should not come as a surprise as the penetration rate has been very linear.

    Now that we've crossed this milestone, the thing to watch is the conversion rate from smartphone non-consumption to smartphone consumption.

    The reason is that we don't know what "saturation" means in smartphones. We can assume it's at least 80% as about 80% of new phones being purchased are smartphones. What we don't know is how much above 80% it can be. It could  be 100% if feature phones simply stop being made but we can't be sure if there will be latent demand and how long this will last (similar to the market for black-and-white TVs after Color became commonplace).

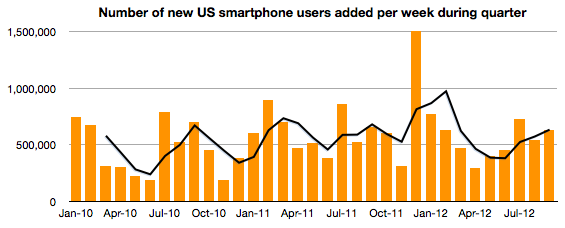
    To help keep an eye on this measure, the following graph shows the rate at which non-smart to smart conversion is happening.

    It measures the addition of new (to smart) subs each week in a particular measurement period (three months ending the month shown on the x-axis). There is also a 3 period moving average shown as a line. Keep in mind that this shows net new users and therefore excludes smartphone switchers. It's a good measure of how rapidly non-consumers are being converted to consumers.

    The data shows that there are as many first time smartphone adoptions in late 2012 as there were in late 2010. Or, the new-to-smart users are joining ecosystems just as quickly when penetration is 50% as when it was 20%. An encouraging situation when considering the opportunity space above 50%. The "S-curve" has not reached an inflection point.

    If you're thinking about growth, so far so good. There is however one surprise in the data.

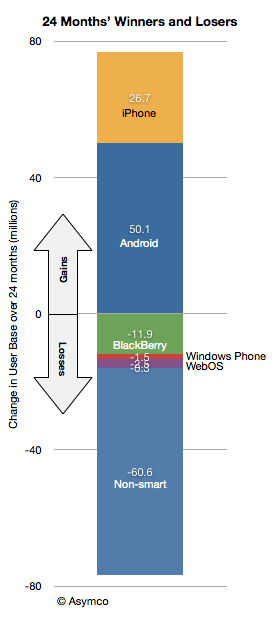
    All the growth in the last 24 months (between 2010 and present) was due to Android and iOS. Android added 50 million and iOS added 26 million in the last 24 months. The net smartphone user additions were about 60 million (RIM lost about 12 million, Windows lost 1.5 million and others lost 2.6 million). Android therefore has gained twice as many users as iOS has in this two-year period. Put another way, Android captured 70% of the growth and iOS captured 30% of the growth.

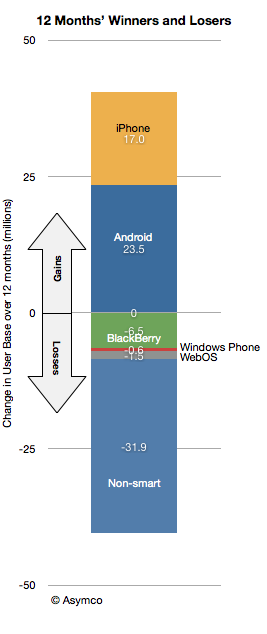
    However, if we look at the last 12 months, the split is 23.5 million for Android and 17.0 million for iOS. Android gained 58% of the growth and Apple captured 42%--a change in "spread" from 40 points to 16 in favor of Android.

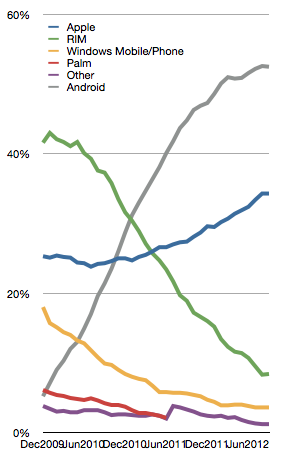
    The evidence also shows itself in the trajectory of platform market shares of installed base.

    In the last six months, Android share growth is slowing while iOS is still gaining.

    If this trend continues then the next 50% may not behave as one might expect (namely that late adopters would take the low-cost commodity offering accelerating Android adoption.) Late adopters may, in fact, be choosier than early adopters. And it's not at the cost of overall growth. Late adopters are still converting at the same rate of the early adopters.

    Therefore, paradoxically, the late market shows that the prospect for iOS growth seems strong. Furthermore, as we do reach saturation, perhaps in another three years, the secular growth may end in the US but the loyalty of iOS usage may give iOS another advantage in a market where growth is determined by "platform churn"

    The US is the crucible of the phone market in many ways so what happens in the US may be a harbinger for what happens world-wide.

  2. The App Revolution (in Filmmaking)

    Research · 21 comments

    The following article is published in Filmmaker Magazine. Fall 2012, Vol. 21 #1.

    There is a saying I once heard: "Once you change the method of distribution, the product has to change."

    This itself is a take on the idea that distribution defines the product. You see this around you every day in the products you buy. Cars are influenced by the dealership networks that sell them. Phones by the mobile network operators and the choice of computer you use at work by whatever the IT department or value added reseller prefers to work with. Mass market restaurants offer what can be sold by wholesalers--typically frozen, long shelf-life staples. Almost every product category is shaped more by what can be distributed than what can be produced. That's simply because in mature economies distribution is harder than production. In consumer products it requires access to wholesalers who then require access to shops who themselves have access to prime real estate which attracts foot traffic. Production only requires capital. Distribution requires relationships, often exclusive ones.

    This pattern is even more pronounced when looking at media products. Production is arguably easier since it's constrained by talent, which is fungible. But distribution is even harder as it is addressing bigger audiences in shorter time frames. You see this lopsided balance of power in the abundance of books being written relative to those being published. There are thousands of films produced and hundreds get distributed.

    But the saying suggests that if distribution were to change then the product itself would change. Indeed, if you can sell ebooks direct, then they tend to evolve into new genres (e.g. Fifty Shades of Grey). If you can sell cheap adult video online it tends to evolve into new genres as well (I'll leave examples to the imagination.) YouTube videos quickly cluster around "Fail" or "Win" compilations which evolved from America's Funniest Home Videos. They get millions of views. Even before the Internet, the availability of cable created the genre of music video, which created the first music broadcast alternative to radio. And of course, cinema itself redefined theater once it could get shown to millions rather than thousands. The new methods of distribution of media affected what gets produced rather than the other way around. Consider the converse: innovative filmmakers who try new storytelling methods are stymied by a lack of acceptance by existing distributors and find their material languishing in festivals or perpetual cult status.

    So we can re-state the saying to a new "Law of new media": Once you change the method of distribution, the medium itself has to change.

    I gave examples of how Internet distribution changed some media formats. However, the Internet itself has not had any effect on long-form cinema so far. In fact, you would be able to tell if Internet distribution did work by watching if the product would change. So far, it seems, at least to me, that the commercially successful product has not changed. One reason has been that film is still a very difficult product to distribute digitally as most of the world does not have the capacity to buy, consume and enjoy films digitally. Another is that the current distributors have had an allergic reaction to the option. As existing products have been crammed into the new distribution chain (e.g. Netflix) the established distributors are experiencing channel conflict and are raising the costs of digital distribution rights. Netflix has seen its costs triple as it ate into Cable market share. Fundamentally, the incumbent distributors are reluctant to open a channel of distribution which conflicts with or reduces margins of the existing channels.

    This brings up another corollary: fundamentally, you can’t move an existing media to a new network. You have to think of it as a deeply rooted-in system, and it's just not going to like moving to another environment. You have to uproot this huge tree, and it just won’t come out and if it did it will not take root in a new place.

    The only way to create this new value network around new distribution is to plant a new tree.

    This is the problem for the technology industry today. The only way technology companies can solve the “content is king” dilemma (which, by the way, is an euphemism for "Hollywood is king and Silicon Valley isn't"), is by allowing new content to flourish on top of new platforms. It’s not about moving the old content to the new platform. It’s about allowing new content to be created exclusively on the new platforms. This new content will therefore, by our law, be a new medium.

    For me, apps are that new medium. Apps offered a new way to package entertainment for “niche time”. The early fart apps evolved into a whole new genre of games which are now challenging the established game studios. The result is that a generation of developers has moved from building PC or web software to apps with cloud back-ends. The first to switch to this new medium were those with the least to lose and with the most modest of goals. Apps have now a more valuable industry than digital music with over 55 billion installs between the iPhone and Android ecosystems. Consumers are increasingly spending their spare time in front of apps. In the US “app consumption” increased from 43 min/day in 2010 to 94 min/day at the end of 2011. This number already exceeds the time spent in web consumption. I find it difficult to doubt that app time will exceed TV time, especially as TV time is increasingly a dual screen experience.

    (Feels like it needs one sentence explaining why. Is it because of their accessibility to small developers, or their ability to reach mobile handsets natively, or because of consumer trend?) If it’s absolutely impossible to move long-form video or long-form cinema to this new medium in such a way that everyone in the world can consume it on every device, then the app ecosystems will take up that challenge and say, “There’s a job to be done, and that’s to enertain people for an hour-and-a-half with characters, plots and wonderful stories, and we will make that happen, and we’ll call this thing an app.”

    And that app will solve that job for that person. It's what's happening to the game console business. The new game apps are distributed differently, priced differently and produced differently. As a result they are used differently and make a different set of developers thrive.

    The new app media will mean that we’ll just have to live in app universes, and go eat popcorn somewhere else. Microsoft and Google and Apple and Amazon and anybody else whose belly is at the bar has been scratching their heads wondering "How do we move that content over to us?" They've been barking up the wrong tree. The fundamental question isn't how to cram old media into a new shiny screen. It is how do you let developers and artists and creative people create stuff that is new and compatible with this new way of living.

    Think also about the history of media -- movies haven't been around forever; music hasn't existed as a recorded medium forever. Not even books. What did people do before these forms of expression? We think of the use cases of going to the movies, or the use cases of sitting in front of a TV on Sunday night, or playing a console game. These things didn’t get done at some point in time. Nor will they be done at some future point in time.

    In a few years we’ll move on and we won’t do those things. Each person will probably have his own screen in front of them--many already do--and whatever we do together we’ll do through a shared screen. We won’t have communal experiences that we associate with the old media. Certainly not in a theater. Maybe not even in a living room. And that is how we will move into a new value network.

    It is inevitable. As a technology provider, you shouldn’t try to squeeze a 19th-century model into a 21st-century model. Just let it go. Create a platform and give people the freedom to create on it. As a media creator, you should try to learn what the new model demands. New forms of interaction, new story telling opportunities, new ways to communicate with audiences. Create experiments and learn. It's the only way.

  3. Hey Big Spender

    Research · 64 comments

    In previous posts I described the patterns of asset value growth for Property Plant and Equipment at Apple and how that change has been thus far correlated to the production of iOS devices.

    The analysis was based on looking at the declared value of the PP&E assets on Apple's balance sheet. These values include depreciation so they reflect not only the "spending" on new assets but also the value lost due to wear and tear. As such it's not a perfect measure of investment.

    The better approach is to use declarations on the cash flow statement. Apple reports a specific cash flow related to PP&E: Under Investing Activities, Payments for acquisition of property, plan and equipment.

    In the latest 8-K the amount for the 12 months ended September 29 the value was $8.295 billion.

    Compare this with the statement in the Annual Report from one year ago:

    The Company anticipates utilizing approximately $8.0 billion for capital expenditures during 2012, including approximately $900 million for retail store facilities and approximately $7.1 billion for product tooling and manufacturing process equipment, and corporate facilities and infrastructure, including information systems hardware, software and enhancements.

    Compare also with the PP&E net asset value on the Balance Sheet currently at $15.452 billion but valued at $7.777 billion a year ago (an increase of $7.7 billion).

    This means that Apple intended to spend $8 billion, actually spent $8.3 billion and realized a net asset gain (after depreciation) of $7.7 billion.

    So there are no major surprises. The spending was only about 4% above expectations a year earlier.

    The other pattern to observe is that the spending rose dramatically into the fourth quarter. The fiscal quarterly spending was:

    1. $1.32 billion
    2. $1.46 billion
    3. $2.06 billion
    4. $3.46 billion

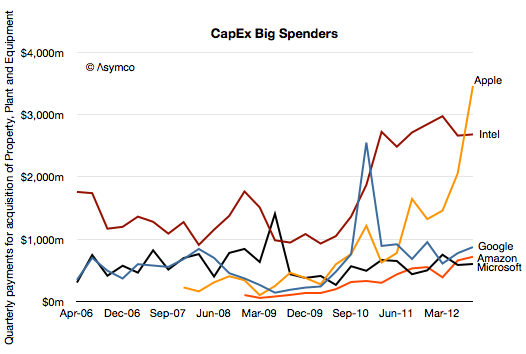
    I illustrate this pattern (and previous quarterly spending) in the following chart.

    The question remains what is this $8.3 billion being spent on?

    To help answer I also added the comparable spending (from cash flow statements) of a few other technology companies. Google, Amazon and Microsoft have been spending in the same range of $500 million per quarter. Over the past eight quarters the average spending of these companies has been:

    • Amazon $487 million
    • Microsoft $583 million
    • Google $800 million

    Intel is different. Its average spend level has been $2.6 billion/quarter.

    But Apple has just spent about 30% more than Intel. And it spent three times in Q3 than Google, 4.8x Microsoft and 3.8x Amazon.

    The level of spending and growth from a far lower level implies to me that Apple is spending primarily on process equipment (aka tooling) rather than servers. Data centers are expensive at $1 billion for a large one, but they are not being built fast enough to account for $3.5 billion in one quarter.

    Note that Apple's CapEx is above that of Intel whose fab-based semiconductor production method is known as particularly capital intensive. And Intel's Capital Expenditures have been increasing to all-time highs.

    If Apple spent at Google levels on server infrastructure it would only be spending a quarter of what it's actually spending. If Apple spent on production at Intel levels it would only be spending three quarters of what it's spending.

    In other words, Apple is spending at the equivalent of one Intel of fabrication and one Google of server infrastructure.

    In a few days we will learn what the plan for expenditure for fiscal 2013 is. Historically, the company has roughly doubled spending for each year of the iOS platform. If that continues then Apple will be spending the equivalent of several Intels and several Googles.

  4. The beloved hobbies of Google and Amazon

    Podcast · 40 comments

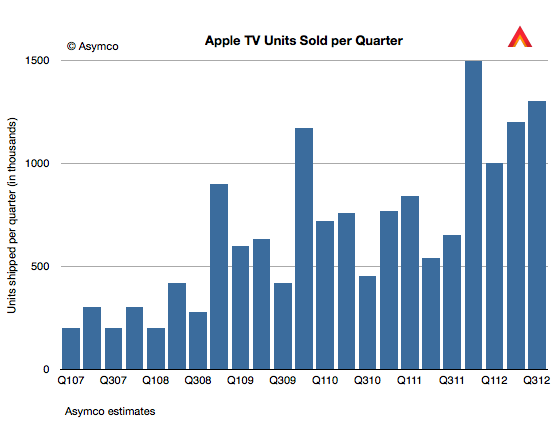
    Tim Cook speaking about the Apple TV product:

    For Q4 we sold 1.3 million. That is up over a 100% year-on-year. We sold more than 5 million Apple TVs during the fiscal year, which is almost double the previous year, when we sold 2.8 million. So the business continues to do very well, but if you look at the size of revenue of this business versus our other businesses, it’s quite small and so it still has the hobby label, however it’s a beloved hobby and we continue to focus on it and continue to believe there is something more there and continue to pull the string to see where it takes us.

    Five million Apple TVs per year is a half-billion dollar hobby. As such it quintupled from the first year (calendar 2007).

    The value for hardware is, of course, only a part of the story. It is accounted for as part of peripherals revenue and amounts to 18% of total peripherals revenues. Last May I estimated that the installed base of Apple TVs was 10 million. I'd estimate current total to be closer to 12 million. Assuming $10/month in content sales per Apple TV results in $1.4 billion of which 30% might be retained by Apple as revenue (agency fee).

    The yearly revenue thus could be as high as $900 million. Therefore it seems plausible that Apple TV is on the verge of being a billion dollar business.

    It may be a hobby to Apple but I've noted before on my podcast that Apple TV is a mirror image of the Kindle business model: Sell hardware at low margins and experiment with content sales as a profit model. The "hobby" moniker means that it's not a big business but how big is Kindle or Nexus 7 for their respective owners?

    Kindle may sell up to 10 million units at nearly break-even but is the average revenue per user much higher than Apple TV? What about the Nexus franchise? Is the loss on hardware leading to revenue to Google+OEMs above $10/month? I doubt it.

    I can't be precise or absolute about it since we don't have data from Amazon or Google about units or from any of the platforms' margins or attach rates for content, but I'm doubtful that they qualify for more than hobby status according to Apple's definition. At least in terms of profitability, Apple TV could be bigger than either Kindle or Nexus tablets.

  5. The iPhone and Apple's Margins

    Research · 17 comments

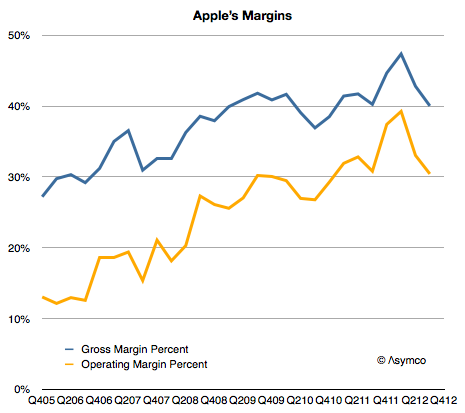
    As the following graph shows Apple gross margins and its operating margins have both been on a consistent upward slope since early 2006.

    The reason is that the company has moved to more mobile devices as a percent of products shipped. Whereas Macs have had decent margins by the standard of the PC industry, they are not as profitable on a unit basis as iPods, iPhones or iPads. As portable or mobile products grow rapidly, it would follow that margins would as well.

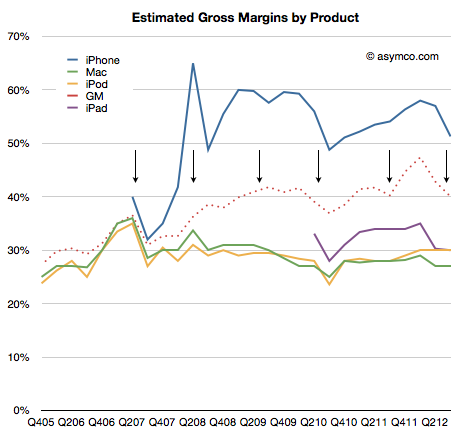
    However, the growth is not monotonic. There are occasional dips in gross margins. The cause is the launch of new device versions. On the following graph I show the launch times for the iPhone versions and the company's gross margin as well as my estimates for iPhone and other product line margins.

    The general pattern is clear: each new version of the iPhone causes a dip in gross margins. This is not surprising as the company forewarns of this (in a decidedly exaggerated manner.) But why does it happen?

    The iPhone is a profit monster, but when it launches there are many costs associated with it: components tend to be more expensive, there are more warranty returns, there are higher shipping costs are units are shipped in smaller lots to more points of sale. Tim Cook explains as "In terms of costs, with each new product we see learning curves associated with ramping production."

    Every launch causes an amplification of these learning effects. With each dip in margins however, comes another surge as the learning is complete and the volumes of the new generation product begin to dwarf the previous. And so the process continues.

    There is an asymptotic limit to margins as they cannot grow higher than whatever the iPhone yields but that's not yet in sight. The upper bound is probably in the 50% range.

  6. iPad sales grew 44 percent in Q3

    Research · 31 comments

    The iPad grew shipments at 26% y/y but "sales" as measured by sell-through were up 44%. Detail from Tim Cook's discussion:

    "The June to September [sequential change] was 17 million to 14 million…   as we had talked about in the July call, the June quarter contained 1.2 million increase in channel inventory and so … the comparison looks very different than our reported [shipment] numbers do… On a year-over-year basis, because of the year ago quarter having also a channel inventory build as we stock the channel to the [proper] level, the sell through year-over-year actually grew 44% and so the underlying sell through was extremely strong."

    Sell-through, (or "sales" vs. "shipments") is a much better indicator of demand, obviously. Also see transcript for explanation of sequential decline (educational buying).

    44% is not spectacular but it places the growth far more comfortably in the "high" bracket than the 26% units and 9% revenue growth that shipments data would indicate.

  7. Apple's Growth Scorecard for third quarter 2012

    Research · 70 comments

    In the parlance of developers Apple keeps "throwing exceptions." This quarter the iPad surprised with a significant decline in sales growth. I placed a table showing the sales growth for this quarter as well as the previous 22 quarters at the bottom of this post.

    Here is a quick review of each line:

    1. The iPhone returned to a more customary growth rate (which I rate as Very Good--above 50%). The quarter was bound to be quirky due to it being both a transition quarter and a launch quarter. The launch of the iPhone 5 came quite late but not too late to make a contribution. It was also widely rumored and anticipated so there was slowing of the previous generation product. I expect growth to accelerate further in the last quarter of the year.
    2. The Mac turned in a commendable 6% revenue growth (1% unit growth) on the back of the new 15" Retina screen MacBook. The average sales price increased sequentially and the mix of portables to desktops reached a new high of above 80%. More about the Mac will be written in a future post.
    3. The iPod continued its decline. The 26% sales decline was in-line with other non-launch quarters. The company tipped its hand and let us know that iPod touch now makes up 60% of iPod volumes. At 3.2 million iPod touch units, it's a significant iOS contributor but still a declining number.
    4. The iPad was painfully underperforming. With only 9% revenue growth, it was a complete reversal of the torrid growth of the last two years. Management blamed both anticipation of a new product and a reduction of inventory ahead of refresh of the larger screen retina. The only silver lining was that the average price decline was moderate (down about $3/unit). Overall, I'm very disappointed with the pause in the product but the new mini could change the character of the product dramatically in a way similar to how the iPod mini turbo-charged the iPod line.
    5. iTunes had a very good quarter. It's the perennial growth engine with the most consistent performance throughout the time period shown. It was the second fastest growing line item firmly in the "High" growth bracket.
    6. Peripherals, including Apple TV had a moderate quarter. Management revealed that about 5 million Apple TV units shipped in the fiscal year. That adds up to a half-billion dollar revenue business. Peripherals had $2.8 billion over the same time frame so Apple TV was about 18% on a yearly basis. This does not include content revenues.
    7. Software had a modest growth of 22% but has come to be the high end of the range. Since changing the way it prices OS X updates, the era of Apple software windfalls is over. Still, at nearly $1 billion per quarter it's nice pocket change, especially as it's nearly all margin.
    8. The overall top line (net sales) was a bit improved sequentially (+4 points of percent) but still in the "transition quarter" range of moderate growth. The company may be shifting its launch cycles and as a result we're seeing a break in pattern. As pricing for iPhone and iPad did not change very much the slowing of top line growth is entirely due to a unit shipment reduction. Again, the primary cause is transitions in multiple lines simultaneously.
    9. The bottom line (earnings) followed the same pattern as top line (slight sequential increase in growth). There was a slight attenuation of margins (gross margins are down to 40%).

    Overall, the quarter was not up to the recent level of performance for Apple. Growth was overall "moderate".

  8. Asymconf 2012 videos now available

    Podcast · 6 comments

    The Asymconf 2012 videos are now available for purchase from the new Asymco Store.

    The package includes 1080p HD video produced by Kevin Krautle. Multiple camera angles capture all the action. Great quality audio and hours of conversation. It's even subtitled. Over 20 gigs of content.

    But wait, there's more. You also get Perspective stories, Audio Podcast and Transcripts all for the low, low price of $89.99. Over 20 Gigabytes of content.

    I hope you enjoy it as much as we enjoyed producing it.