Asymco

Asymmetric Intelligence

Horace Dediu

  1. Samsung's basis of competition

    Research · 70 comments

    Samsung has been selling smartphones for a relatively short time. Although the company sold Windows Mobile, Linux and PalmOS during the last decade, it did not gain significant volumes until it began selling Android phones in 2010 with strong operator support.

    That support was substantial in the US. The company crashed the Android party in mid 2010 with its Galaxy brand. Trial evidence reveals that the sales level for Galaxy S1 series phones burst out of the gate taking Samsung from 90k units to 2.5 million units in one quarter.

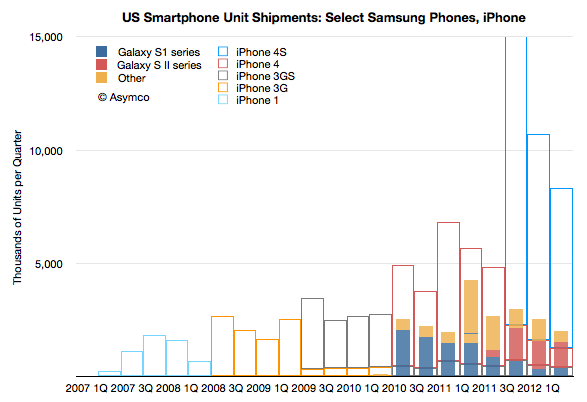
    The following graph shows the unit shipments recorded by Samsung for a set of US smartphones.

    Note that the profile of sales volume shows a cyclicality with respect to product launches. Each new generation overlaps with previous generations and "fills in" while the older generation product tails off in sales. This is standard portfolio strategy. It also shows the cycle time of launches is approximately four quarters. As the S1 was four quarters old, the SII launched and the SIII follows after four quarters of SII.

    What is surprising is that the overall sales volume is not growing. At least for the products catalogued (which exclude the Note) growth for the last four quarters has been: 5%, 34%, 31%, -53%. These are in stark contrast to the iPhone pattern shown in the outline bars behind Samsung's.

    The iPhone ramped slowly in 2007 and 2008 and has been showing remarkable generational growth.

    Perhaps it's still early and Samsung SIII product will ramp up as the contemporary iPhones do, but if it doesn't we have entertain the possibility that the iPhone does not compete along the same basis.

    What does it mean to compete on a different basis?

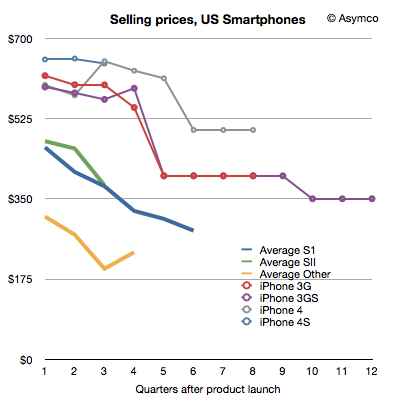
    The basis of competition is the aspect of an offering for which a customer is willing to pay a premium price. It's hard to know (or to put your finger on) what the basis actually is, but we can test whether it's the same by measuring whether two products capture prices the same way. If one product that seems to resemble another can obtain price advantage consistently, then perhaps it's being bought for a different reason.

    To test this, I produced the following chart showing the prices that Samsung's phones have been able to capture through their lifetimes; and the same for the iPhone.


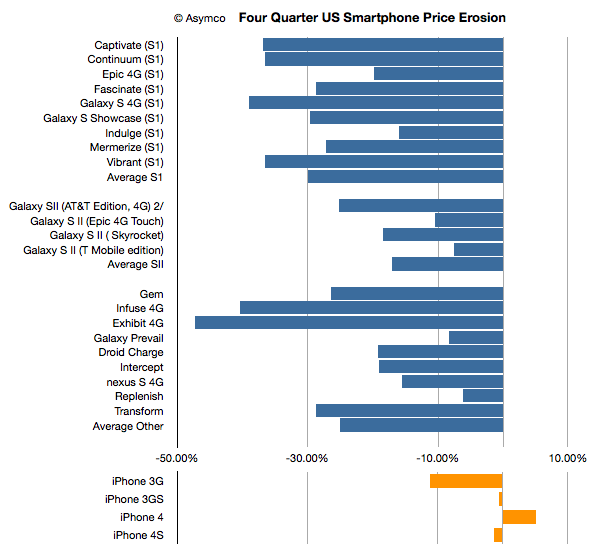
    I've narrowed the analysis to the first four quarters and summarized the price erosion across all the products as well:


    [Note: iPhone 4S, Skyrocket, T-Mobile Galaxy SII showing only three quarters]

    As mentioned, it's still early perhaps, but the pattern for the iPhone has been different.

    Samsung's pattern is not unusual. I've seen similar pattern for almost all Nokia products. Prices drop. It's a standard industry phenomenon.

    Therefore the question is not perhaps what is Samsung's basis of competition: it's the same as the overall phone industry. The question is what is the basis of competition for the iPhone.

  2. Apple Store Operational Economics

    Research · 18 comments

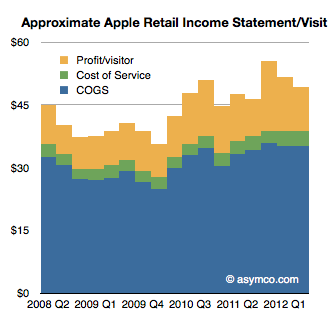
    In a footnote to my last post on Apple Retail (The face and the brand) I used data on operating performance from Apple and an assumption about employee salaries (which turned out to be low) to estimate that about 7% of Apple store sales are spent on "cost of service" or the operational expenses, which consist of mostly employee salaries.

    An updated view of this store income statement (on a per-visitor basis) is shown below:

    To summarize the logic, during the last quarter Apple received $49.2 in store revenues per visitor. Knowing the retail profit ($10.46/visitor) and knowing the time spent per visitor (14 minutes, itself derived from the number of full time equivalent employees--41,000 or 112 per store) and assuming the cost of that time in employee salaries ($15/hr including benefits), gives us an estimate of the service cost ($3.55/visitor) and therefore the cost of goods sold ($35.2/visitor).

    Now I want to focus on this ratio of service cost/sales which turns out to be about 7%[1] and ask whether this is significant or revealing.

    In order to do this we have to understand that most stores, especially electronic goods retailers, don't spend this much on salaries. They do spend quite a bit on commissions however. From a post on the subject, I gathered the following commission rates for various retailers:

    • Phone stores: $25 for activations, 10% of accessory sales
    • Beauty/handbags at department store counters: 3% to 5%
    • Shoes, appliances, electronics: 8 to 10%
    • Furniture: 2% to 6% (low rate includes salary)
    • Real estate: 2.5% to 3% (no salary)
    • Car salesmen: 30% after dealer costs

    Now 7% to 10% that Apple spends on salaries starts to make some sense, economically. It's roughly equivalent to what another retailer might spend out of their sales on the help.

    The difference is that Apple does not pay commissions and that cost is spread over a far larger headcount of staff. Roughly speaking it implies that Apple hires five times as many employees (consider how many people you might see in an Apple store where the average is 112 and in a similarly sized Polo Ralph Lauren outlet) as would be needed to "just sell stuff."

    The trade-off seems to be that Apple will pay a modest wage to a hundred employees rather than a commission to a handful. The trade-off is pretty even since the profits would be the same.

    But they wouldn't be.

    The difference is that what the customer buys is different. Or, put another way, a store bursting with staff is hired by the customer to do a different job than a store filled with a handful of "salesmen".

    Even though the economic ratios are similar, the result is that visitors at an Apple store are made to feel they're getting a service rather than being sold a product.

    And that's the key to there being very many visitors. And, incidentally, they happen to buy more things. And also incidentally they come to value the brand more.

    It also leads to a virtuous cycle. More visitors means more visibility for the store and that leads to more visitors still, and that leads to more employees.

    So a simple decision to hire in proportion of a level of service rather than a level of sales leads to completely different bottom line results.

    That's not to say that this model is transplantable. The entire system depends on having the right goods to sell and the right brand image. But if Apple had all those things and imposed a commission structure in its stores, one can be fairly certain that sales would not be as spectacular and growth itself would suffer.

    ---

    Note:

    1. Again, this is probably quite an under-estimate and the actual cost of service might range up to 10%.
  3. 5by5 | The Critical Path #49: Fly me to the Moon

    Podcast · 8 comments

    Horace takes another look at the aviation industry and asks whatever happened to air taxis. Then we go back to the manufacturing miracle of WWII in order to ask what might be the limits to growth. That helps us describe the "top down" opportunity for iOS and mobile computing in general looking at the overall mobile phone market. Finally Dan asks what are the qualifications needed for an analyst to perform wide-ranging reviews of industries.

    via 5by5 | The Critical Path #49: Fly me to the Moon.

    See also: Headroom (tweet).

  4. Exclusive interview with Asymco's Horace Dediu | The Tech Block

    Research · 18 comments

    Horace, you spent nearly a decade at Nokia, where you worked as a business development manager and industry analyst. Did you foresee their current, increasingly dire situation?

    I did not see an explicit downfall. I anticipated difficult times ahead and a deep crisis. My view of what would happen was published as my first Asymco post.

    What led you to start Asymco?

    I started a consulting company which I hoped would generate leads through a blog. The blog became far more exciting than consulting and it became my primary focus after about one year. I had no ambition to write for a living or to be a “blogger”. I did not anticipate there would be any interest on the topic I wrote [about] beyond a handful of people. In that regard, things played out as they do at most start-ups: what you end up doing is not anywhere near the target you aimed at.

    Apple’s clearly one of your favorite topics. What about the company appeals to you?

    Business education is predicated on storytelling, also known as the case method. Business management is not a discipline that has “axioms” defining basic truths, or if it does, they change frequently. Therefore business education (i.e. the MBA) is the equivalent of people teaching each other by telling stories around a campfire. The best stories get repeated more often and are better ‘teaching tools’. So it is with Apple. It’s a great medium for story telling because people can see the stories unfolding in real time or at least within their lifetimes. They are not about a distant past or an abstract industry. There is also a lot of passion around the brand, both positive and negative and so it leads to more attention.

    Read more here: Exclusive interview with Asymco's Horace Dediu | The Tech Block.

  5. How many iPhone ``5''s will be sold?

    Research · 78 comments

    Phil Schiller stated (under oath) that when assessing sales for a new model of the iPhone, Apple used an easy shorthand:

    Each new generation sold approximately equal to all previous generations combined.

    That's a helpful gauge. Did it hold and will it continue to hold?

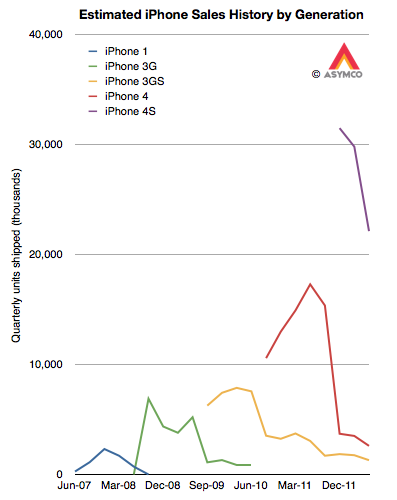
    In order to test this rule of thumb we need to know generational sales. Although we know overall unit sales for a given quarter, since Apple has been selling several versions simultaneously, we need to make some guesses about the ratio of generations in the mix. My guess is about 10% for 3G vs. 90% 3GS and 5% 3GS vs. 10% 4 vs. 85% 4S. That results in the following pattern:

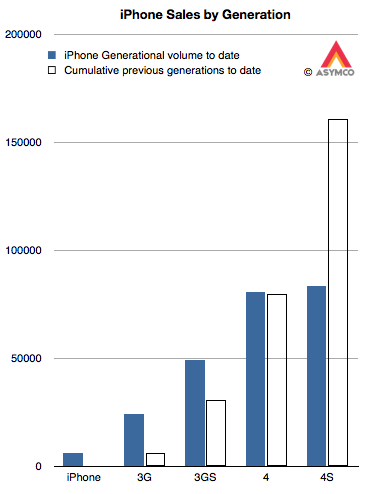
    The cumulative totals for these generations can then be generated and they appear as follows:

    The solid bars are the shipments for each generation (to date) and the outlined bars are the cumulative shipments of all prior generations. The assumptions show that:

    • The 3G easily outsold the original iPhone. In fact, it sold nearly four times as many.
    • The 3GS also handily beat the 3G+original total by a factor of 1.6
    • The 4 also beat the 3GS+3G+original. As the 4 may continue to sell into the future, the beat will only grow larger.
    • The 4S is only half way through beating  the 4+3GS+3G+original. Assuming the current quarter's sales roughly equal the last quarter's, the total for 4S will reach two thirds of the sum of the previous generations (i.e. 100 million) by the end of September. Bearing in mind that the 4S is likely to remain in production at least one more year means it has a potential to come close to the target of 162 million.

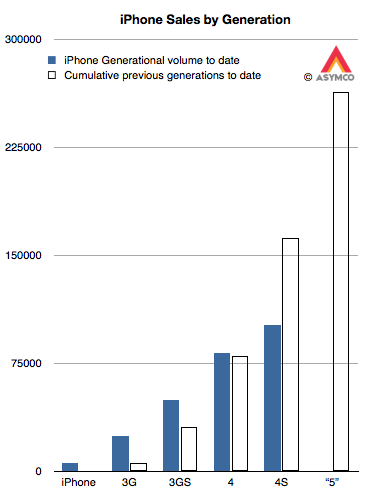
    This leaves us with the question of how many iPhone "5"s will sell. As it stands today, the cumulative total would have to be greater than 263 million units (including assumptions for the current quarter.) That target is shown below:

    Is that a reasonable target?

    Unfortunately, this is a moving target. As the 4S (and maybe 4) remain in production, the target continues to increase with time. However, we can still take a stab at this.

    Recall the analysis of production based on budgeted CapEx spending. It resulted in a best guess of about 165 million iOS units sold in the following two quarters. I further forecast iPhones in isolation to be about 102 million over the same period. Taking that forecast forward and assuming a 60% growth rate,  I currently have about 200 million iPhones over the next twelve months. If 85% of those are the next generation, that yields about 170 million iPhone "5"s through mid 2013.

    This is well short of a target of 265 million. But that's only over the next four quarters. If the iPhone "5" remains in production for at least as long as the 3GS then it might cross 200 million. There is also the question of whether the "mix" will begin to favor the older generations more. If that's the case, we might see version "5" meet its target.

    Underlying all this is the question of a change in strategy toward more penetration (vs. current skimming.)  That might allow for sustaining the 100% historic growth rate. If so then Apple will easily sell 250 million iPhone "5"s.

  6. The biggest loser

    Research · 37 comments

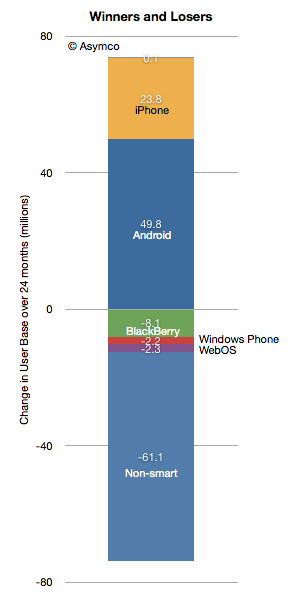
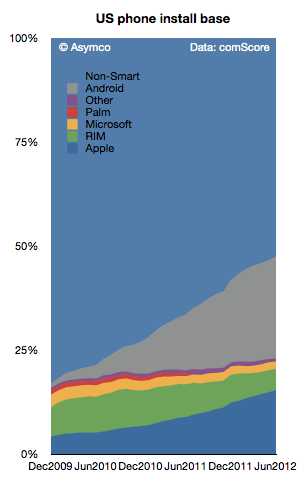
    According to data from comScore, in the past 24 months 50 million Americans became Android phone users. In the same time frame Apple added 24 million iPhone users. As I mentioned in my Asymmetric Competition post, it would be unwise to consider this data in isolation. Consider the following graph showing the net change in users in the US.

    Android and iPhone grew mostly at the expense of non-smart users. The BlackBerry lost 8.1 million users and all the others only lost about 4.5 million.

    With penetration at 50% it's still impressive that there is so little "churn" between platforms. In fact, measuring churn as the net platform user loss as a percent of all smartphone users, we get something less than 1% per month.

    The smartphone competition is still primarily with non-consumption.

    That will change at some point when smartphone penetration (shown below) will begin to saturate. The basis of competition will have to shift from converting non-smart users to converting users of other platforms while maintaining one's own user base.

    The market has not experienced this sort of rivalry on a wide scale. The defections of BlackBerry and Symbian users are relatively rare events.

  7. Perspective and Context in Personal Computing

    Research · 49 comments

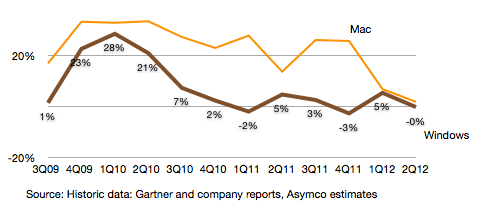
    The Mac grew at the extremely low rate of 1.8% over last year's second quarter. Although it grew faster than the Windows PC market, the gap has narrowed quite a bit. The following graph shows the growth of the two members of the computing Ancien Régime.

    We have to wait a few more quarters before we can decide whether the Mac will enter a new phase of diminished expectations. Although it's not immune from the impact of the iPad, the effect can take a long time to be evident and in either case, growth can come from conversion of Windows users which vastly outnumber loyal Mac users who might upgrade.

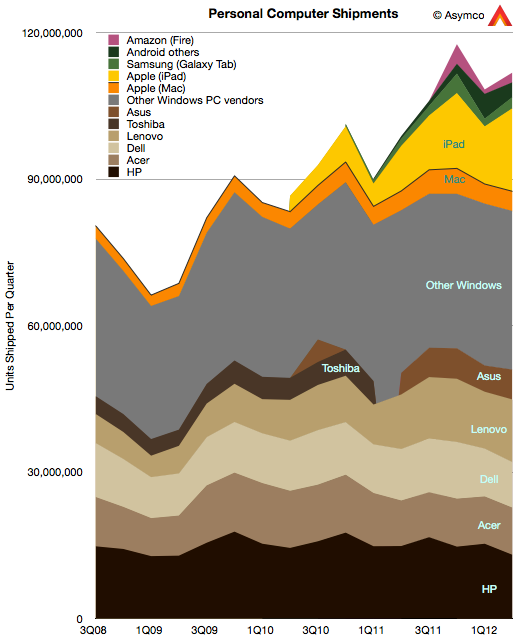
    If we see the computing market as the superset of keyboard+mouse input and touch-based input then new computing consumption becomes easier to spot:

    Seen this way, rather than there being a crisis in personal computing, we have a renaissance. And as in the actual Renaissance, it's a volatile and unsettling period.

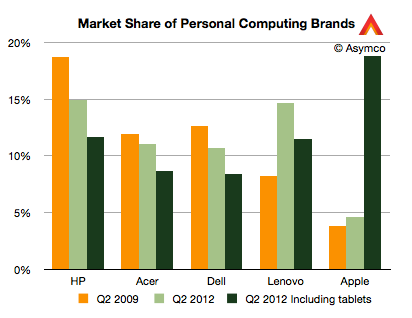
    Nowhere more so than in the changing of bases of power. Consider the following data:

    A change in perspective leads one to conclude that Apple is the new leader in selling personal computers. Maybe this charting is putting too fine a point on it, but the data is beginning to make evident that which has been perceived subjectively by only a few.

  8. Asymmetric Competition

    Research · 57 comments

    Thanks to Angel Lamuno for sending me to a dry and boring lecture by Dr. Israel Kirzner from Feburary 1988. It got me thinking again about competition and how confusing it can be.

    The lecture was in part about how the word "competition" is used by economists with directly opposing meaning from that of the layman and how that leads to confusion about the role of free markets.

    I won't dwell on that, but instead I want to explain how this word can also be contradictory in meaning when applied in everyday usage in business analysis. Nowhere is this more evident than when we argue whether Apple competes with X or Y or Z.

    Does Apple compete with Android or Google or Samsung? How could Apple compete with Google and yet cause it to be the default search engine in Safari thus enriching their competitors? How could Apple compete with Samsung and yet select their semiconductors for the heart of its most important and profitable product? And how could the people across the table from Apple agree to terms on these deals while being sued by them?

    Some have tried to characterize this situation as "coopetition" or the co-habitation of conflicting strategies for a balanced optimum. I find this characterization uncomfortable and unsatisfying. The balance sought will be very fragile and change daily and no optimization is practically possible. It seems contrived.

    Rather, I think about these situations as examples of asymmetric competition. This is competition where companies are rivals but they have different definitions of the basis of competition. In a way, they are like gladiators who have weapons which cannot be brought to bear or wielded effectively to counter the opponent's.

    Consider the following question: does the iPhone compete with the Galaxy SIII? Well, obviously it does. The products have similar attributes. If we define competition as rivalry in a market for similar products then, by default, they compete.

    But what about non-consumption? What if there aren't enough of either product to go around and people cannot actually face a purchase decision where both products are in front of them at the same time, under identical terms and conditions, waiting for a purchase to be made.

    It gets worse. What if there are network effects related to each product such as brand loyalty, platform switching costs, media and data tied to either one that make them impossible to switch? What if advertising spending is skewing the buyer's knowledge of competing products?

    If a product is unavailable, invisible or requires burdensome switching, does it really compete? When these exceptions are raised, you'll hear people say that Apple (or Samsung) don't compete with X or Y. They compete with themselves or with products outside the category. There may be many ways of rationalizing that  what appear to be similar products don't compete because of "differentiation" or "positioning".

    In fact, jobs-to-be-done theory suggests that the only successful competition is against non-consumption, especially if you're an entrant. Non-consumption is easy to beat (because the alternative is no solution to the job) while an entrenched incumbent is very difficult to beat, and it's often inefficient to even try even if you have the resources. This is what I describe in talks as the "David vs. Goliath" approach vis-à-vis the "Charge of the Light Brigade" approach.

    So the theory that competition exists on the de-facto basis of a similar feature set fails a whole series of tests in the real world. Consumers decide based on complex criteria and businesses actually conspire to make the choices as complex as possible reducing the decision to a single option.

    But I want to step back and think about the situation from the competitors' point of view. In other words, how should management think about competition? Is it possible to develop a competitive strategy or should one even bother with competitive response?

    Let's take a basic question: Does Apple think of Samsung as a competitor? When did it begin to think about it as such? What can it do to win?

    Let me answer this by asking another hypothetical question. Assume it's 2008 and Apple is in the process of planning its product roadmap. Whom would they decide to count as competitors? Android devices have not yet shipped and the gorilla in the space is the BlackBerry with Symbian still overhanging the market with a huge volume lead. Should they then build products to compete with RIM and Nokia?

    Assume further that their decision will define how developers will build apps and content makers will target your product. They have to account for the time scales that developers think about and they have to match hardware innovation to the rate of OS innovation and API innovation and toolchain innovation, etc.

    So did Apple consider Samsung a competitor in 2008? A time when Samsung did not actually make smartphones? It seems hard to believe they did. Now you may answer that things have changed since 2008 and they have. But the decisions made in 2008 regarding the platform remain in place today.

    Furthermore if you happen to look at the dozens of hardware designs that are making the rounds today (as evidence for a trial with Samsung) you'll see familiar designs first penned in 2004 or 2006. You quickly realize that the product design process is lengthy and largely isolated from the froth of main street (or mall) sales fistfights.

    Few people appreciate the disconnect between the design process and competition. This because few people have spent time in an organization building mass market consumer phones. The time scales are staggering. If your product is a platform product you make decisions six years in advance. If you are a "fast follower" you can make decisions six months in advance. This is maddening, asymmetric competition.

    One competitor sees one basis of competition and another sees it completely differently or sees a completely different basis. They are competing with each other but more as a guerrilla fighter competes with a nuclear missile.

    Which brings me to another discipline. In military circles asymmetry has been noted as a valid form of warfare for some time. At least since 1975. It was in use long before it was recognized or studied, (e.g. in the American Revolution.) But the situation now exists where it's taken for granted that modern conflicts are almost always asymmetric. Drones vs. insurgents and citizens vs. armor and, the most sinister of all, unarmed-but-tightly-integrated-through-communication protest against established regimes. The impact of this realization is affecting governments around the world.

    So it's time to elevate our thinking about business competition along the same lines. Yes, Apple competes with Samsung but it does so asymmetrically (as it does against Google and dozens of others). It's a multi-dimensional rivalry and one which requires a different form of analysis. It is something which I do instinctively but it's not something that is easily explained. Disruption theory helps. It turns out that asymmetric competition is the only form of competition that matters in a rapidly disrupting industry.

    It is also why this site is called Asymco.

  9. Estimating third and fourth quarter iOS shipments

    Research · 47 comments

    In the 2011 Annual Report(10K) published October 26th Apple states:

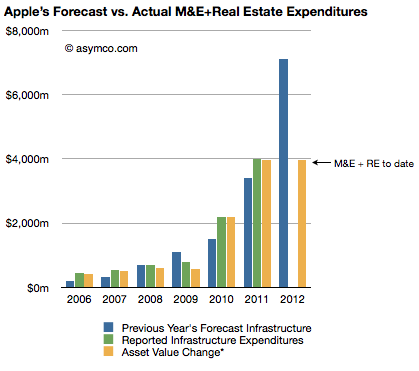
    The Company anticipates utilizing approximately $8.0 billion for capital expenditures during 2012, including approximately $900 million for retail store facilities and approximately $7.1 billion for product tooling and manufacturing process equipment, and corporate facilities and infrastructure, including information systems hardware, software and enhancements.

    The history of these expenditures is shown below (the blue bars are statements from 10K reports including the one above shown as the right-most bar):

    Three 10Q reports so far this fiscal year have given us updates on asset values and the change in these values are shown as the right-most yellow bar. The asset value change suggests $3.9 billion has been spent so far of the $7.1 billion budgeted. Thus we can estimate that about $3.2 billion remains to be spent in the fourth fiscal quarter (thus bringing the yellow bar to parity with the blue bar in the chart above--a parity that was achieved or exceeded for five out of the last six years).

    Assuming $200 million of the fourth fiscal quarter budget will be for land and buildings[1] results in an estimated $3 billion remaining for product tooling and manufacturing process equipment and data centers.

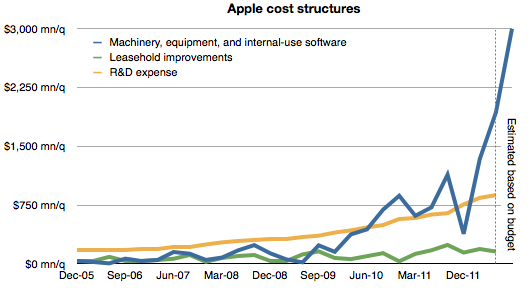
    The history of spending for various cost centers is shown below.[2]

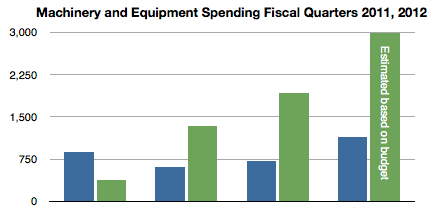
    Note again the forecast for the fourth quarter based on budget given last October. Also shown below is the spending on machinery and equipment by quarter for the fiscal years 2011 and 2012 including the estimate for FQ4 2012. (Blue bars represent 2011 quarters and green represent 2012.)

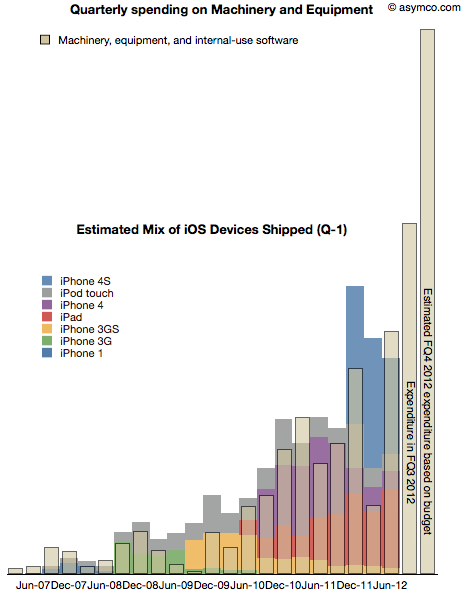
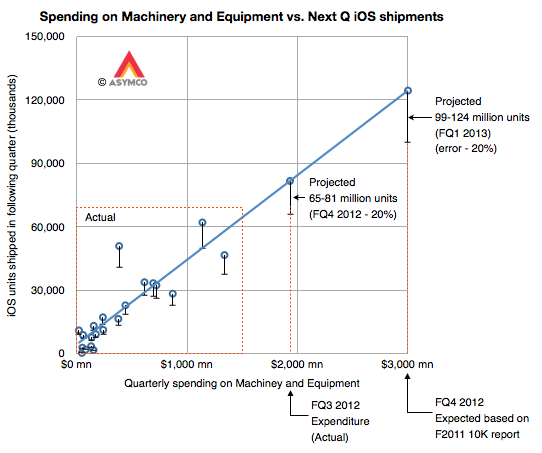
    As discussed previously, spending on machinery and equipment has shown a strong correlation with the output of iOS devices in the following quarters. The following chart shows the superposition of M&E spending in a given quarter and iOS output in the following quarter.

    Note that due to the time-shifting the Expenditure for FQ3 does not have a corresponding output--expected in FQ4--and that FQ4 expenditure is estimated based on budget.

    With this data in place, we can now begin to answer the question of what are the total iOS device shipments expected in the current (ending September)  and the following (ending December) quarters.

    Our eyes are pretty good at seeing patterns in data so perhaps it would suffice to know the scale to the graph above and thus fill in the colored output bars to match the spending. But to make it a bit more precise, I drew the following chart:

    It shows the same data but as an X-Y scatter plot where the X axis is quarterly spending and the Y axis is iOS unit shipments. Note that the actual data points are in the lower left area delineated with a dashed red rectangle.

    I drew the blue line corresponding to an assumed linear relationship between the two variables to project the iOS output based on additional expenditures for FQ3 and FQ4.

    I used error bars of -20% to show a possible conservative range.[3]

    This yields an iOS output of approximately between 65 and 80 million units in the current quarter and 100 to 125 million in the fourth calendar quarter. The sum of the low ends of this estimate is 165 million units.

    My current forecast is  53 million units in CQ3 and 110 million units in CQ4 which, together, add up 163 million. Close enough.

    Stay tuned for a padcast report with more details on this approach.

    ---

    Notes:

    1. The company spent $31 million, $66 million and $159 million for the first three quarters on Land and buildings. $200 million in the fourth quarter seems reasonable unless there is a pending large land deal closing in the next two months.
    2. I added leasehold improvements as a proxy for store openings and R&D expense as a proxy for overall product development. These are in contrast to expenditures for product production and support which are represented by Machinery and Capital Equipment.
    3. Note the other data points' error bars
  10. Apple's growth scorecard for the third fiscal quarter 2012

    Research · 90 comments

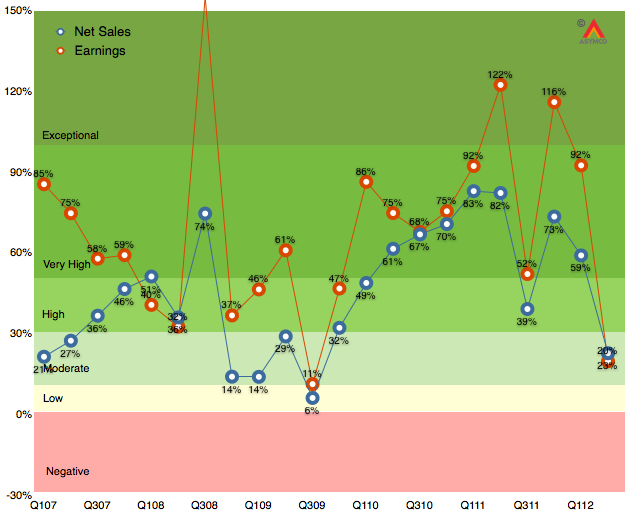
    As the following revenue growth table shows, the second calendar quarter of 2012 was not like the recent past.

    The bottom line growth (earnings) is the slowest since Q309 which had a difficult comparison with Q308 when the iPhone 3G launched and saw 800% iPhone growth. This past quarter also had a difficult comparison with 150% iPhone growth a year earlier and 122% earnings growth.

    This is shown in a different way in the following graph:

    Growth is sometimes victim to difficult comparisons and sometimes the launch of products comes late or early in a particular cycle. This quarter was a mix of multiple factors that went the wrong way:

    1. iPhone did not get expanded distribution and was stale late in its cycle. Emerging market traction outside of China still elusive.
    2. iPad is not getting volume purchasing from institutions and spring is not an ideal launch quarter for consumers
    3. Mac portables missed a few weeks of sales due to lack of Intel components
    4. Some signs of macroeconomic slowing especially in Europe and countries dependent on commodities exports.

    The silver lining is the return of higher growth to iTunes store and peripherals. These are "hobbies" for Apple but they might form a foundation for significant new opportunities in the years to come.