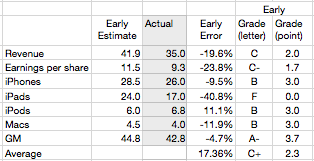
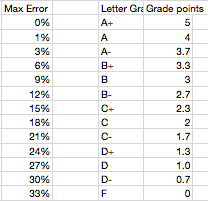
The table below shows the scores for my various estimates[1]
Last quarter I managed a B+ overall but this quarter was a C+. The iPad estimate was a complete failure mitigated slightly by a, directionally at least, correct call on the iPhone. The failure on iPad dragged down revenue and EPS while the accuracy on iPhone improved the gross margin. iPod and Mac estimates were consistent with recent performance.
The error on iPad is a harsh lesson which shows how the category is still unpredictable. With only four quarters where we could measure y/y growth, and with those quarters showing 183%, 166%, 111% and 151% growth, I assumed that the 150% growth was sustainable.
That turned out not to be the case. The iPad slowed to 84% unit growth and 51% revenue growth. It's perhaps unrealistic to expect 150% growth for more than one year. This is the main learning for the quarter and I will adjust my expectations accordingly. Overall, the product has sold 84 million units since launching in early 2010. I now expect it will sell approximately 80 million this year and 150 million units in 2013.
In my last podcast (Impatient for Growth) I mentioned my frustration at Apple's slow entry into emerging markets outside of China. I cited Tim Cook's comments that he did not see an opportunity there in the short term. He mentioned the multi-level distribution challenge which I took to mean the difficulty in setting up Apple stores (in itself due to restrictions on foreign owned retail chains) and the absence of device/service bundling.
This requires more analysis and the best place to start is to look at the data available.
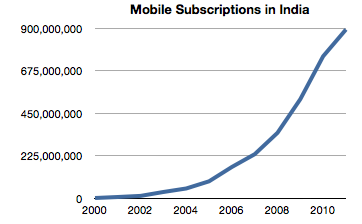
The market potential is enormous. Globally, there are 6 billion mobile cellular subscriptions (end of 2011, ITU) and 86% penetration, but only 1 billion have mobile broadband subscriptions (which make ownership of a smartphone worthwhile). In India there are 893 million subs (vs 986 million in China).
In 2011 142 million mobile cellular subscriptions were added in India, more than in the Arab States, CIS and Europe put together.
So the potential and growth are spectacular. But that is just 2G. Mobile broadband (i.e. 3G) is rare. Globally, developing countries have only 8% mobile broadband penetration vs. 51% in the developed world. Mobile broadband is a proxy for mass adoption of the iPhone (though perhaps not for Android inasmuch as it's employed as a feature phone).
The situation for 3G in India is even worse than the overall developing world. 3G licenses were only first awarded at the end of 2010 and the process was fraught with allegations of corruption. In the year and a half since, there came to be an estimated 10 million HSPA connections in the country.
The potential therefore is huge but the timing is difficult. Analysts are projecting 100 million mobile broadband connections by 2014 and over 350 million by 2016. Apple can affect this rate of growth as it's not only enabled by the network roll-out but can affect the take-up rate by consumers.
It's a chicken-and-egg problem. No network means no devices but no devices may mean the network cannot be paid for. In the initial phases, the economics of mobile broadband are still dominated by the incentives for operators to pay for the infrastructure rather than for consumers to pay for the service. The iPhone will have a role to play and the question is whether 2014 or 2016 are the dates when Apple will be able to claim that they've cracked the India code.
This episode is recorded on the day after Apple's second quarter earnings release. We go through all the income statement updates and discuss what went wrong (almost everything) and what went right (precious little). We use statements by management about India to answer the question of where the emerging market potential is for iPhone. Putting aside some of the missed opportunities or bad timings, the quarter is reviewed as less than the stellar performance we've become accustomed to but not bad all things considered.
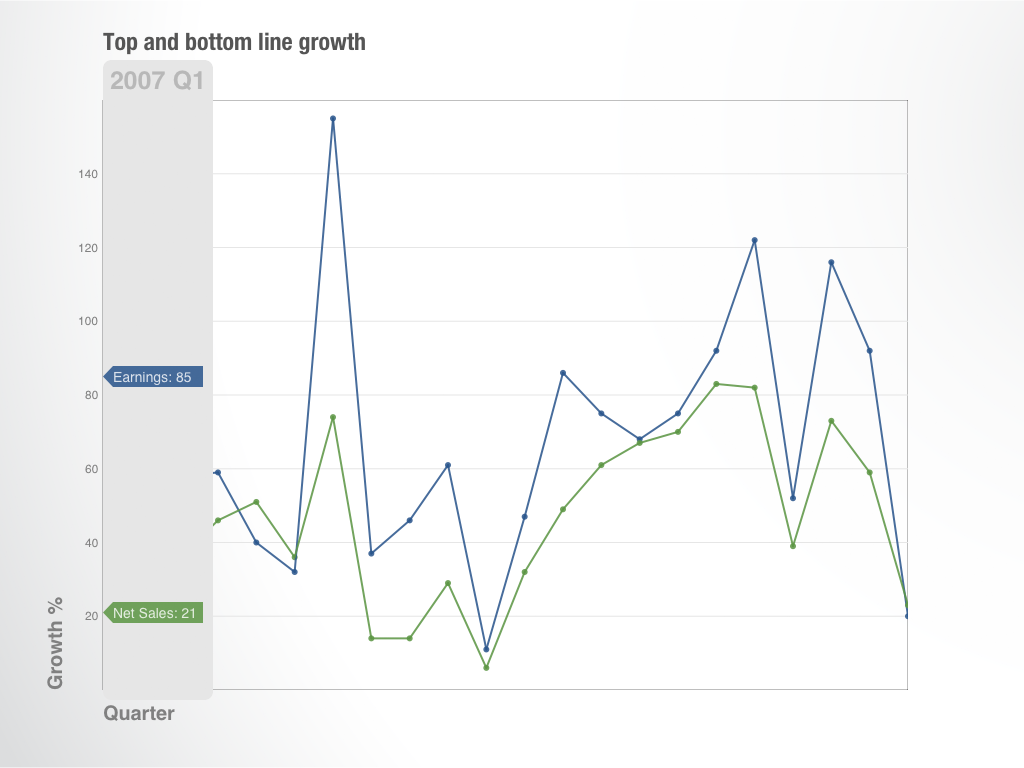
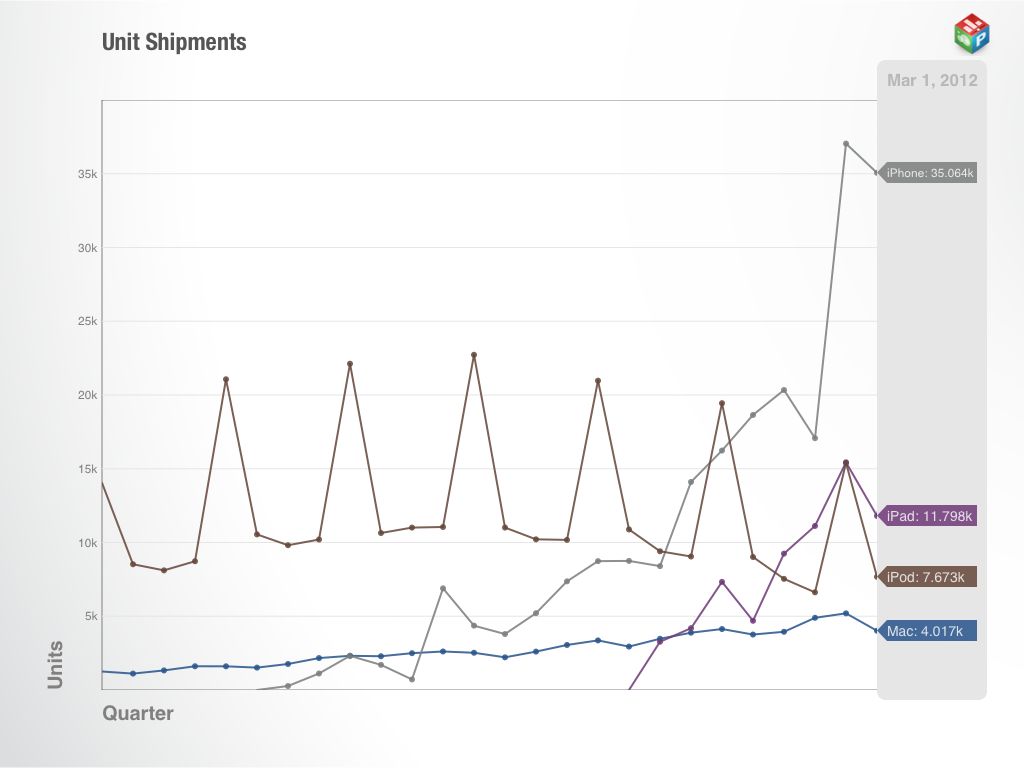
In anticipation of the earnings release tomorrow, I prepared a iPad-enabled audio-visual chart-based discussion of my expectation for product-level performance.
I discuss six topics in a historic context and the reasoning behind my expectations for the just-ended June quarter:
Units by product line
Unit growth
Gross Margin percent (profitability) by product
Pricing power in terms of revenue per unit sold
Contribution to revenues for each product
Contribution to margin for each product (i.e. profitability)
The discussion is packaged as a "padcast" which means you need to have an iPad and the Perspective App available on the iTunes App store in order to view the content.
My thanks to Adam Lashinsky of Fortune for inviting me to Fortune Brainstorm Tech in Aspen this week. I was asked to participate in a panel session with Gene Munster of Piper Jaffray to discuss "The Future of Apple". The session was moderated by Adam.
The US is a crucial market for both Nokia and Microsoft's strategies. This importance was highlighted during the launch at CES in January when not one but three CEOs (Microsoft's Steve Ballmer, Nokia's Stephen Elop, and AT&T's Ralph de la Vega) were on stage to launch the Lumia. Knowing how well this strategy is working would be very useful to understanding how this market behaves.
My first take on this was when I asked the question How many Lumia phones were sold in the US? The answer suggested through the combination of survey data from Nielsen and comScore[1] was 330,000. The figure is quite small compared to expectations. As it's so extraordinary, it should be supported by good evidence. Unfortunately the methodology used is weak. The figure itself is probably close to the margin of error of such sampling techniques. It would be nice to have another way to calculate this.
Today Nokia offered another set of data which might help determine how many Lumia phones were shipped in the US. (Note the shipped versus sold distinction. Companies report shipments while surveys nominally measure consumption or usage.)
Unfortunately, Nokia did not offer specific data on US shipments. What they did offer was:
Global Lumia shipments were 4 million in the last quarter
Global average selling price was €186 for a Lumia phone
North American[2] phone shipments were 600k. This includes all phone types and all operating systems.
North American sales were €128 million.
That's all we have. So how can this help with the question of US shipments?
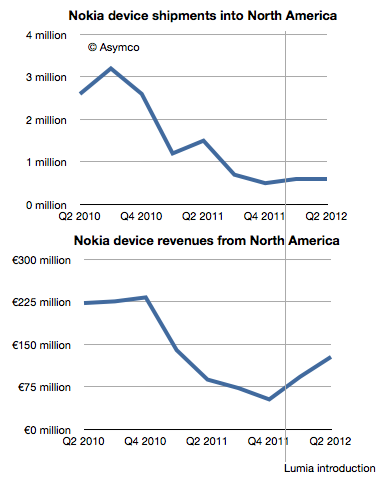
As often happens, it helps to look at the data historically. The following charts show North American shipments and sales with the Lumia launch date highlighted.
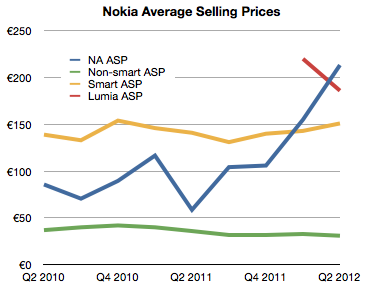
While unit shipments were flat, revenues increased significantly. This suggests that we could plot the average selling price of phones in North America (NA) specifically. I did that in the following chart:
Here the effect of Lumia is clear. The average revenue per phone in the US (blue line) jumped dramatically after the launch. So much so that it actually overtook the average global ASP for Lumia.
What we need therefore is a way to estimate the "mix" or percent of smart and non-smart phones sold into North America and derive perhaps the US portion of that and then finally try to separate the Lumia from all the smart volumes.
To help, I plotted the historic ASP for Smart and non-Smart devices as provided by the company.
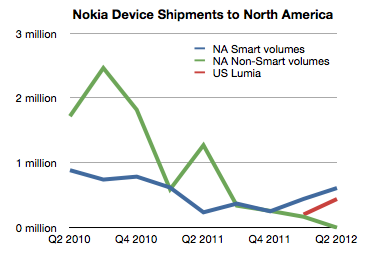
Using a simple formula[3] it's possible to derive the mix which is shown as Green and Blue lines in the following chart.
Getting estimates for smartphone shipments (blue line) is pretty close to Lumia shipments, but we still have to correct for US/Canada split (estimated at 90:10) and Symbian/WP split among smartphones (estimated 50:50 in Q1 and 20:80 in Q2).
The result is the red line showing US Lumia shipments. The sum of the two quarters then comes to 630k.
This is nearly twice the estimate from consumer survey data however I would not draw too many conclusions from this. Mainly because there are many assumptions place in both estimates, but also because there is the distinction between shipments and usage.
However, it might be safe to say that US install base is somewhere between 400k and 1 million users. Is this good or bad?
It's good because it's progress and there is some growth. It's bad because it's frightfully small relative to the competition. Nokia itself acknowledges the challenge and states that "We believe the Windows Phone 8 launch will be an important catalyst for Lumia."
It seems that what Nokia needs most today is time. That is a very expensive asset. Perhaps infinitely so.
---
Notes:
A practice neither company would condone, principally because they are competitors, but also because they use different sampling methods.
North America I take to mean US and Canada. Although geographically, Mexico is part of North America it's usually grouped as part of Latin America as a category. I'd like to get this confirmed.
There are a few implicit and explicit assumptions: (a) Global ASPs are roughly comparable with NA ASPs but (b) smartphone ASPs are higher in NA by about 30%
We cover the valuation question regarding Apple and tech in general as seen through investors' eyes. This discussion ranges a bit on P/E compression and the psychology of investors--which might change with Apple TV.
We also look at who is most vulnerable in the ongoing mobile computing disruption and who are the up-and-coming challengers. Finally, I introduce the Perspective app which I used for all my live presentations.
I'll post more about Perspective in the future as it will be my platform for publishing complex or rich data.
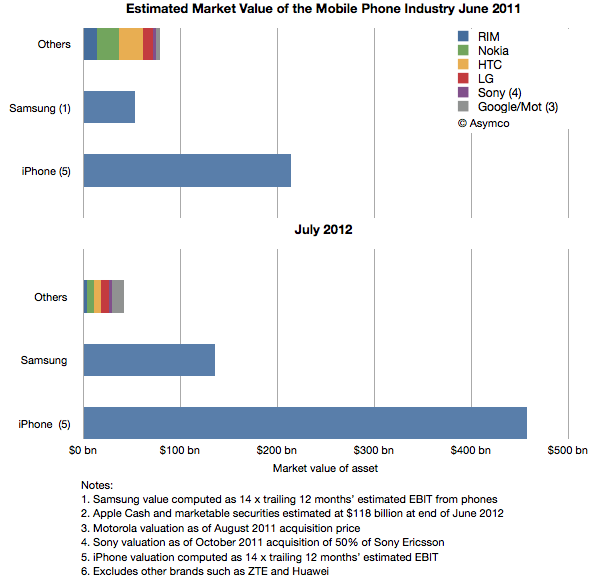
A year ago I noted that Apple could buy most of the mobile phone industry with cash on hand (excluding Samsung's operations).
Since then Apple's cash has grown significantly and the value of all phone vendors except Samsung has gone down significantly. The following chart shows the year ago and present day estimated market value of the industry participants.
Phone brands other than Samsung and iPhone have seen a reduction in market value of a combined 47%. That's actually being quite generous since I'm valuing Motorola and Sony's businesses at their acquisition prices. The operations of both those companies have continued to stagnate.
Based on the same multiple of estimated earnings Samsung grew its value by 157% and iPhone by 114% (note this excludes iPad).
In absolute terms the iPhone franchise created $244 billion in value while Samsung created $83 billion. The others destroyed $37 billion.
The good news is that the industry has had net value creation--always a healthy sign that innovation is being valued and absorbed.
The bad news is that there is vast income inequality. The rich are getting richer and the poor are getting destitute. This is an unhealthy sign. The concentration of power and wealth may indicate a peaking of experimentation and discovery of new opportunities.
Also noteworthy is that almost all the value from the Android ecosystem is concentrated in Samsung. I did not include Google in this analysis since its mobile is so small as to be not visible in its accounting. A separate analysis of Android economics shows that Google's benefit from the platform is modest. In contrast, Samsung, and Samsung alone, is benefitting greatly. It could even be said that today Samsung is the only Android profit engine.
Nielsen and comScore survey US consumers through different methodologies, however they both try to paint a picture of the smartphone patterns of ownership and consumption.
I regularly report on comScore's data as it's published on a monthly basis. Nielsen offers updates on a quarterly basis but there is more detail.
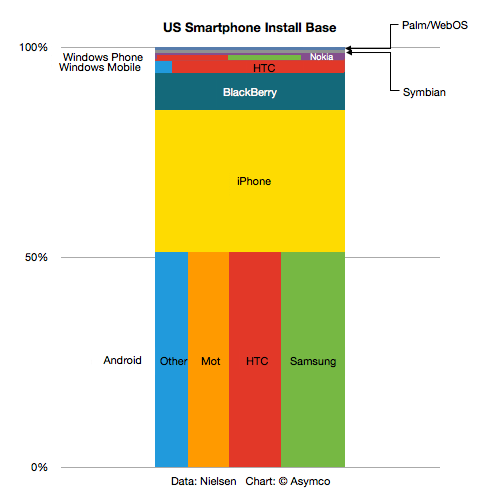
The latest report (for Q2) shows smartphone shares by both platform and vendor. The following graph is a treemap built with the Nielsen data:
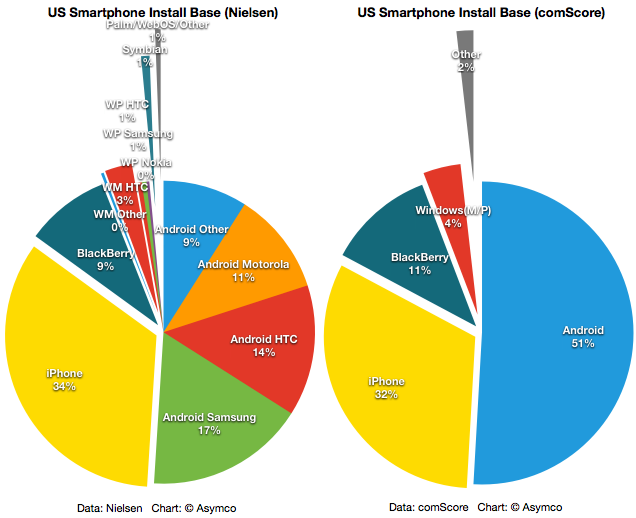
The same data is also plotted below as a pie chart:
I also added the latest comScore mobiLens data in the pie chart to the right.
Note that both surveys agree in the main on the largest platforms. The difference seems to be within a reasonable margin of error. The details available in the Nielsen data are perhaps also interesting. The various Android OEM shares as well as the division between Windows Mobile base and Windows Phone (7) base could provide some insight. Nielsen's total Windows base adds up to 4.5% while comScore reckons on 4%. Within that total, Nielsen breaks out 3.2% for Windows Mobile and 1.3% for Windows Phone. Within the Windows Phone total, HTC and Samsung are shown as having 0.5% and Nokia 0.3%.
If we then use comScore's figure for total smartphone users (110 million) then the data would suggest that there are 330k Lumias in use in the US. This would have been accummulated over a sales period of about four months.
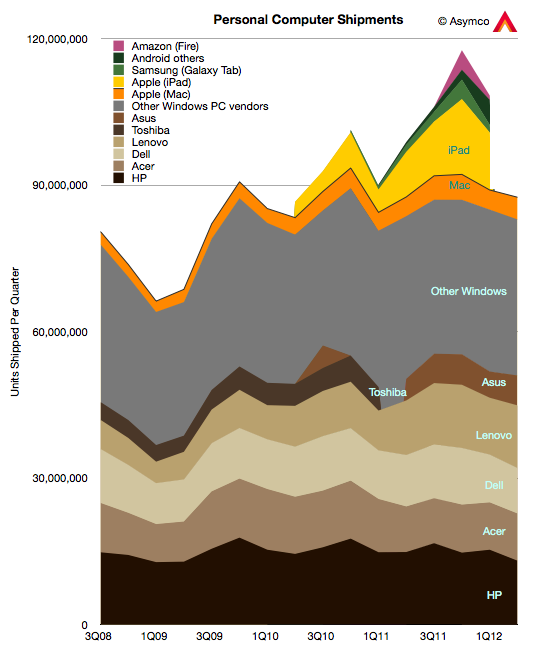
Gartner has published preliminary PC unit sales for Q2. The data from Apple's Mac sales has not been published yet but based on some estimates, we can draw a partial picture of the personal computer market.
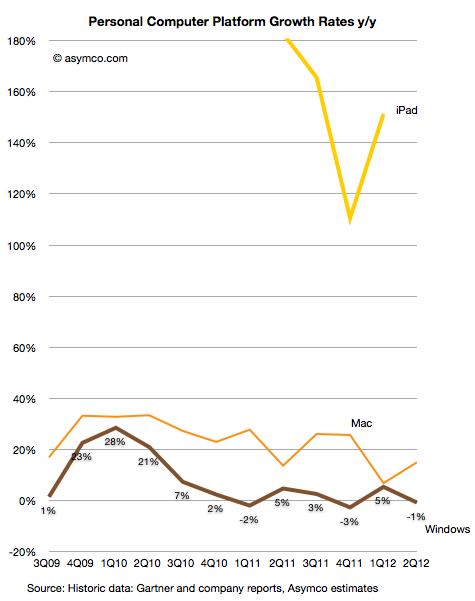
My estimate is that the Windows PC market fell by 1% while the Mac market grew by 15%. Gartner reports an overall flat market. I'll leave out the iPad for the time being, and show the growth of the Mac vs. Windows:
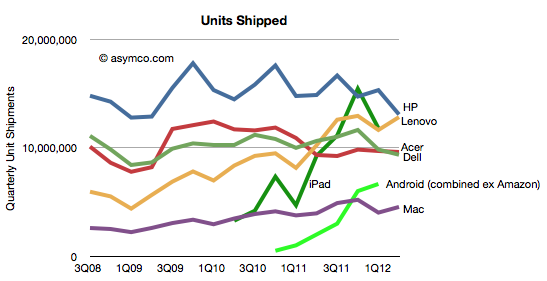
In terms of individual vendors vs. each other, the patterns are as follows:
It's perhaps a bit early to tell, but if the Windows PC market continues to slow or contract, it may be possible that HP and Dell will cede their market share leadership positions to Lenovo and Acer. Already "Others" account for as many units as HP and Dell put together.
If we are to believe the analyst community reflects consensus, the industry, in the aggregate, continues to treat the potential for disruption from devices as unlikely. There always seems to be a wrinkle, a quirk, or an exceptional circumstance that is to blame. I won't get into all the excuses given by analysts for the slowing of PC sales but will point out that there's been a series of initiatives put forward by the industry to act as "catalysts" for growth. So far they have not worked. The current expectation is that Windows 8 will reverse this trend.
Perhaps. But perhaps the relief, if it comes at all, will be temporary.
[UPDATE: Due to a data error, the drop in Windows was overstated in the initial version of this post as 10%. It's been corrected to a drop of 1%]