Asymco

Asymmetric Intelligence

Horace Dediu

  1. The face and the brand

    Research · 72 comments

    In the five years since the iPhone launched, Apple created a total of 35,852 retail jobs.

    Some of those jobs came from new store openings. The total store count went from 172 to 361, more than doubling. But the growth in employment was faster: from about 6400 to 42,200, more than quintupling. This is reflected in the total number of employees per store which increased from 37 in Q1 2007 to 117 in Q1 2012.
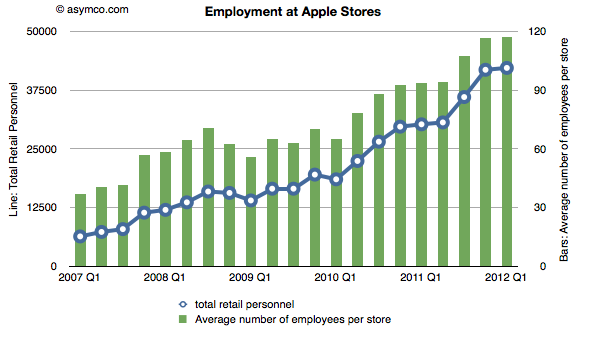
    Which brings up an obvious question:  Why did Apple triple employment at each store? One could answer that many of the newer stores are bigger, so-called flagship stores. But the vast majority of stores are in mall locations which are of limited size. Flagship stores alone cannot account for the increase. One could also suggest that perhaps the stores are open longer and there is a need for more shifts. Again, the vast majority of stores are constrained by the opening hours of malls which, as far as I know, have been steady. Anecdotally, it's also evident that there are more employees in a store at a given time. There are many more of those colored T-shirts at first glance.

    One hint is in the design changes in the stores. Apple has removed shelving, registers and almost all non-Apple merchandise. It has replaced the visible stock with tables on which rest products that can be used. If there weren't any people in the store, the store would look almost completely empty, just an open space.

    But that's the whole point. The stores are designed to be filled with people. The stores have an open layout because it allows more people to be inside the store at the same time. And the more people the more employees.

    We have the data to prove this: The visitors per store per quarter increased from 125k in Q1 2007 to 235.5k last quarter. Nearly double the number of visitors in five years. It's this increased traffic that is closest tied to the increase in employment. This is illustrated by the following chart:
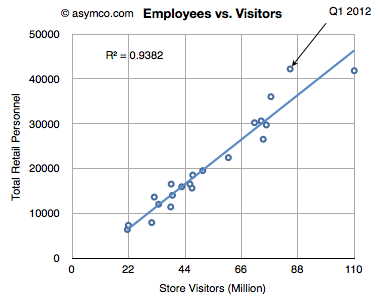
    Employment is very closely correlated with total visitors. In fact, employment has risen faster even than visitors. By dividing the number of visitors by the number of employees we see how the number has declined.
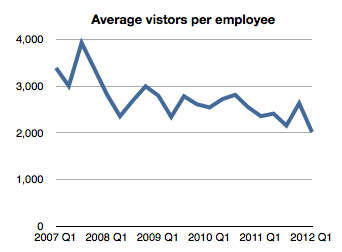
    [If we consider the time an employee spends working we can even guess that the average visit was served by about 14 minutes of employee interaction--this is up from 9 minutes five years ago.]

    If we assume this relationship as causal, then it might be that the stores are "tuned" to ensure a reasonable if not pleasurable experience for the visitor. In other words, the proxy for a "quality" experience is the assistance of an Apple retail employee.

    Taking this a step further, we can perhaps hypothesize that Apple is treating its retail stores as hired to provide a human touch to its products--not just as a service but as a way to listen and help in the most basic way. Steve Jobs once said that Apple no longer had to be present at trade shows because they have millions of conversations with their customers every day through their stores. These conversations happen with the retail staff.

    Through their Apple retail staff, Apple might even be said to be putting a face on their brand. You can see it in the advertising.

    The corollary to this would be that the job of the store is not primarily to sell things. This is confirmed by the fact that store employees are not on commission and there is no sales pressure on visitors. Indeed, the sheer number of employees in a store of modest size (117 employees on an average of about 8k sq. ft.) implies a brazen disregard for the economic orthodoxy of retail efficiency and incentives to sell.

    And yet the stores are astonishingly efficient at selling things. The statistics are off the charts in terms of sales per square foot and overall profitability. Even though this employee time has a cost, revenues and profits have all risen in unison.[1]
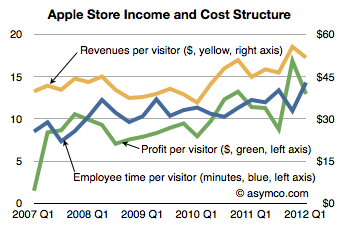
    Of course, the products have a lot to do with this performance. Apple stores sell desirable, popular products which are premium priced. But taking these desired products and coupling them with a "human touch" job to be done strengthens the brand as well as expands its volume of sales. It may be that Apple's retail approach could not work with a brand that was less desired. I.e. regardless of a large head count, a Sony store may not see the return on retail investment that Apple gets. Conversely, by not putting a face on Apple's brand the products may not sell quite as briskly. Ron Johnson said on the launch of the iPad that the stores were almost designed for it. Discovery and hands-on time create demand.

    It's as if Apple retail has an inter-dependence with Apple, the brand. One cannot live without the other.

    This is, as far as I know, a unique relationship for a technology company. If anything, most technology companies have sought the exact opposite: to put others' faces in front of customers--to break the messy process of sales and support down into pieces to be outsourced to "value adding" resellers.

    A pity then that this humanizing touch takes such a long time to build.

    ---

    Note:

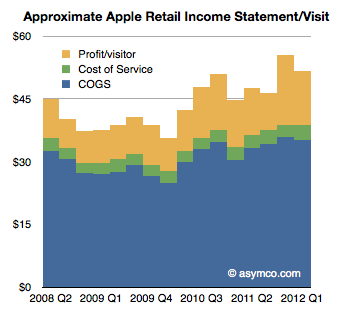
    1. If we take a visitor-centric point of view, the analysis of the retail business simplifies considerably.  We can even derive an "income statement per visitor". Revenues are measured per visitor (currently about $52/visit). Costs are measured in terms of employee time. A $15/hr average wage and 15 min interaction time per visit puts the service cost at $3.75/visit. Profit per visit is also measurable and it's currently at $13/visit. Therefore the employee "FaceTime" costs 7% of sales, while other costs, including the cost of goods sold, add up to 66% of sales.
  2. MacDirectory: Exclusive | Apple's iOS Market Analysis

    Research · 4 comments

    HD: Apps are like the sauce in a dish. They add flavor and distinguish the dish. Increasingly they also offer nourishment. Some would argue that we can live with plain cooking but spices drove people to do incredible things like risking life to discover new continents. Being the world's best source for spices means the most innovative and brilliant minds will be attracted to innovate on top of Apple's platforms.

    Read more of the interview by Markin Abras here: MacDirectory: Exclusive | Apple's iOS Market Analysis.

  3. 5by5 | The Critical Path #43: We'll take it from here

    Podcast · 18 comments

    Horace and Dan look at Microsoft's Surface through disruption colored lenses. First, the ongoing evolution of the computing value chain and how it foretold us of Surface. Second, how the economics of Microsoft's businesses makes Surface compelling. We also begin a new segment tentatively called "Reader Questions". This time it's education: is it disruptable? If so how can we tell and where will it lead us?

    via 5by5 | The Critical Path #43: We'll take it from here.

  4. Who will be Microsoft's Tim Cook?

    Research · 88 comments

    As previously noted, Apple has overtaken Microsoft (and Google) in operating margin percentage. This is an astonishing statistic as Apple is still largely perceived to be a "hardware company" while Microsoft is a "software company" and Google is a "services company."

    To suggest that "hardware" could be more operationally profitable than either software or services is akin to heresy in technology analysis. This reversal is newsworthy indeed. However, even the most casual observer would note that Apple does not derive its market power from hardware alone. It is, in fact, an integrated hardware, software and services company (with a few more roles besides.)

    So the emergent successful business architecture in this technologically transitional period is of integration and completeness of solutions.

    This shift explains at least at a conceptual level Microsoft's tectonic Surface shift.

    But what about another point of view? What does integration mean for Microsoft's income, cost and profit structure? Is integration self-disruptive to Microsoft?

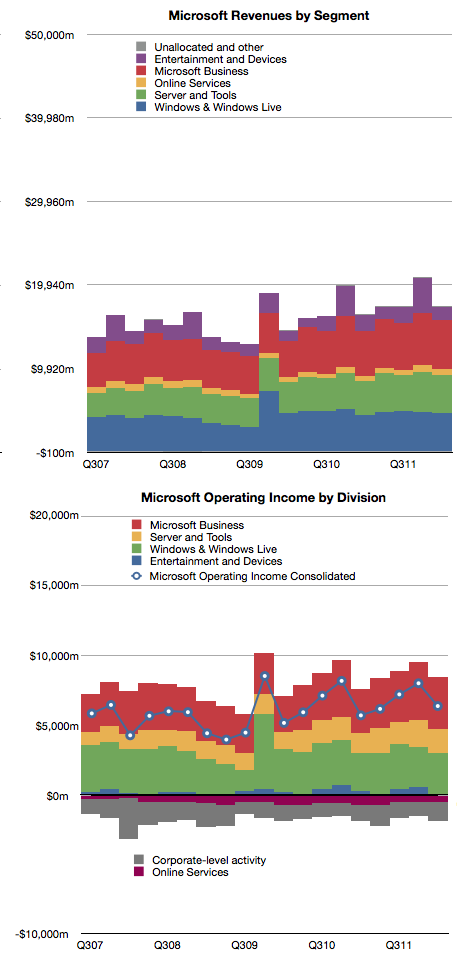
    Here's a reminder of Microsoft's revenues and operating income by division:

    The challenge of devices for Microsoft is that the licensing of software for devices is very difficult to sell.

    In 2011 Microsoft received about $18.7 billion in Windows revenues and $23 billion in Office revenues. The chart shows that this is a fairly steady growth business. According to Gartner, in 2011 there were about 336 million Windows PCs sold and that this too is a fairly stable and mature business.

    If we simply divide revenues by PCs sold we get about $55 Windows revenues per PC and $68 of Office revenues per PC sold [1]. The total income for Microsoft per PC sold is therefore about $123. If we divide operating income by PCs as well we get $35 per Windows license and $43 per Office license. That's a total of $78 of operating profit per PC.

    Now let's think about a post-PC future exemplified by the iPad. Apple sells the iPad with a nearly 33% margin but at a higher average price than Microsoft's software bundle. Apple gives away the software (and apps are very cheap) but it still gains $195 in operating profit per iPad sold.

    Fine, you say, but Microsoft make up for it in volume. Well, that's a problem. The tablet volumes are expanding very quickly and are on track to overtake traditional PCs while traditional PCs are likely to be disrupted and decline.

    So Microsoft faces a dilemma. Their business model of expensive software on cheap hardware is not sustainable. The future is nearly free software integrated into moderately priced hardware.

    For Microsoft to maintain their profitability, they have to find a way of obtaining $80 of profit per device. Under the current structure, device makers will not pay $55 per Windows license per device and users will not spend $68 per Office bundle per tablet. Price competition with Android tablets which have no software licensing costs and with iPad which has very cheap software means that a $300 tablet with a $68 software bill will not be competitive or profitable.

    However, if Microsoft can sell a $400 (on average) device bundled with its software, and is able to get 20% margins then Microsoft is back to its $80 profit per device sold. This, I believe, is a large part of the practical motivation behind the Surface product.

    The challenge for Microsoft therefore becomes to build hundreds of millions of these devices. Every year. Sounds like they need a Tim Cook to run it.

    ---

    Notes:

    1. Microsoft accounts for revenues using deferrals due to Software Assurance pre-payment models for many corporate customers so this figure is not a precise value for each license sold.


  5. The evolution of the computing value chain

    Research · 34 comments

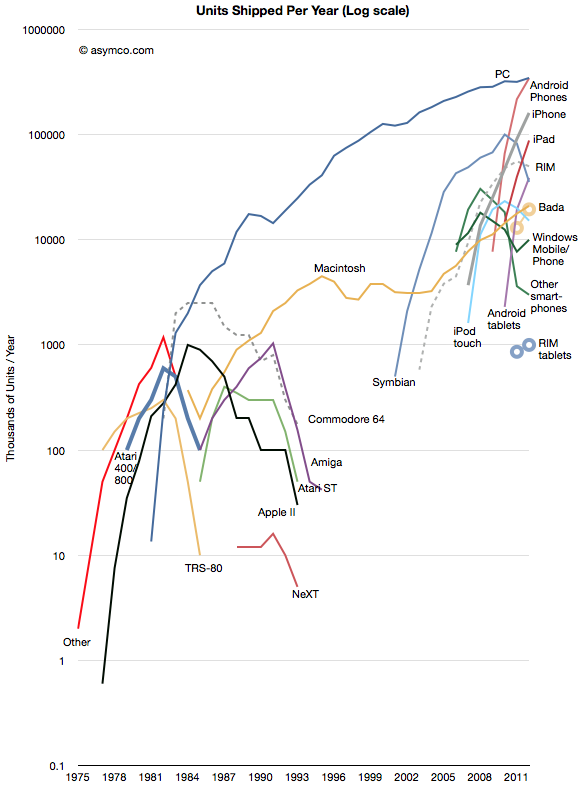
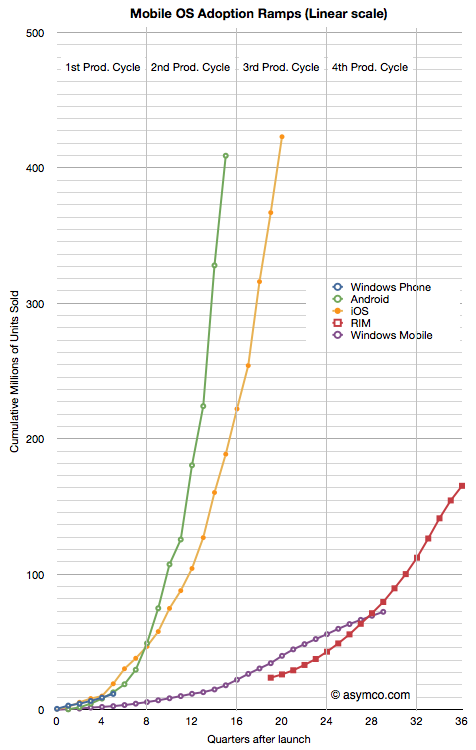
    The history of personal computing has come to be defined as the history of Microsoft. At least since 1981 Microsoft's operating systems have been the consistent market share leaders, and by a very large margin. That is about to change. This year Android will be on more devices sold than Windows. iOS is also set to also overtake Windows next year. The following chart illustrates the wave of mobile platforms that has emerged, and in spite of some notable failures, is overtaking traditional computing.

    Of course we should remember that PC themselves overtook entrenched predecessors like minicomputers and mainframes which themselves overtook business computing systems based on adding machines, typewriters and slide rules. This is the cycle of disruption and there is nothing new about it.

    However, it always seems to take people by surprise. This is because it happens in unforeseen ways and at unpredictable rates. And so it is that we are surprised by Microsoft's seeming abandonment of a business model that has sustained it for three decades.

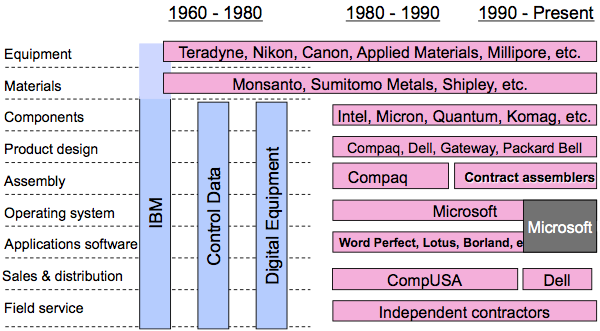
    Yesterday's reveal of Surface, Microsoft's first personal computer, was a watershed event in the evolution of value chains around computing. In a famous slide Clay Christensen illustrated (in 2004) the value chain evolution in computing from the 1960s to 2000.

    As computing moved from the desktop to the pocket the industry re-integrated. First, Apple moved from Product Design into Sales & Distribution with its stores. Then it moved into service with Genius bar. Then it moved into component design with the A series chips and unique batteries. Then it moved into materials with exclusive licensing of LiquidMetal. It also began to own the equipment used in its manufacturing. This in addition owning the operating system.

    Now we see Microsoft following in the same footsteps. First applications came early then stores, then service, and now product design. Google is also tracking closely behind as well with its acquisition of Motorola, the results of which have yet to be revealed.

    And so we can see value chains evolving in real time before our very eyes. They have always evolved but in technology industries they evolve far more rapidly and will continue to accelerate.

    Whether Microsoft or Google will be successful in their integration efforts remains to be seen. The challenges are immense as the value of the existing chains are enormous and the bonds that tie the company to them very strong. Breaking these ties will seem like value destruction and corporate antibodies will be set loose to kill the transitions. HP, RIM, Nokia and Dell are vivid examples of what happens when the response mechanisms have their way.

  6. A more precise measure of Apple's device installed base (and device longevity)

    Research · 43 comments

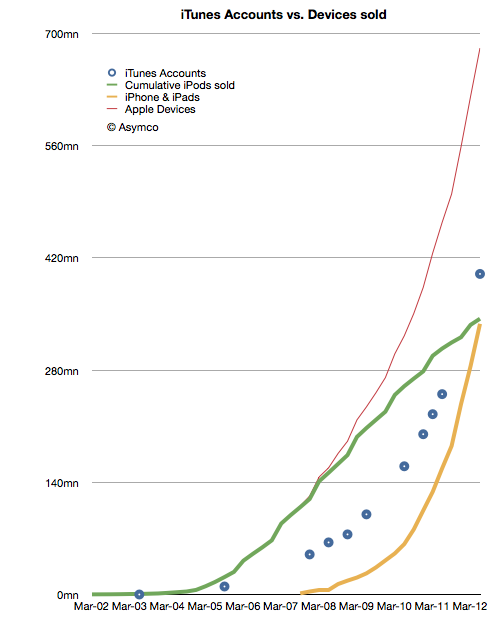
    Apple announced that the total number of iTunes account (with credit cards attached) has reached 400 million. This was touted as being the largest collection of credit card accounts for any retailer and I have no reason to doubt it. However, looking beyond the bragging rights, there are more interesting patterns to observe about this asset.

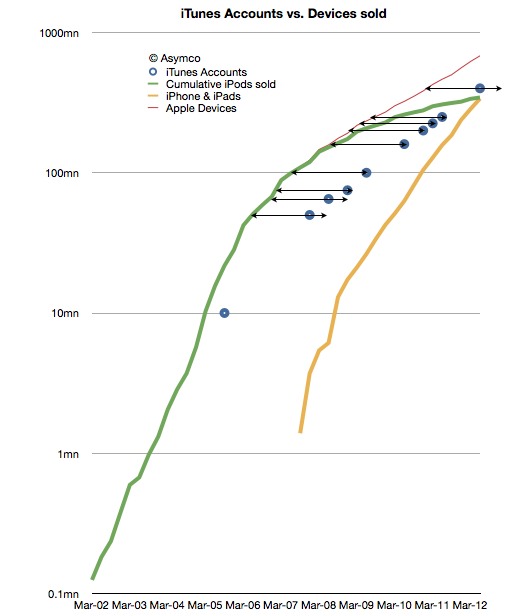
    What I plotted was the cumulative number of iPods sold (green), the cumulative number of iPhones and iPads (yellow), the combined devices total (red) and the reported number of iTunes accounts (blue).

    The first observation is that the combined total iPhones + iPads have overtaken cumulative total iPods. The iPhone started in Mid '07, more than five years after the first iPod shipped. The acceleration in that product line is still evident while the iPod decelerates gracefully.

    The second observation is that the total device count has reached 680 million in the last decade. It's a big number but it is still a number that is dwarfed by the overall device market. Apple is still around 10% of the devices market today. It should give an idea of how many devices could still be sold in the next decade.

    The third observation is the ratio between the iTunes accounts and the total devices sold. Since iPods, iPhone and iPads have been dependent on iTunes, the number of iTunes accounts gives a rough indication of active users. Combining active users with total devices sold should give a rough estimate of the number of retired devices. In other words, if we assume that account holders typically use one device then by taking the difference between devices sold to date and accounts at that point in time we should know how many devices have been retired.

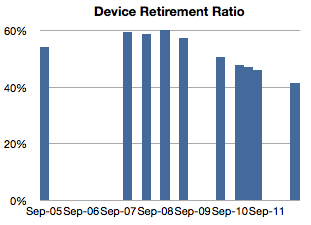
    Dividing that number of retired devices by devices in use should give us the retirement rate and that is shown in the following chart:

    Note that as the iPod was slowing and the iPhone was still a small part of the total, the retirement ratio was increasing. As the iPhone accelerated, the ratio began decreasing and is still decreasing.

    Projecting the retirement rate should give us a way of more precisely estimating  the addressable market for developers, accessories makers, and other ecosystem participants.  Currently that means that about 60% of all Apple's devices sold are still in use. We can tune that figure upward in the next few quarters and make better estimates as Apple releases their shipment data.

    The iTunes account data is not just a way to calibrate addressable markets but also a valuable method for measuring device longevity. The distance between the red line and the blue happens to be nearly a constant 8 quarters as shown in the following chart (note change to log scale for the vertical axis).

  7. Update on Android growth

    Research · 24 comments

    In February of this year MediaTek introduced an ARM chipset for Android smartphones targeting $160 end user pricing. I've heard estimates that this chipset will sell in the "hundreds of millions".

    The question is: are these units going to be "activated" as per Google's definition of Android?

    Historically, MediaTek's chips have been used in "grey market" devices. These are typically copies of branded phones and are sometimes shipped without IMEI numbers and hence not even sanctioned by regulatory authorities. If hundreds of million of such Android devices are sold in the next few years then tracking Android will become even more difficult.

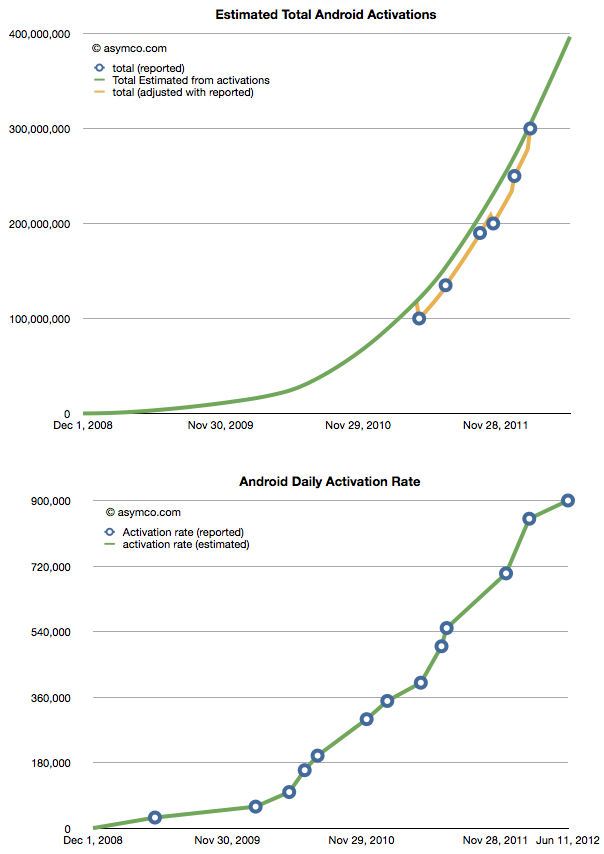
    The current total is difficult enough. We just received an update on the activation rate (900,000 per day) and that allows us to create a picture of total cumulative activations.

    We still don't know the retirement rate so these are not devices in use, however most of these devices have been sold in the last two years implying they are (nominally) still functional. The following chart shows the ramp overlaid with an estimated 24 month product life cycle.

    The one million per day Android activation rate has probably already been crossed with all the unsanctioned versions of Android available today. What will be the rate once the MediaTek chipsets are in wide distribution?

  8. Are revenues per app decreasing?

    Research · 22 comments

    Apple has been releasing data about payments to developers with increasing frequency. Last week's $5 billion announcement was the fifth such update and came after about one quarter since the last.

    Knowing the payments to developers and the cumulative download count allows us to get a very accurate revenue point for each download. As the frequency increases we can observe growth and seasonality patterns.

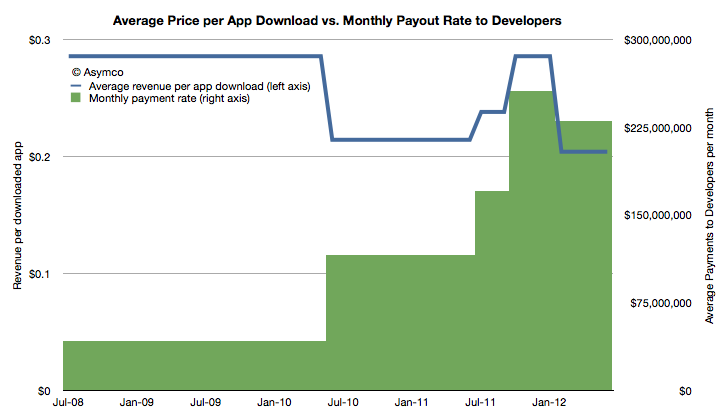
    The following chart shows how average revenue per app download and the average payment rate to developers has changed since the iTunes app store opened and given the data points available:

    The green area in the chart should add up to $5 billion. The average revenue for all downloads is 24c. 

    Although there has been a drop in the revenue and payout rate in the last six months, the cause may be due to seasonal effects. We have not been able to see data that might show seasonality in prior years so we can't be sure it exists. However, it makes sense to me that new buyers are likely to engage in a burst of app buying and there are more iPhone purchases in the second half of the year than in the first.

    In any case, the current "run rate" of payments to developers is about $7.5 million per day or $230 million per month. Both are up from last year.

    Whether revenues are decreasing or not will require some more data. The last period's 20c is not far below the app store lifetime pricing of 24c.


  9. 5by5 | The Critical Path #42: Full Circle

    Podcast · 13 comments

    Having just returned from China, Horace gives his impressions which leads to a discussion about industrialization and innovation and how countries "mature" and what is Apple doing in China and the new relationship between Apple and strategic partnerships and the new stats from WWDC 2012 about developer revenues and how that differs from Android and the 400 million Android devices activated vs. 400 million iOS devices built, in China.

    via 5by5 | The Critical Path #42: Full Circle.

  10. The iOS App market sales run rate is $4 billion per year

    Research · 54 comments

    At the 2012 WWDC, Apple released new data concerning its App ecosystem. Namely:

    1. 30 billion apps downloaded to date (excluding updates)
    2. $5 billion paid to app developers
    3. 400 million iTunes accounts

    These three data points allow us to update our picture of the app economy. First, the app download rate.

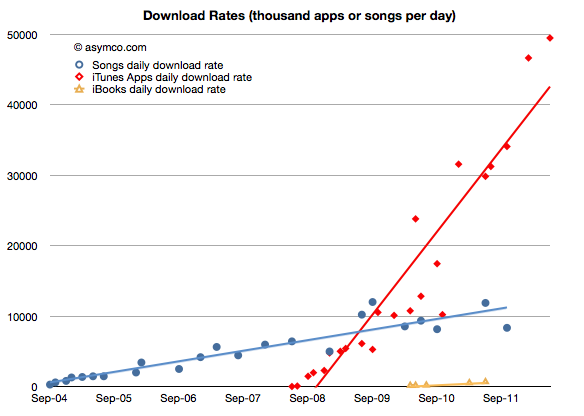
    As would be expected from an expanding user base, the app download rate has been increasing. It is now at about 49.5 million apps downloaded every day. The history of this rate is shown in the chart below:

    I added the same data for iTunes songs and book downloads for comparison. Note that although music and books are available to the same user base (actually higher due to Macs and iPods which do not run apps,) apps are being downloaded at a far faster rate--at least four times faster.

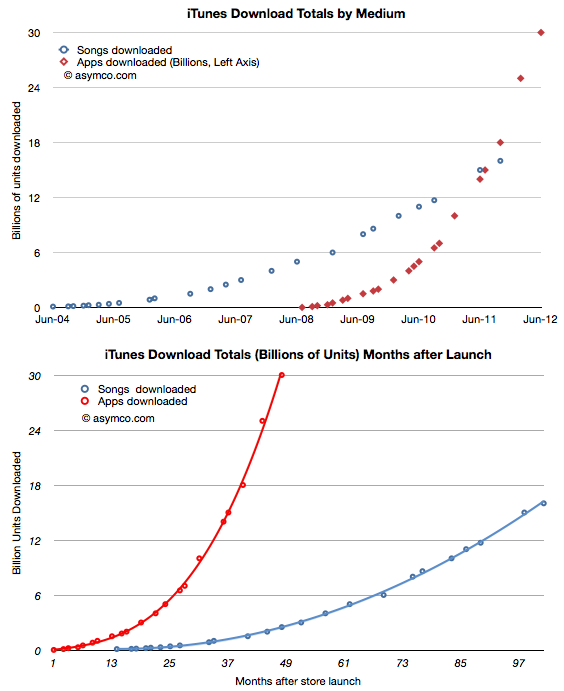
    In terms of total, cumulative downloads, the comparison is even more stark:

    It won't be long before total app downloads will be double total song downloads. Put another way, in the time it took the App store to reach 30 billion, the song store sold only 3 billion.

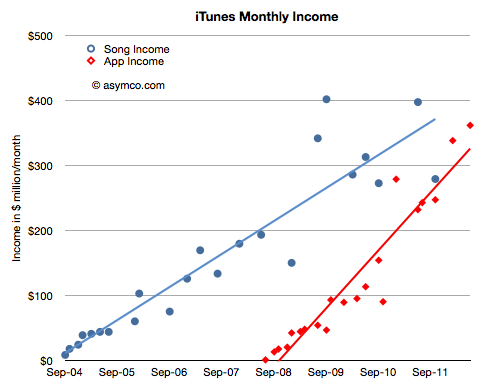
    On average, songs are more expensive than apps ($1.29 vs. $0.24). What is the difference in value, not just units?

    The data shows that apps have very likely overtaken songs as "gross" income. Apple does not book all app income, only the 30% share they keep, but in terms of transaction value, clearly apps are now a bigger business.

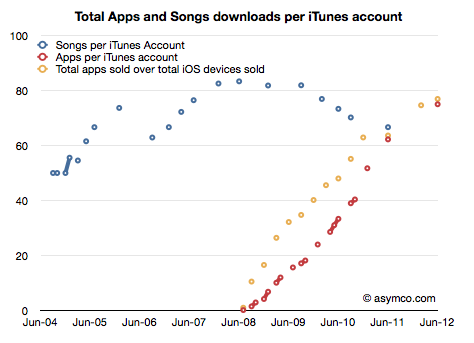
    What about consumption? Are individual iTunes account holders buying a constant or variable number of songs or apps?

    Here again apps show a distinctive pattern of out-performing songs. As far as digital media is concerned, apps are taking the download business by storm.

    What about pricing? Is the expansion of the user base into the hundreds of millions leading to a collapse in app pricing?

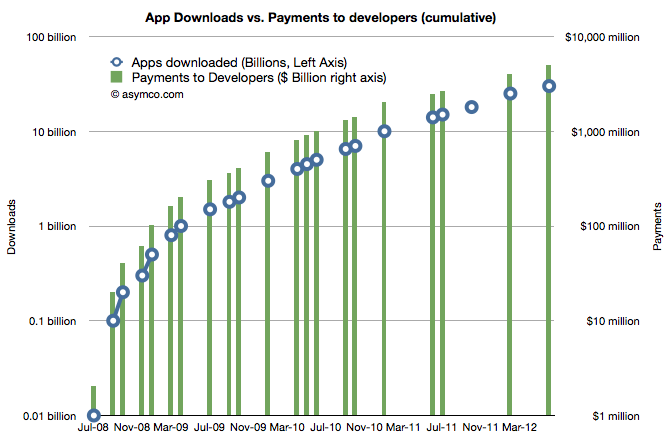
    No. You can see the price as the ratio between the downloads and the revenue to developers. If downloads scale more rapidly than payments then pricing is decreasing. As it turns out the average price of an app has held steady since approximately 1 billion downloads were recorded. That price is now about 24 cents per app (including free).

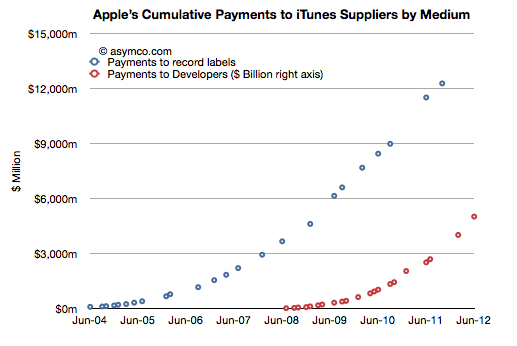
    Finally, how about the content owners? Are payments to the owners of the media beginning to favor developers over music publishers/promoters?

    Developers still have a long way to go. We can't be sure about how revenues are shared with music labels, but it's probable that they are still receiving bigger checks than developers. However, under some scenarios this will change quite soon.

    The bigger story here is that the iOS app economy has reached a run rate of $4.3 billion per year from a standing start four years ago.

    How big will the TV app economy be four years from the launch of an Apple smart TV?