Asymco

Asymmetric Intelligence

Horace Dediu

  1. Tim Cook on the "Law of Large Numbers"

    Research · 69 comments

    Q: 37 million units of iPhones shipped. When do we run into the Law of Large Numbers? What are the growth opportunities coming up?

    A: 37 million is a big number. It was a decent quarter. It was 37 million -- more than we'd ever done before. We were pretty happy with that, but let me give you the way I look at the numbers. As I see it, that 37 million for last quarter represented 24% of the smartphone market. There's 3 out of 4 people buying something else. 9 out of 10 phone buyers are buying something else.

    Handset market is projected to go from 1.5 to 2 billion units. Take it in the context of these numbers, the truth is that this is a jaw-dropping industry with enormous opportunity. Up against those numbers, the numbers don't seem so large anymore. What seems so large to me is the opportunity.

    What we're focusing on is the same thing we've always focused on. Making the world's best products.

    We think if we stay laser-focused on that, and continue to develop the ecosystem around the iPhone, that we have a pretty good opportunity to take advantage of this enormous market.

    Q: The biggest opportunity is the emerging markets. Large portion of that is the prepaid market. Apple has done very well but the wholesale iPhone price point is nowhere near what we would expect in the prepaid market. How do you make it more affordable to those markets?

    A: Those markets are critical. The smartphone market is projected to be 1 billion units in 2015, 3 years from now. 25% of that is projected to come from China and Brazil. Just two of those markets -- 25% -- obviously those are very critical markets, but there are others as well.

    We've been very focused on China. We've had incredible success with iPhone -- we've gone from a few hundred million in revenue to last year with $13 billion. We've been really focused on trying to understand the market there and taking those learnings to other markets. As it turns out, not very many people agree with me on this, probably.

    What I see is that there is a lot of commonality in what people around the world want. Everyone in every country wants the best product as it turns out. They're not looking for a cheap version of the best product -- they're looking for the best product.

    In the emerging markets there are very big differences in go-to-market. In most of the developed market, the carrier owns most of the distribution. In emerging markets, the retailer has most of the distribution. The whole go-to-market has to be changed significantly. Last year, we covered price points in the subsidized markets from $0 on up. That doesn't translate to zero in the prepaid market, but we're covering more price points there.

    The paramount thing is the product. It is the focus. Of course distribution, we've recognized the difference there and in purchasing power. Unlike many people, I don't subscribe to the premise that prepay is prepay is prepay. We convinced China Unicom to try to postpay. It wasn't big there but they tried it and it's working really well. It's great for everyone because customer gets cheaper phone and carrier locks in a customer. It's a different way to look at the issue and it's been successful in China.

    When Apple introduced the iPod in 2001, when we launched the iTunes Music Store and launched that on Windows, the iPod created a halo for the Mac. For 23 straight quarters we've outgrown the market on the Mac.

    The halo that was created by iPod for the Mac, was created in developed markets. It was created in the US, Western Europe, Japan, Australia, Canada. It didn't work nearly to the same level in Eastern Europe, Middle East, Africa, China, Latin America. People were already getting music from their phones. The world changed for us when the iPhone was launched.

    The iPhone introduced Apple to millions of people -- our brand -- to people who had never met Apple before. Now, it's interesting to look -- take China as an example -- last year the Macintosh grew more than 100% in China, year-over-year. Not on a big base, but 100% is pretty good. The market grew 10%, so we outgrew the market 10x.

    The iPhone is creating a halo for the Macintosh. iPhone has also created a halo for iPad. You can definitely see the synergistic effect of these products, not only in developed markets, but also in emerging markets where Apple wasn't resonant for most of its life.

    Via: Apple CEO Tim Cook Speaks at Goldman Sachs Technology Conference - Mac Rumors
  2. The world's biggest startup

    Research · 34 comments

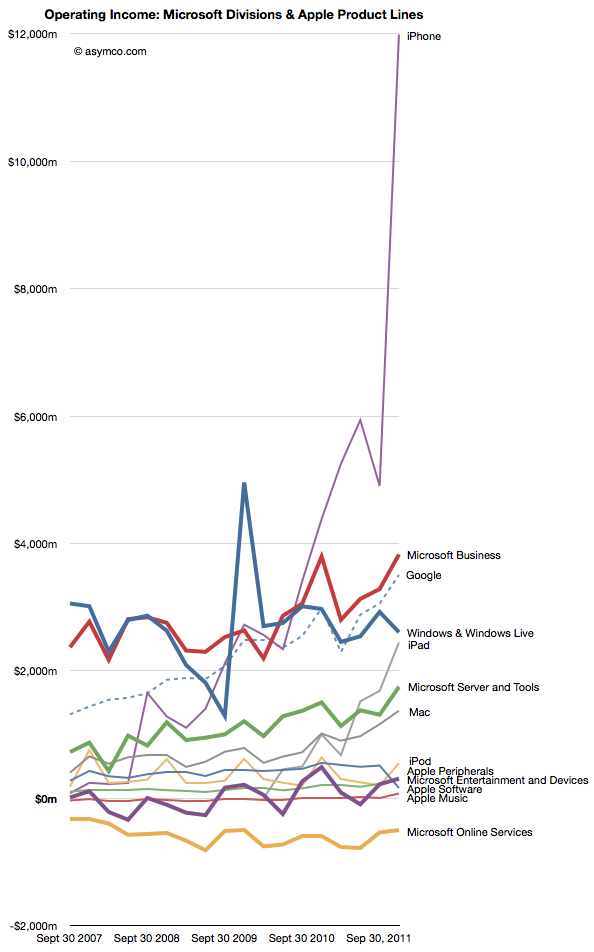
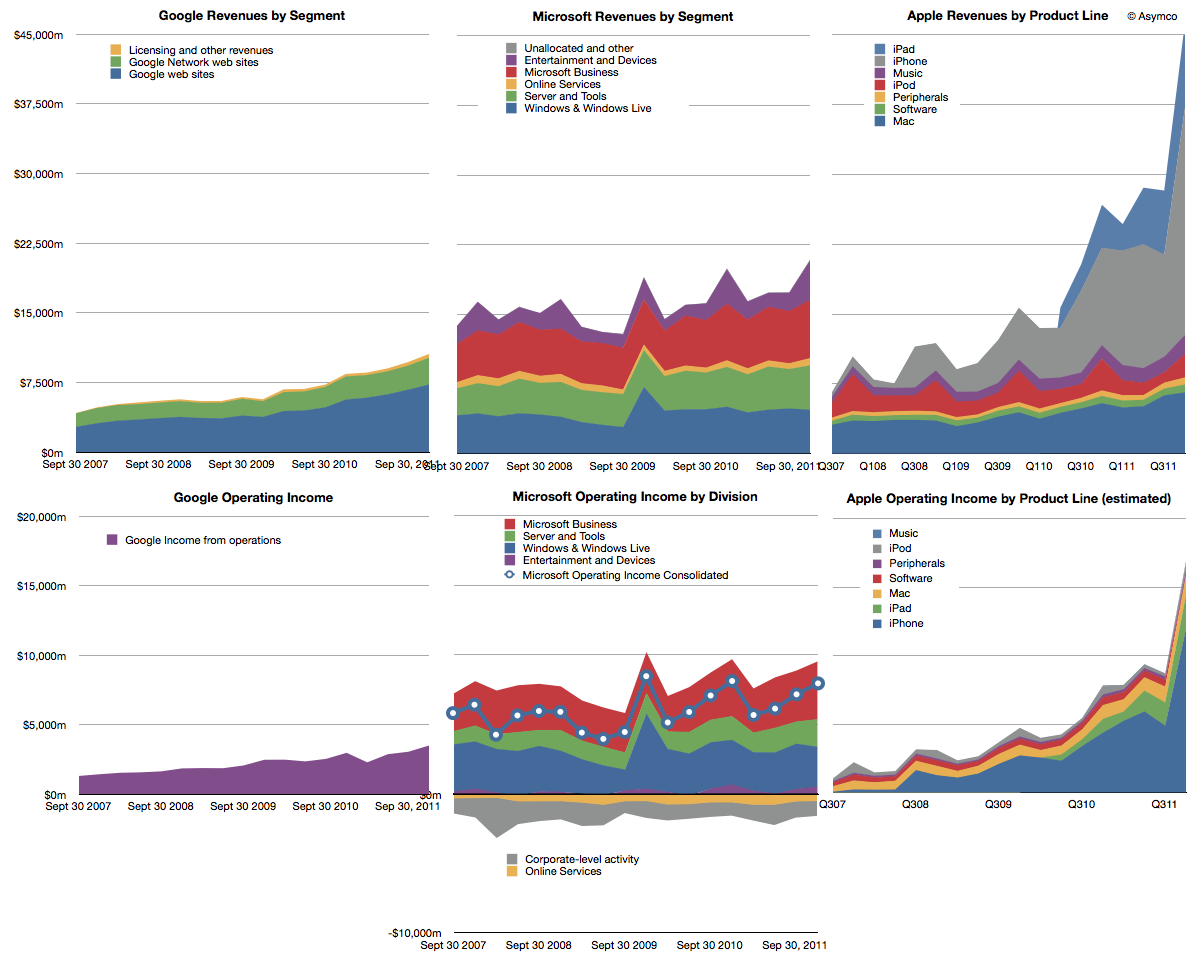
    Last year we began offering revenue and operating income comparisons between Apple and Microsoft. It was becoming evident that the iOS franchise was beginning to overtake both in revenue and profitability the Windows franchise. To offer more dimensions of comparison this time I am adding Google's top and bottom lines for comparison (click image for detail):

    Note that the graphs have the same scales when read horizontally. I've broken out the sub-divisions of revenues as the companies report them. Here are some observations:

    1. The time spanned is 4.5 years (September 2007 to December 2011)
    2. If we compare the fourth quarter 2007 to fourth quarter 2011 the ratio of Google : Microsoft : Apple went from 1: 3.39:2:16 to 1:1.97: 4.38. In other words, Microsoft was 3.4 times bigger than Google but today it's only about twice. Apple was twice and is now about 4.4 times bigger.
    3. In terms of operating income (i.e. before R&D, SG&A and OI&E) the ratios were 1:4.48:1.53 and are now 1:2.28:4.82. Microsoft's income gap to Google halved while Apple's more than tripled.
    4. Google and Microsoft have grown but not by adding new sources of revenue. Apple grew its base but, more importantly, added new businesses for spectacularly more growth.
    5. Compared to Microsoft and Apple, Google's revenue is distinctly single-source: advertising. Though divided between own sites and those of affiliates, advertising is today 96.1% of revenue and was 98.6% four years earlier.

    If we compare the individual product/business operating incomes individually we see some interesting patterns:

    1. Google's advertising profits have overtaken Windows as has the iPhone and the iPad may do so quite soon.
    2. Microsoft's Business (Office) and Server businesses are growing more quickly than Windows
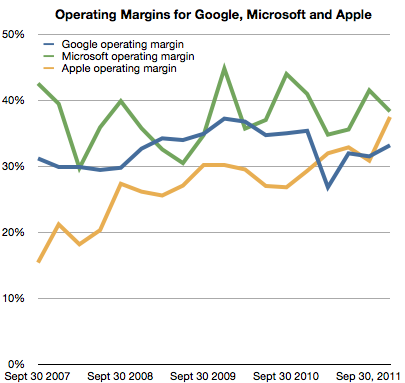
    3. The hardware oriented Apple' operating margin is now 37% and exceeds Google's 33% while being nearly equal to Microsoft's 38% (see chart below)

    I presented a subset of this material January 30th at a TechMeetups event titled "Apple - world's biggest startup." A presentation by Adam Lashinsky focused on the cultural and procedural aspects which highlight Apple's "startup" nature. My presentation showed, using these graphs, Apple's growth characterizes it as a "startup". The growth did not come from a broadening of its core products markets. It came from the creation of new product categories. Google, a much younger company does not exhibit this non-secular growth any more than Microsoft which is about as old as Apple is.

    The lesson is perhaps that rapid growth is not the right of small companies alone. Apple has used disruptive innovation to transform itself and offers a stunning contrast to two other companies which are also seen as innovative leaders.

  3. [Updated] Following up: When will Apple's share price reach $500

    Research · 71 comments

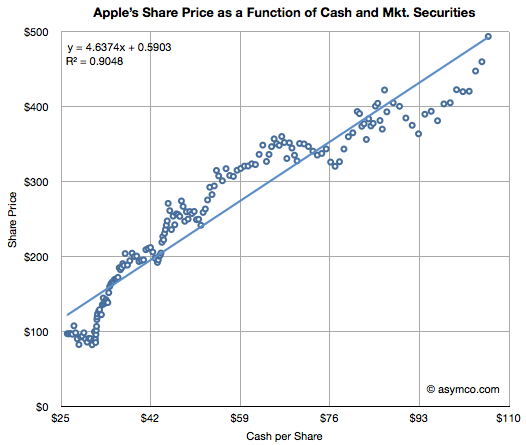
    Apple's valuation since October 2008 has been very highly correlated to its cash (R-squared of 0.91). This tight relationship to Apple's value is shown in the chart below:

    (The chart shows weekly, ending each Friday, share price (vertical axis) vs. interpolated weekly cash per share (horizontal axis) assuming linear growth between quarterly announcements. Share price data is current as of last Friday (Feb. 10) though cash per share is based on announcement date and hence delayed by about three weeks.)

    I noted this relationship in May 2011 and followed up in September 2011.  With current cash per share reaching $95 to $100 $103.66 it seems that the share price should be around $500 any time now.

  4. Apple retail growth data

    Research · 15 comments

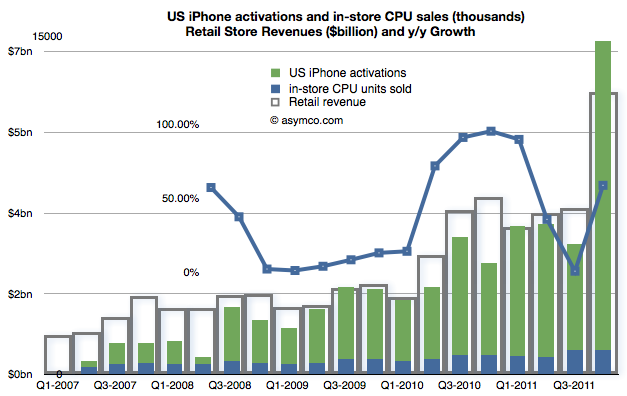
    Apple's retail stores increased sales by nearly 60% in Q4. This is a dramatic though not unprecedented change from Q3's 1% growth rate. The growth rate faithfully tracks iPhone releases as demonstrated in a post last quarter.

    When seen on a yearly basis some of the data begin to from a picture.

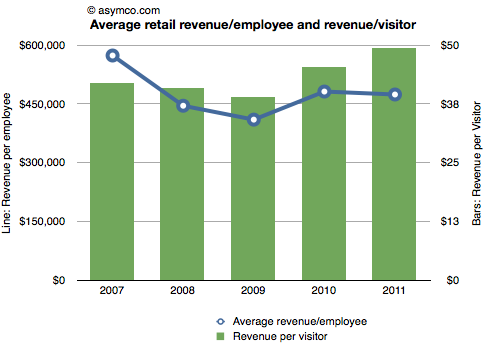
    • There were 332 million visitors in 2011, an increase of 29%. (This total is greater than the population of the United States.)
    • The average  revenue was nearly $50 million/store
    • 38 stores were opened, in-line with 2010's 40 openings
    • Total 2011 revenues were $16.4 billion
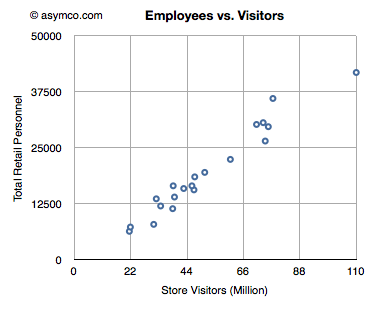
    • About 34,600 (full time equivalent) employees were employed on average
    • There were nearly 1 million visitors per store
    • There were an average of 100 employees assigned to each store
    • Average revenue/employee was $473,622
    • Average profit/employee was $120,289
    • There were about 9,600 visitors for each employee
    • Each visitor generated about $50 in revenue
    • The revenue per square foot was about $6,500 across all stores.

    Some of these metrics are shown in the following charts relative to prior years:

  5. The US temporarily regains relevance for Apple's iPhone

    Research · 16 comments

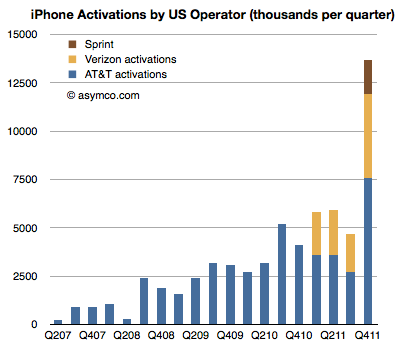
    Sprint reported its first iPhone quarter sales at 1.8 million. You may recall my analysis of Sprint's "gamble" where I estimated that Sprint will easily sell the 31 million iPhone which they committed to buy from Apple. I had estimated that they could sell an average of 7 million units a year but perhaps conservatively they could ramp at 4, 6, 9 and 12 over the four year period rumored to be in the contract.

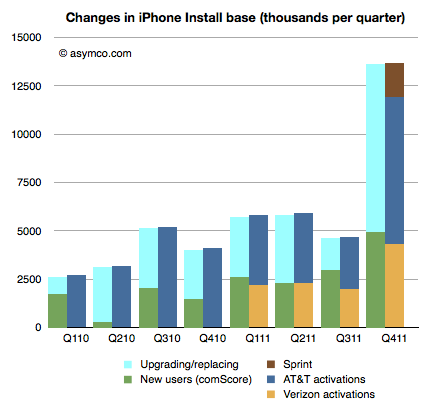
    Given the pent-up demand I also estimated that the first quarter could reach 2 million units. They managed 1.8 and that's a solid start. Overall the US carriers activated 13.7 million iPhones. Here are the iPhone activations by US Operator:

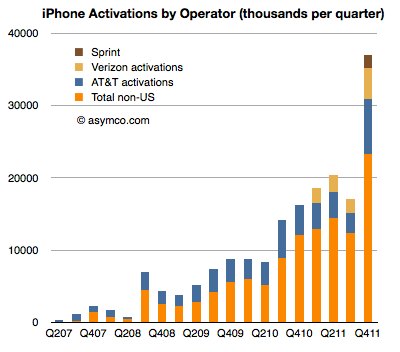
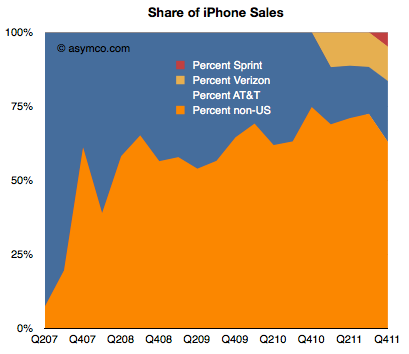
    That's 37% of the total market in Q4, shown in area and bar charts below:


    Note that the percent of total activations outside the US has dropped but that is due to the limited distribution of the iPhone 4S outside the US in the launch quarter. The long-term trend is for the US to decrease as a percent of total iPhones even with the additional US distribution.

    By comparing the net adds to US install base from comScore survey data, we can estimate that about 63% of US purchases of iPhones were replacements and that 8.7 million iPhones were put out of use in the US last quarter.

  6. What did I get right (and wrong) about the fourth quarter?

    Research · 40 comments

    I've been publishing my estimates for Apple's business performance for a few quarters (see here, here and here). My estimates have been collected along with those of dozens of others by Philip Elmer-DeWitt at the Fortune Apple 2.0 blog.

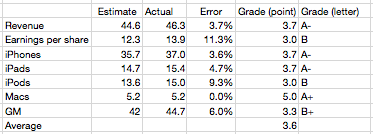
    I've also been scoring my performance and discussing the causes of errors. Here is the analysis for the fourth quarter 2011.

    My estimate for Mac growth was very precise. It was based on a 27% growth estimate. It turns out that growth was well within historic range and thus quite predictable.

    iPhone and iPad error was very modest at less than 5%. This led to a very low error on Revenues (as I also did not expect ASP to change).

    I was too pessimistic on the iPod, expecting 30% decline and 13.6 million units. In reality the business declined by only 21% and Apple still sold 15.3 million units at an average selling price of $164.

    Due to an underestimate on margins which are highly sensitive to iPhone margins my gross margin estimate was off by 6%. This led to a relatively poor EPS error of 11%.

    Nevertheless, the "grade point average" for the quarter was 3.6 which is nearly an A-. This is an improvement from the B- from the last quarter.

    Because the accuracy was good, there is little to be learned from the quarter. Perhaps the most important observation is that the iPhone recovered from two outlying quarters. The second quarter where it overshot expectations and the third quarter where it undershot. These were hard to predict because the product went through a delayed transition which whip-sawed both production and sell-in.

    What we saw in the fourth quarter is a  return to the predictable historic growth of nearly 100%.

    To give a perspective on the performance of other analysts, a motion chart showing their errors is here.

    See also the video PED published of the same data here. (This video was produced from the same motion chart shown above, selecting bars instead of bubble as the chart type).

    Notes:

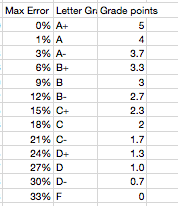
    1.  The scoring of the error is according to the following table:
    1. The results can be seen for all the other analysts as a table here (with data since mid 2008).
  7. First: Apple's rank in mobile phone profitability and revenues

    Research · 82 comments

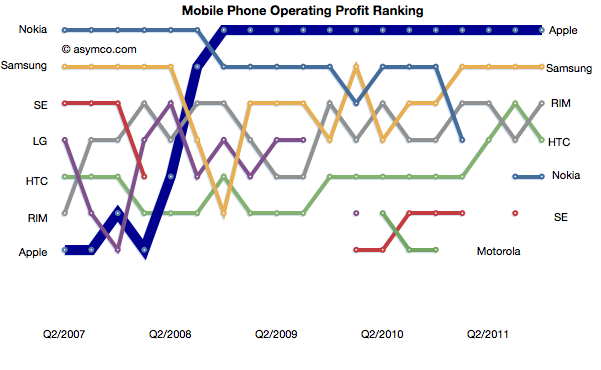
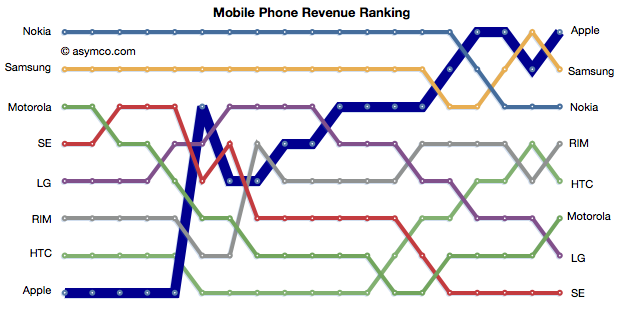
    Apple retained its top rank in profitability and regained the top spot in mobile phone revenues.

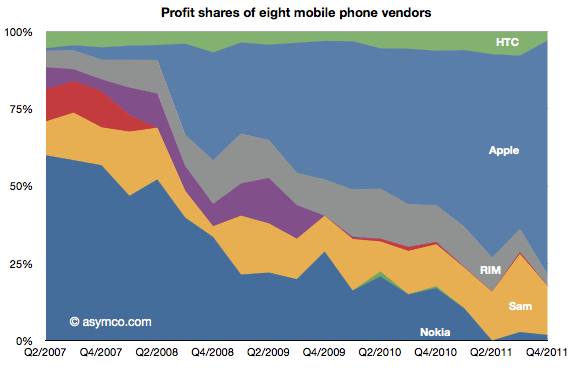
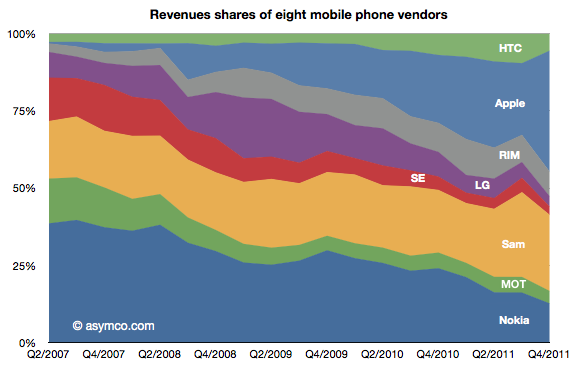
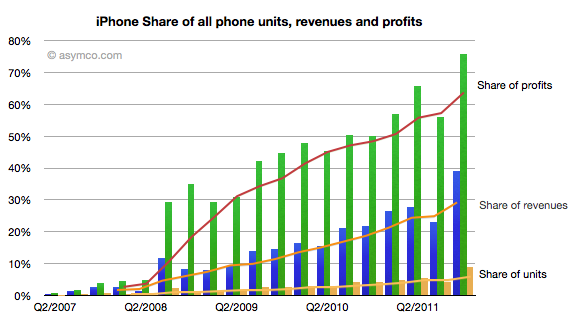
    The relative shares of revenues and profits are shown below:

    Individually, Apple's share of units, revenues and profits is chronicled below:

    Apple reached 75% of profit share, nearly 40% of revenue share and 9% of units share.

    Apple and Samsung combined for about 91% of profits with RIM third at 3.7%, HTC fourth at 3.0% and Nokia last at 1.8% of a $15 billion total for the quarter.

    In terms of revenues, Apple had 39% to Samsung's 25%. Third was Nokia with 12.6% and fourth RIM at 8%. HTC only managed 5.5%, Motorola 4%, LG 3.3% and Sony Ericsson 2.7%.


  8. Third

    Research · 33 comments

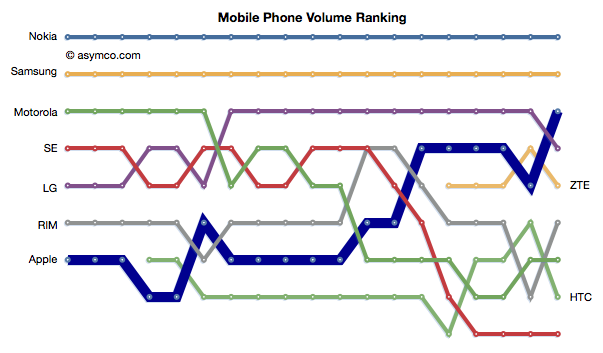
    Apple reached the third place rank in total units shipped during last quarter. The following chart shows the ascent in rank.

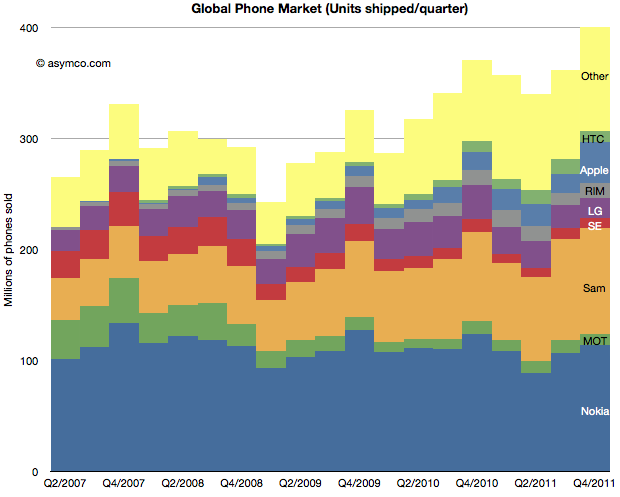
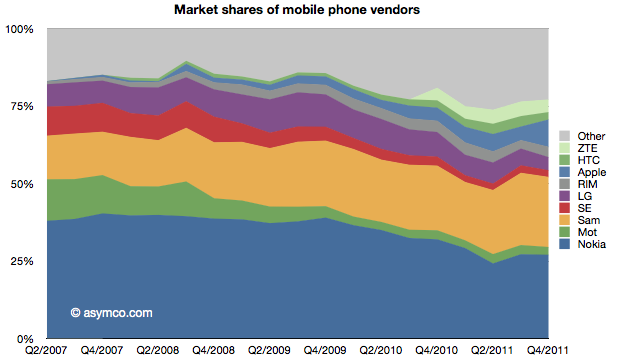
    Apple achieved this with a total market share of about 9%. Second place Samsung has 22.6% so there is significantly more room to go before Apple gets to be second. Nevertheless, the climb to third was achieved in less than five years. At the time when Apple entered the market third place was held by Motorola with shipments of 35.5 million units (Q2 2007). Motorola only managed 10.5 million in the last quarter.

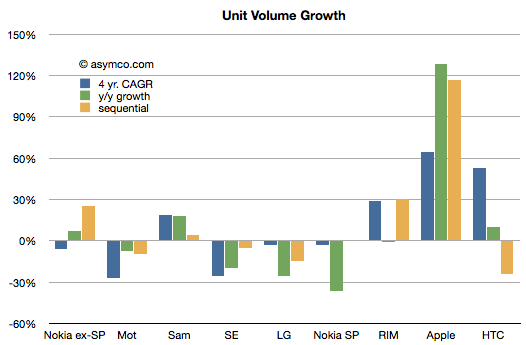
    To see growth I prepared the following chart showing the fourth quarter's growth by vendor according to four years' compounded, sequential and y/y growth.[1]

    On a four year compounded basis, the pattern is that of Apple, HTC and RIM showing significant growth with Samsung showing moderate growth. The other vendors all had negative real volume growth. The list does not include "Others" which had 13% compounded growth.

    Projecting Apple's 60% rate of growth and a market growth of 10% leads to Apple obtaining 27% share by the end of 2014. My guess would be that is when we'll be able to write a post about Apple being second.

    ---

    Notes:

    1. I don't have HTC data for Q4 2007 so the compounded rate is measured for three years.
    2. Additional volume data
  9. Pricing Paradox

    Research · 148 comments

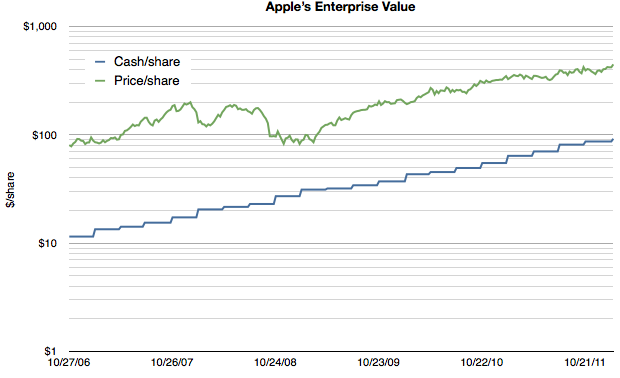
    As Apple's extraordinarily low valuation is being more widely noted, explanatory hypotheses are proliferating. Everyone seems to have an opinion. Some explanations come in and out of fashion. Others are reliable old clichés. We've seen liquidity issues with large funds forced to sell, "too much cash", management transitions, an impending loss of mojo, share price too high to afford, "law of large numbers", and that old chestnut, competition. None of these satisfy. They don't explain why reliable growth is not valuable. And reliability is indeed what Apple offers in spades. Consider the following chart:

    Note that the scale is logarithmic so that the growth patterns can be seen clearly.

    It shows Apple's cash/share vs its price per share. First, it should be noted that the company's cash has been growing reliably on a log scale, increasing by a factor of 10 in five years. As a proxy for retained earnings, the cash trajectory shows exceptionally predictable earnings.

    Second, although the share price has grown it has not grown either as reliably or as quickly. It's as if the reward for reliable earnings is a significant dissent.

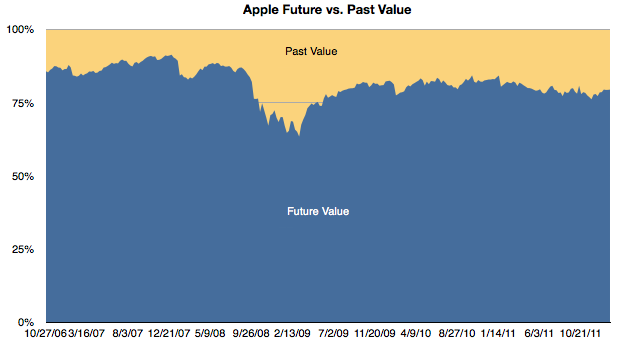
    Third, if we subtract the cash/share from the price/share we obtain the enterprise value (EV) per share. The EV reflects the future value built into the price. It reflects the expectation of more earnings. In the chart above one can see the shrinking of the gap as a multiple of the cash value. To bring that gap into focus, I prepared this chart showing the percent of the share price allocated to past value (cash) and future value (EV).

    One can see the gradual erosion of emphasis of future value. With the exception of the credit crisis induced equities crash, future value as a percent of total value is at a new low. In late 2006 the future was was about 86% of the share price. At the end of last week it had dropped to 79%.

    Another way to interpret this is that in 2007 when the iPhone was born nearly 90% of the business value was thought to be in its future. Today only 80% is future value.

    To clarify further, if a company reaches a price where 100% of its value is cash then it's seen as having no future value. Having any significant portion of the price attached to the past is extremely rare for a growing company and I would say unheard of in a company growing as rapidly as Apple is.

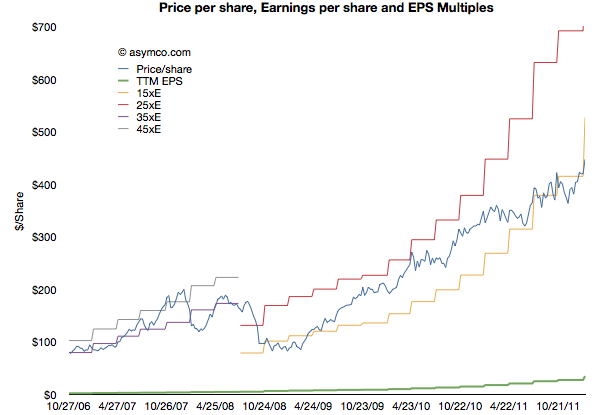
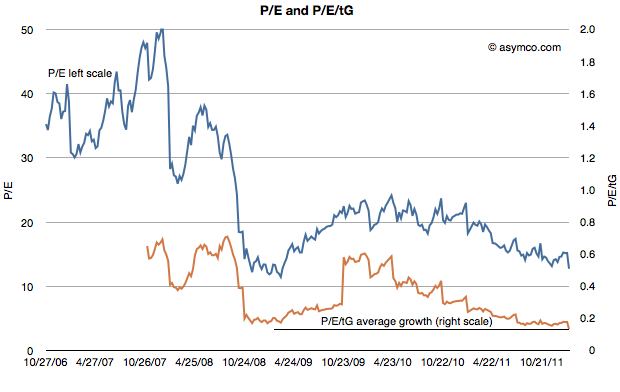
    This preoccupation with the past and discomfort with the future is, I believe, the key to understanding the valuation paradox for Apple. I have gone over the conventional metrics of P/E and P/E/G(trailing) that illustrate absurd pricing (updated below). But they don't help explain the mis-pricing.

    A disruptive company is inherently unpredictable. Success and growth are unrewarded because there no understanding of the underlying causes of these phenomena and therefore there is no expectation of repetition.

    In other words, a five year dead-straight line of logarithmic growth is not a sign of anything resembling reliability if the underlying causes are not understood. Today Apple is still a mystery wrapped in an enigma and without a causal understanding of its suceess its pricing will remain paradoxical.

  10. Apple's Fourth quarter 2011 Growth Scorecard

    Research · 53 comments

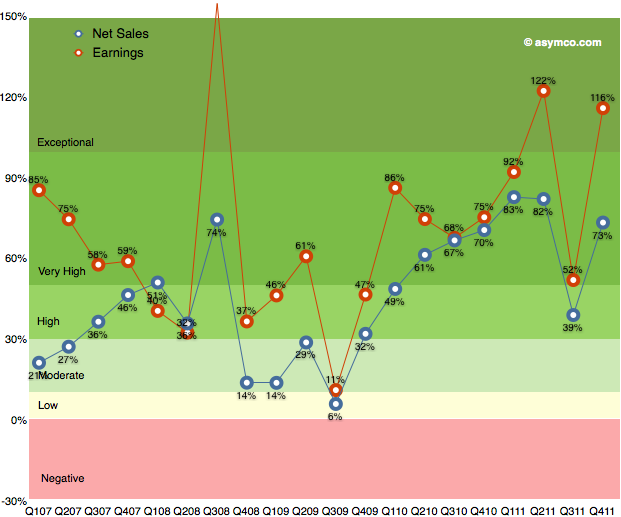
    After the transitional third quarter, Apple's earnings growth returned to an exceptional level. As the following chart shows, earnings growth has maintained above 50% growth since 2009.

    Q3 turned out to be a transitional quarter with 52% growth but Q4 proved to be  "exceptional" with growth above 100%.  This is the third highest rate of growth in the five year span shown. Sales growth was also very near the top of the range, coming in fourth historically.

    When looking at the components making up sales, we can see each product line's revenue growth in the following table: 

    The growth leaders were also the largest product lines in terms of revenue. iPhone and iPad had triple digit growth rates and that translated into the bottom line growth.

    Music related products and services which Includes revenue from sales from the iTunes Store, App Store, and iBookstore in addition to sales of iPod services and Apple-branded and third-party iPod accessories grew at 42%. This is the highest rate during the time frame shown.

    Peripherals which Includes revenue from sales of displays, networking products, and Apple TV was next with 29% revenue growth.

    The Mac line followed with 22% growth and Software which includes sales of Apple-branded and third-party Mac software, and services through the Mac App Store grew at 7%.

    The iPod line continued to shrink with -26% decline.

    I used color coding in the table to show the patterns of change and what I note is that the iPhone and iPad lines continue to be exceptionally fast growing businesses. The duration and amplitude of these streaks of growth should be a clear signal about the dynamics of these markets and Apple's role within. Too often, I find, these signals are ignored.