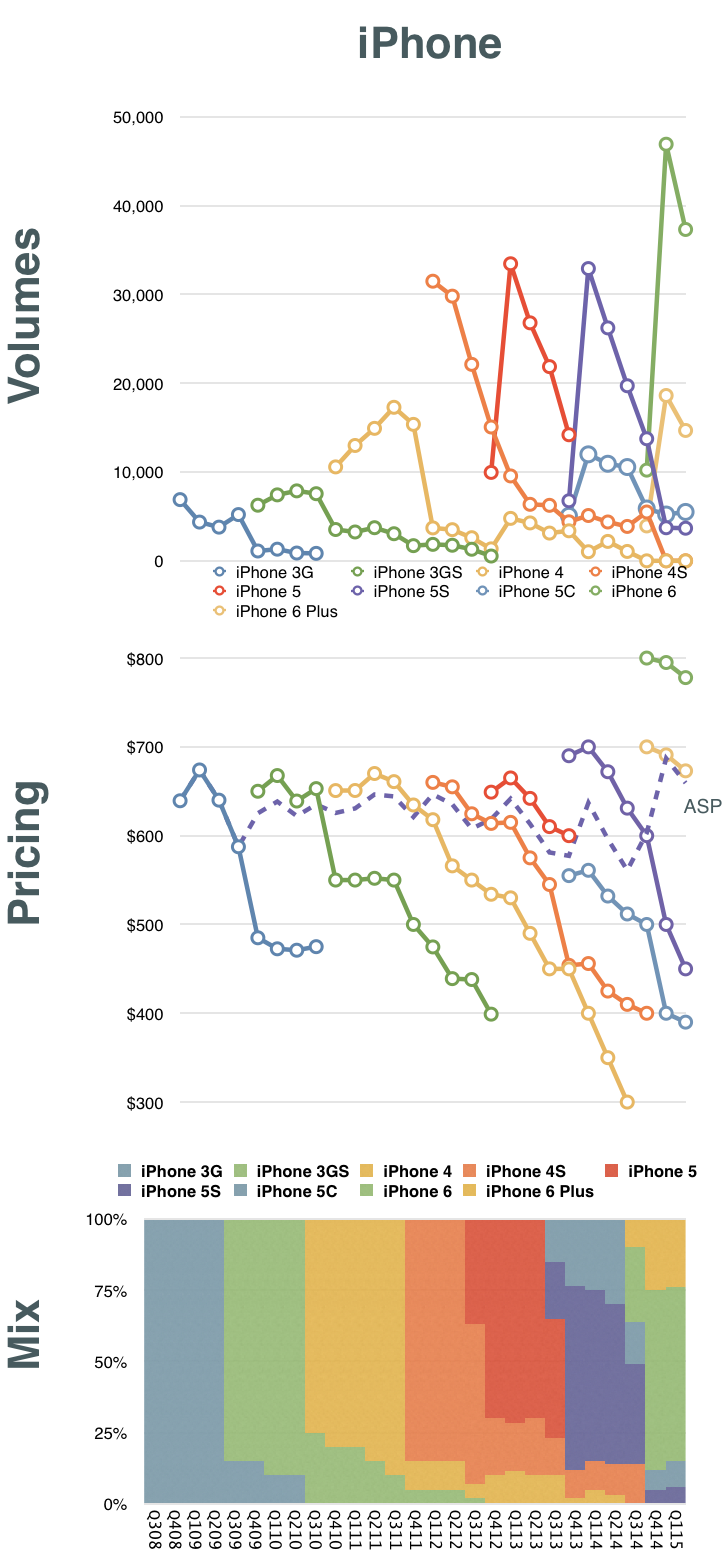
We know how many iPhones Apple ships but we don't know exactly how many of each model. We can try to come close in such estimates of "mix" by looking also at the market pricing of the phones and the average price Apple obtains ((ASP = Revenue/Units shipped. However, note that there are deferrals in revenue as part of this.))
Combining what we know with some guesses allows some of us to estimate the composition of iPhone models in any given quarter's sales. Here is a graph showing my estimates:
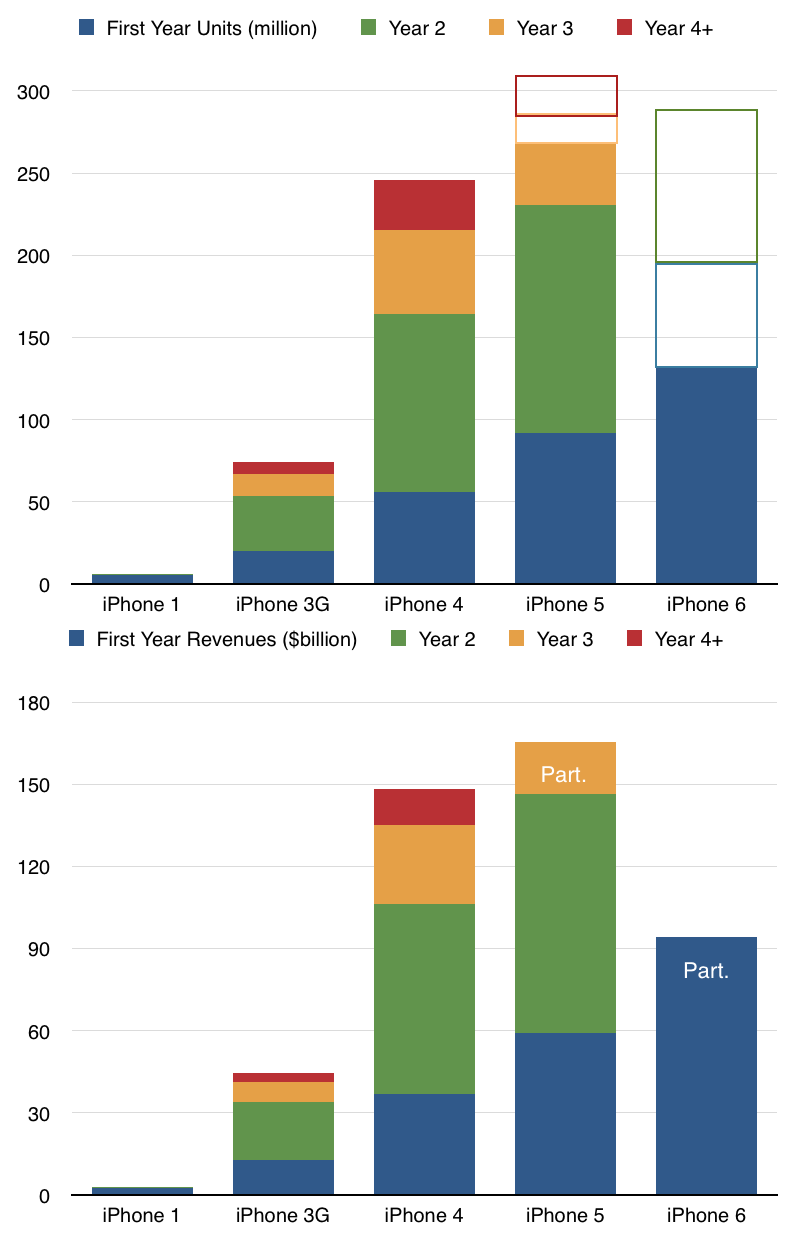
Having this, we can then assess how each generation of iPhones has performed. Remember that although we had a new iPhone for each of the last eight years, there are only 5 generations in total. Starting with the 3G (second generation) the generations were two yearly product cycles long.
The resulting estimates for generational growth are shown below.
I included a second graph with revenues. Note that the iPhone 5 and iPhone 6 have not run their course. History suggests at least a five year run for any one generation and the 5 is at less than three years old and the 6 is at less than one.
The interesting question is therefore not whether each generation sells more than its predecessor but whether it does so by a substantial multiple. I drew in outline a few estimates on future volumes for the 5 through its end of life and for the 6 for the current and next year. Of course these are highly speculative but the question of how much can be expected from these generational leaps is interesting.
Recall that
When assessing sales for a new model of the iPhone, Apple used an easy shorthand: "Each new generation sold approximately equal to all previous generations combined."
Phil Schiller's Testimony in Apple v. Samsung trial
Such a pattern of growth, which I call "Schiller's Law" is extremely difficult to maintain and probably won't apply in the case of the 5 or 6. However the growth of the overall franchise is very apparent. In particular you can see how first year sales have a very healthy pattern of growth, especially when measured in terms of revenues.
Horace Dediu, current research fellow of the Clayton Christensen Institute and founder of Asymco.com joined us for an epic and insightful discussion focusing on few key interesting topics: (a) new market disruption theories, (B) Apple in China and the luxury market and (c) the Japanese automotive industry and how it shapes up against disruption from Tesla, Uber and Apple. In the first of the trilogy, Horace discussed the origins of Asymco.com and also why he has used Apple as the lens to understand innovation and technology disruption. We also traced back to other Apple-like companies in the past such as Sony in Asia, and look at how Apple and Pixar has displayed a different kind of "DNA" against innovative companies in the past. Last but not least, we discussed the evolution and future of Google and where it might lead them to.
Unicorns typically are valued on the basis of number of users. While they are not yet monetizing those users, their growth and engagement metrics are expected to be off the charts. As there are no revenues (or profits) the $billion valuation hinges on a nominal value of $/user. That figure is based on comparable companies (e.g. Facebook) which do monetize their users.
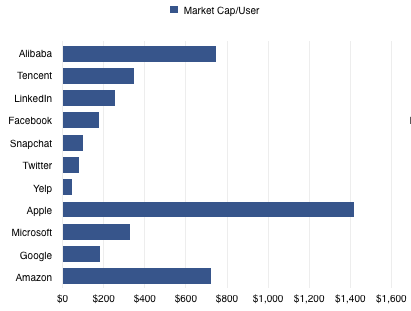
Since the unicorn's capitalization/user defines its valuation, which company should be considered comparable? Unfortunately they range widely. There are many alternatives. The graph below shows a few Market Cap/Mobile User rates ranging from $45 for Yelp to $747 for Alibaba.
Note that I've also added companies which may not be considered as unicorn comparables because they are not usually valued on a per-user basis. Apple, Microsoft, Google and Amazon are priced by product sales, typically. However, most of them operate and self-define as service organizations. Microsoft has been "monetizing users" for decades using a recurring revenue model. It has a "SaaS" business logic for most of its revenues. Google ((Google users are estimated at 2 billion active Android/GMS devices)) likewise. Amazon reports its active users every quarter and obviously is measuring itself by that metric.
Apple ((The assumption here is that Apple has 520 million active users which is based on iOS devices in use estimates)) is the least likely to be seen as a company whose value is a function of user base. Nonetheless it behaves entirely on that basis. The company's entire strategy depends on satisfying its customers and building its brand which can only have one outcome: loyalty and repeat purchases. The services and software they offer can be seen as supporting that brand loyalty which is converted to profit through an above-average selling price.
Being mature of business model therefore does not exclude a company from being valued like all the kids are these days.
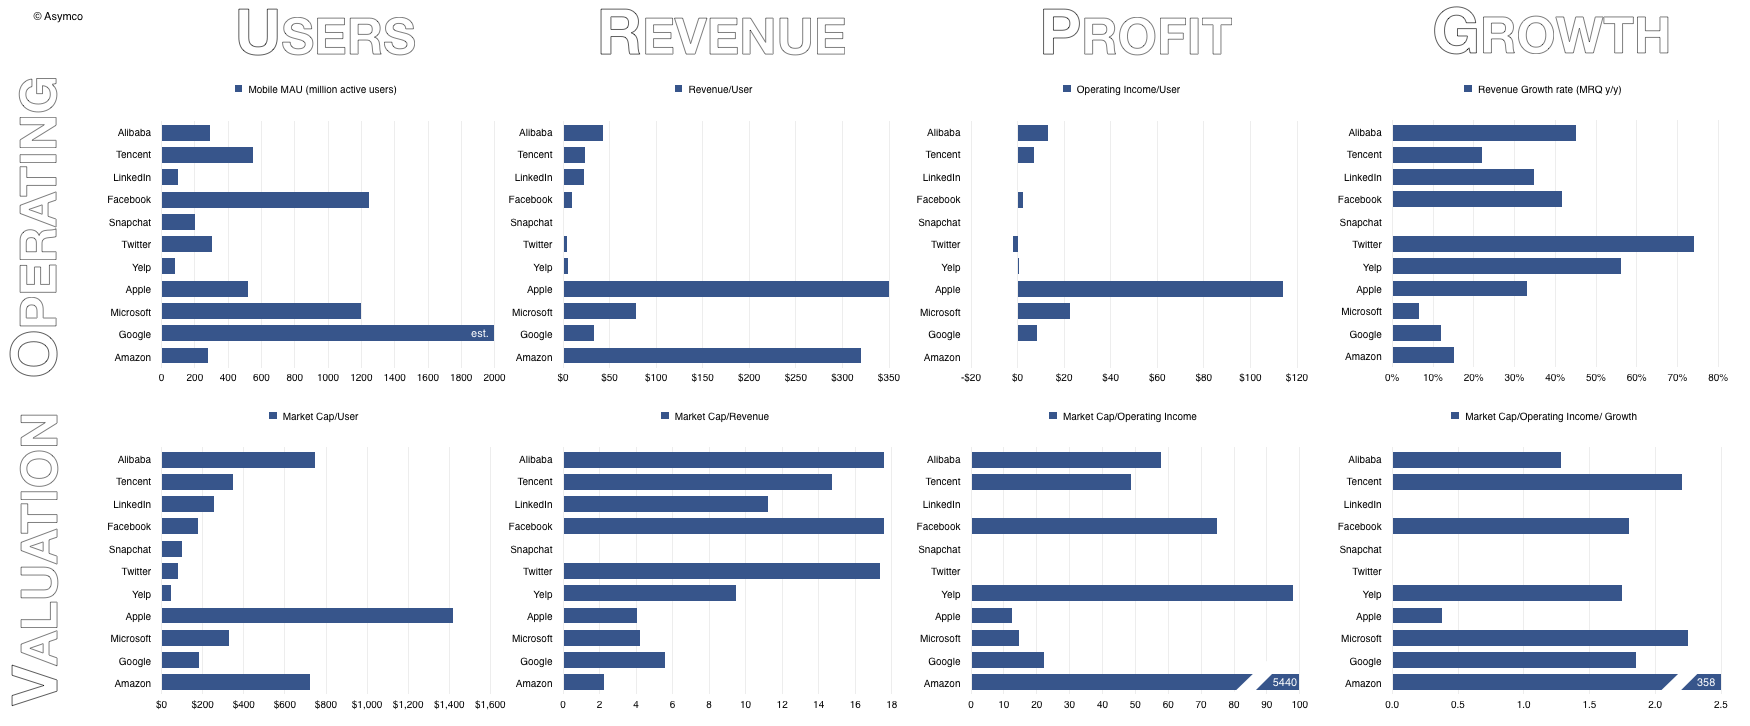
So, if we do look at the value/user metric we might as well look at the revenues, operating profit and growth data.
Unicorns are therefore characterized as having negligible revenue or profit but significant growth. The growth of Alibaba, Tencent, LinkedIn, Facebook, Twitter, Snapchat and Yelp should be seen in the 50% y/y range. The growth of mature companies is more modest: Microsoft (<10%), Google (12%), Amazon (15%).
Apple is an exception with recent growth in the 30% to 40% range.
Markets therefore value internet services at multiples of 10 to 20x revenues and 50x at least in terms of operating income. These multiples don't yet apply to Unicorns, since they typically don't have revenues, but the expectations are typically in this range once they do.
Mature product companies are valued more cheaply with 2x revenues for Amazon (a retailer with zero margins) up to Google with near 6x. Apple and Microsoft are in the middle at 4x revenues.
Mature company value as a function of income is also much lower ranking from about 12 for Apple to 22 for Google. Amazon's multiple is astronomical only because it has almost zero income.
Finally, when considering growth and income together ((When seen into the future this is the PEG ratio or Share Price/Earnings/Growth. When seen into the past, this is the PETG or Share Price/Earnings/Trailing Growth)) both emerging services and product companies are priced between 1.3 and 2.5. The outliers are Amazon due to its lack of income (PETG of 358) and Apple with its enormous income (PETG of 0.4).
This last ratio has had a "rule of thumb" of 1.0 being the "fair value" with <1 being seen as under-valued for growth and >1 being over-valued. Alternatively it can be seen as either pessimism about sustainability or optimism, respectively.
Clearly Unicorn Mania (or Unicornia) is a reflection of an optimism around new market disruptions in many industries where software has suddenly become ingestible. Old-school software companies are seen as less exciting in this context. If only they could take part in these new market creating opportunities then maybe they too could benefit from this optimism.
Searching for "iPhone killer" returns millions of hits. It's hard to remember any phone/product/service/platform/initiative/merger/startup which was not at some point considered an iPhone killer. A sampling is offered here.
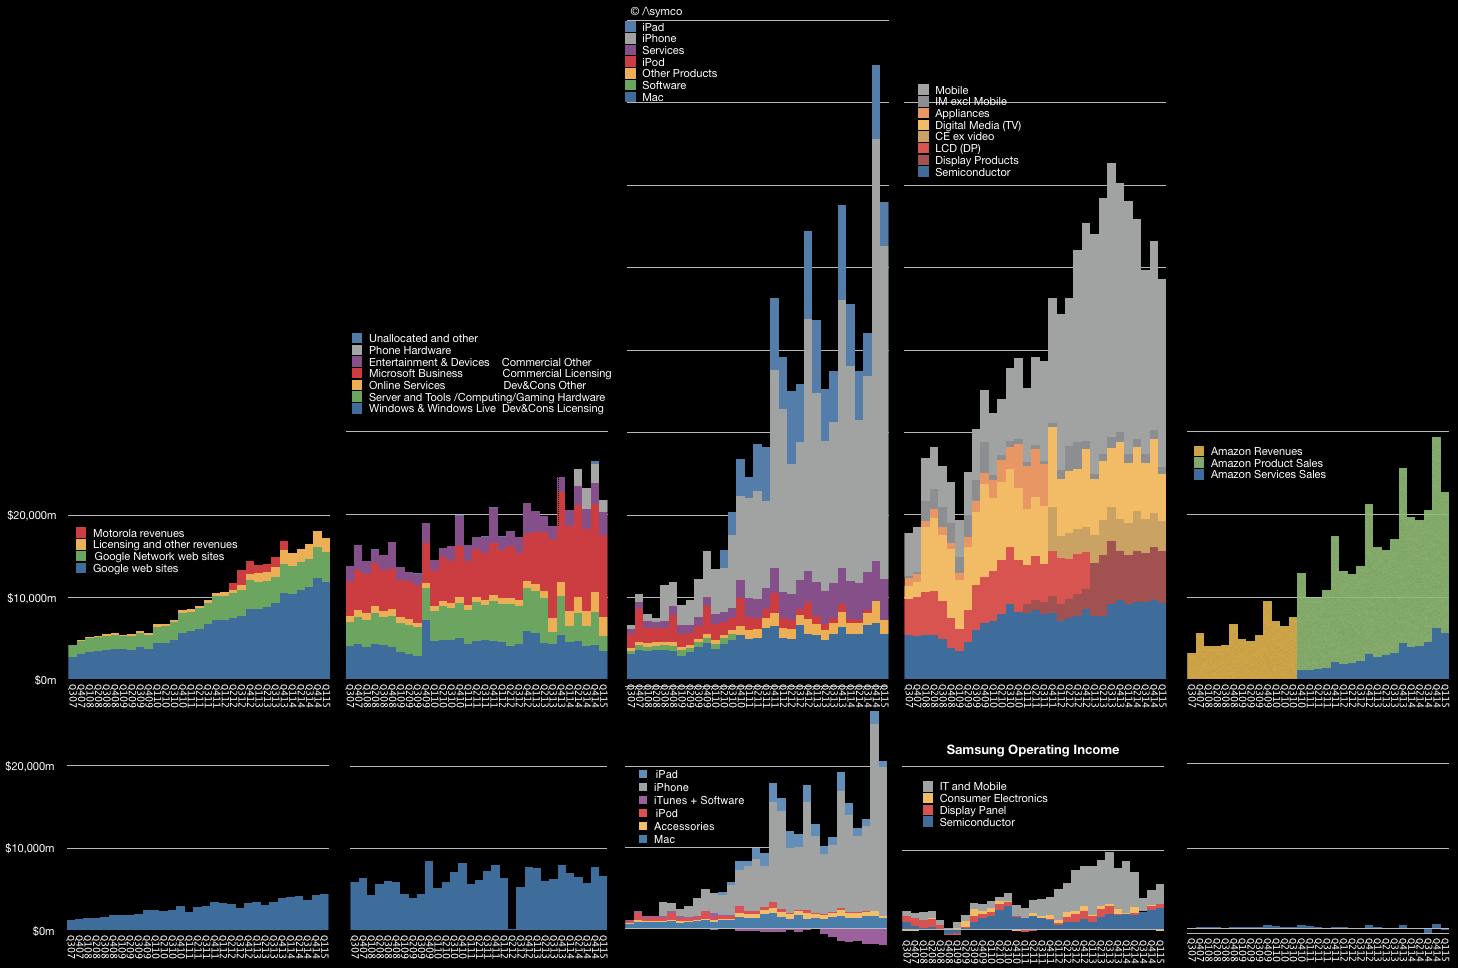
In reality, the killers seem to have all faded away while the iPhone continues. We could just shake our heads and move on, but a deeper analysis is possible. Take a look at the graph above. Note that iPhone's (and hence Apple's) ascent has not caused decline in its nominal competitors. When seen in the context of the graph above, the success of the iPhone has in fact been complementary to those companies who would be its killers.
Consider that the iPhone drives a large portion of Google's revenues as it is the home to many Google services and engagement through the iPhone is higher than any other platform, including Google's own. iPhone users tend to make better customers. In exchange Google pays a great deal for traffic acquisition on iOS devices. The placement of search on Safari is probably the biggest single cost item on Google's income statement ((Estimates are a few billion dollars a year.))
The iPhone example drew Google to build Android as a facsimile and that, coupled with Brobdingnagian spending on marketing, led to Samsung's Galaxy success. That success seems to have peaked and the brand is now a victim of low-end disruptors which copied it and the iPhone in turn. However, Samsung electronics benefits from the iPhone in terms of its semiconductor division. Apple is Samsung's biggest customer and the semiconductor division is now the largest source of operating profits.
The explosion of Android has led to IP licensing revenues for Microsoft and now Microsoft is extending its software applications to iOS, hoping to participate in the iOS ecosystem rather than competing with it. The time may come when Microsoft shows growth from the iPhone.
Finally, although it may seem oblique, Amazon is benefiting from the iPhone. Instead of killing it with the Fire ((presumably as a low-end disruption)), the iPhone and iPad offered much more mobile shopping opportunities to the Amazon store. Data shows that iOS leads in shopping traffic and order size precisely at a time when Amazon obtains its largest volumes. Amazon's AWS also handles a great deal of iOS-originated traffic.
This alternate reality shows that the benefits from the iPhone revolution are broad and deep. It's not just the direct revenues (($25 billion paid so far)) from app sales on the App Store but also the creation of entire new communications modalities (Instagram, Snapchat, WhatsApp) new services (Uber, Airbnb) and the multi-billion dollar accessories markets. These benefits are largely unmeasured and therefore not visible in accounting systems. They are perceivable however.
Users perceive the value, developers perceive the value and, in the end, the only account that matters, the brand, accrues these perceptions to grow in value.
As the brand flourishes, the perception of vulnerability dissipates and the narrative shifts from Apple getting killed to killing it.
It's taken eight years and 500 million loyal users but, perhaps, just perhaps, this change in perception is entering the collective consciousness.
In the fourth quarter of 2013, mobile phone sales in mature regions fell due to weaker demand."Mature markets face limited growth potentialis the markets are saturated with smartphone sales, leaving little room for growth with declining feature phone market and a longer replacement cycle," said Anshul Gupta, principal research analyst at Gartner. "Lack of compelling hardware innovation has further exacerbated replacement cycles for high-end smartphones in 2013 because consumers don't find enough reasons to upgrade." - Gartner
Anshul Gupta's assertion of market saturation was not the first. IDC also cited "a number of mature markets nearing smartphone saturation" in late 2013.
Shortchanging the smartphone market is nothing new. It was happening very early in the market's formation when initial growth was not as rapid as expected. I recall Nokia managers disappointed with sales growth losing faith in smartphones in 2004. Eleven years later, the market is still growing.
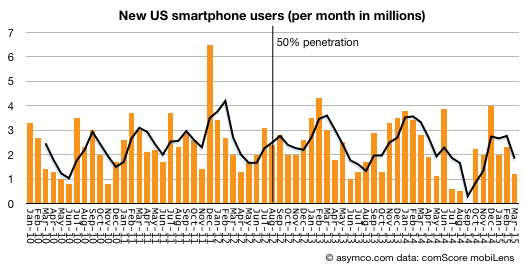
comScore reported that during the first quarter of 2015 the US market was adding over two million new smartphone users every month. These are not two million units sold every month but two million new users who began using smartphones for the first time ever, every month.
Since the end of 2013 when both IDC and Gartner declared the onset of saturation in "mature regions" ((The US is the most mature by penetration data)) 31.5 million new-to-smartphones Americans adopted the product. That's an addition of 11% of the sampled market.
And the sampled market is just a subset of the addressable market. comScore only counts 'primary phones' in use and excludes company-purchased devices and any users below age 13.
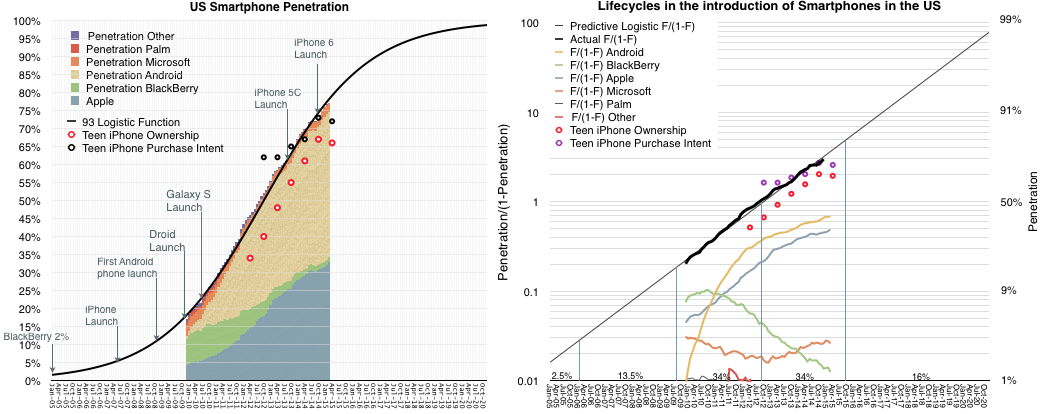
So according to comScore's data, the US market is at 77% smartphone usage. My assumption is that saturation would come at the earliest at 90% and could be 100%. ((Of the market comScore measures)) The fact that conversion to smartphones is still proceeding at roughly the same rate it has been for five years, makes this assumption pretty safe.
The pattern of growth fits a diffusion S curve (Logistic curve) as closely as ever:
Note that the curve continues to rise even into 2020, and that this is the US only.
The US is the most highly penetrated market but it's not the biggest. That would be China. So it's not surprising that two years after declaring US growth was over, IDC claims "China's smartphone market has reached saturation".
Chinese penetration is far below the US. It was estimated at 43% by the end of 2014. If we assume Chinese users are no less hungry for information than US consumers, then why should Chinese stop adopting the technology at less than half of US levels of use?
That would be risky.
This understanding of the maximum potential of a market — its highest level of user adoption — is crucial for product development. Paying attention to short term sales trends blinds you to the power of the job your product is hired to do. Your product's purpose is not to be sold, but to be hired. If your product is powerful enough, it can be hired for universal jobs and it should be desired by all consumers, not just the fickle.
Being patient for growth means that you can release features when the majority of users can absorb them, not just when early adopters choose to play with them. Often, early adopters offer feedback which is off-putting to later, mainstream adopters. In engineering and design one has to always make compromises. The right balance at the right time avoids overshooting a market or under-performing against competitors.
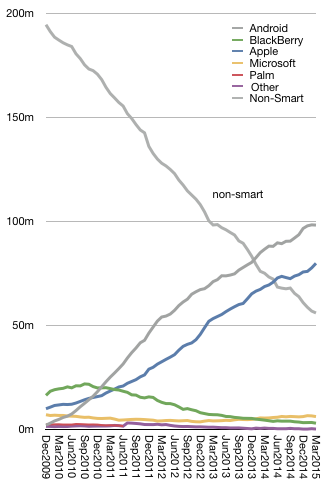
There are plenty of examples of getting it wrong (see the graph on the right above).
At this stage in the US market, the iPhone has more than 80 million (sampled) users. Android has about 100 million. It's still a growing market so apart from BlackBerry, ((Three million BlackBerry users in the US remain.)) the churn between the smartphone platforms is still minimal. The two main platforms are still harvesting non-consumers.
This will change of course. And when it does, the competition will shift from winning against non-consumption to winning against other-consumption or over-consumption. That post-saturation competition will be decided by brand loyalty as much as anything else.
---
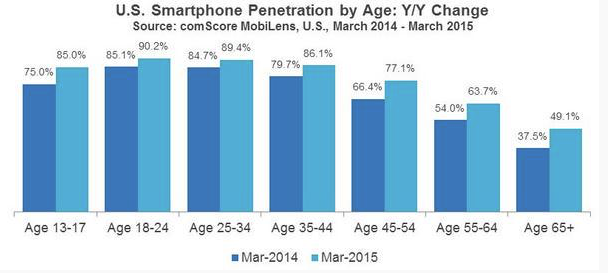
Update: comScore just published US Smartphone penetration by Age which offers some clues where smartphone hiring is still going on. (Note: <13 ages are not shown).
When we think about how great theories are built, one pattern seems to pop up repeatedly: breakthroughs are preceded by the insight into one (n=1) insight. The key observation of an anomaly that disabused us of a false assumption leads us to a far deeper causal understanding.
I’ll illustrate with a simple history of astronomy. For millennia, the theory of astronomy was informed by data provided by our eyes. The human eye could observe celestial objects with great acuity, and with great patience and record keeping the recognition of patterns in movements allowed the building of a vast database of predictions about the universe. We see this in many societies around the world: from Nordic seafaring navigators to Mayan calendars to Greek scholars. They all built predictive models and associated mythologies around the observable night sky.
These models included a construct called the calendar, the horoscope, navigation charts and even rare event predictors such as eclipses. Computing devices were even built to allow the calculation of these events by laypersons rather than a priestly class.
Our eyes remained the observational instruments underpinning all these theories. The world (and otherworld) view was informed and repeatably tested through eyesight. It wasn’t until the technology of lenses was developed (initially for a completely different purpose) that new instruments could be used to augment the eye.
These telescopes (and their brethren, the microscopes) changed many theories profoundly. The information that optical telescopes could convey allowed the observation of anomalies (e.g. planets) which changed the earth-centric view of the universe which, in turn, challenged much of the balance of power in society.
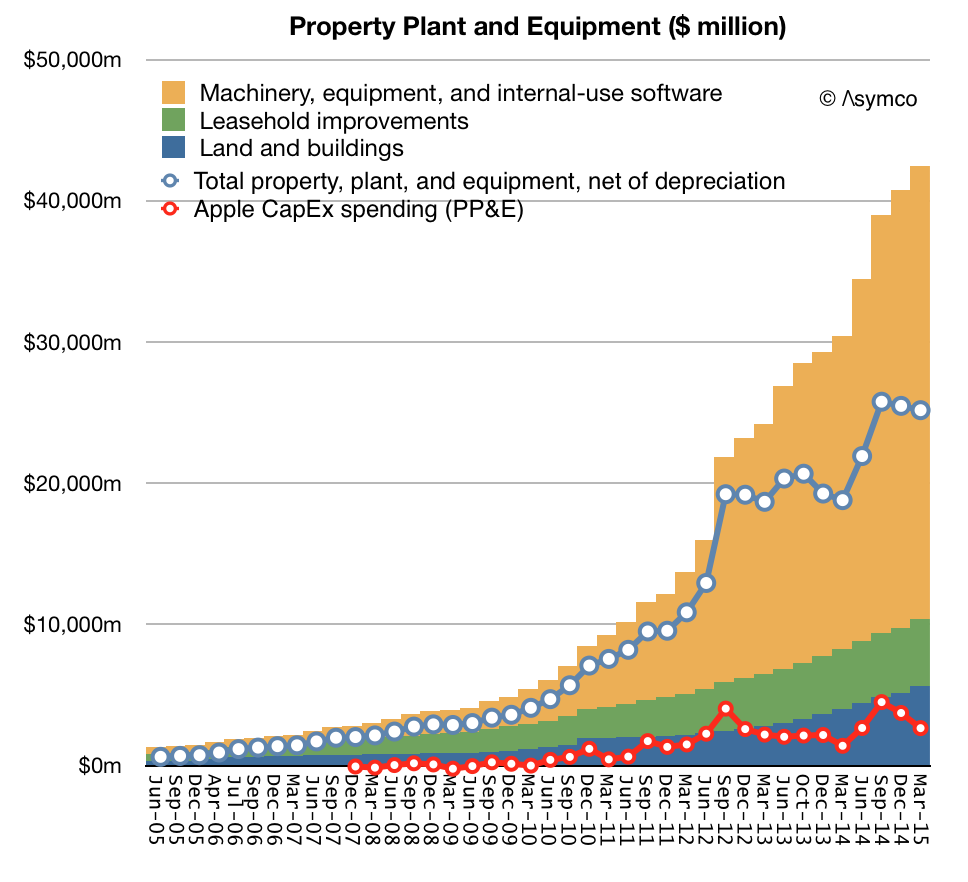
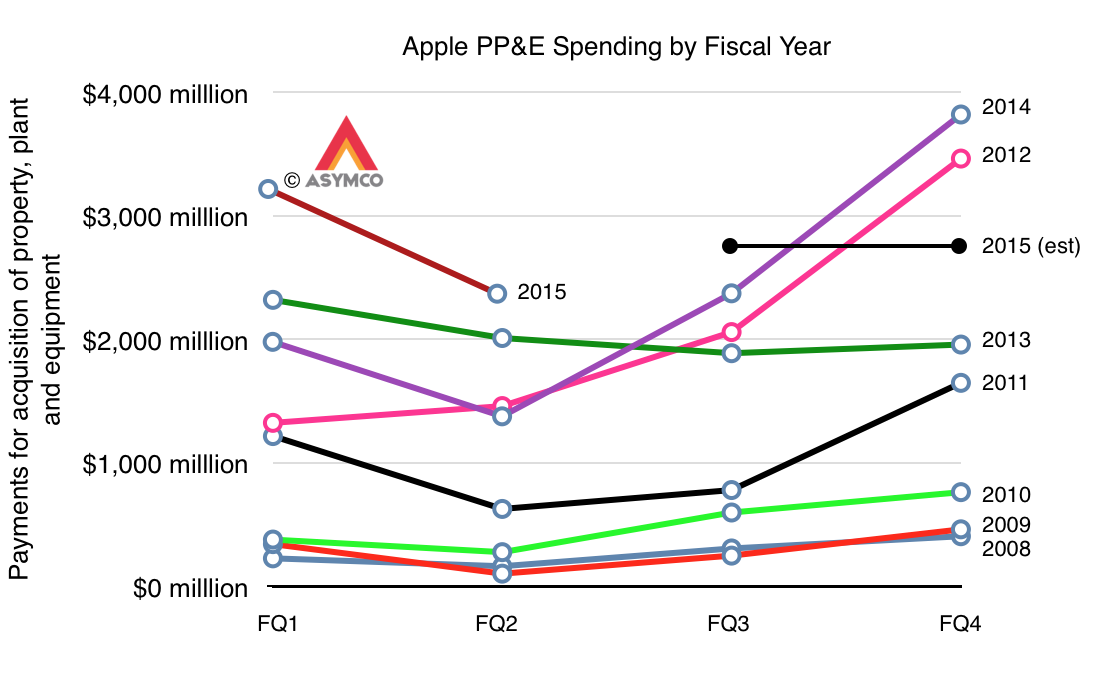
Of the $42.5 billion Apple spend buying capital assets ((Includes land and buildings $5.6b, Machinery, equipment and internal-use software $32.1b and Leasehold Improvements $4.7b)) more than half was acquired in the last three years. Net of depreciation these assets are currently worth $20.1 billion and the spending rate is about $12 billion per year.
This strategy of spending on capital assets is primarily in support of its particularly integrated approach to its product strategy. The purchasing of tooling for product manufacturing gives many benefits, including ability to deliver uniquely differentiated hardware, a predictable ramp and availability of parts throughout the product lifecycle.
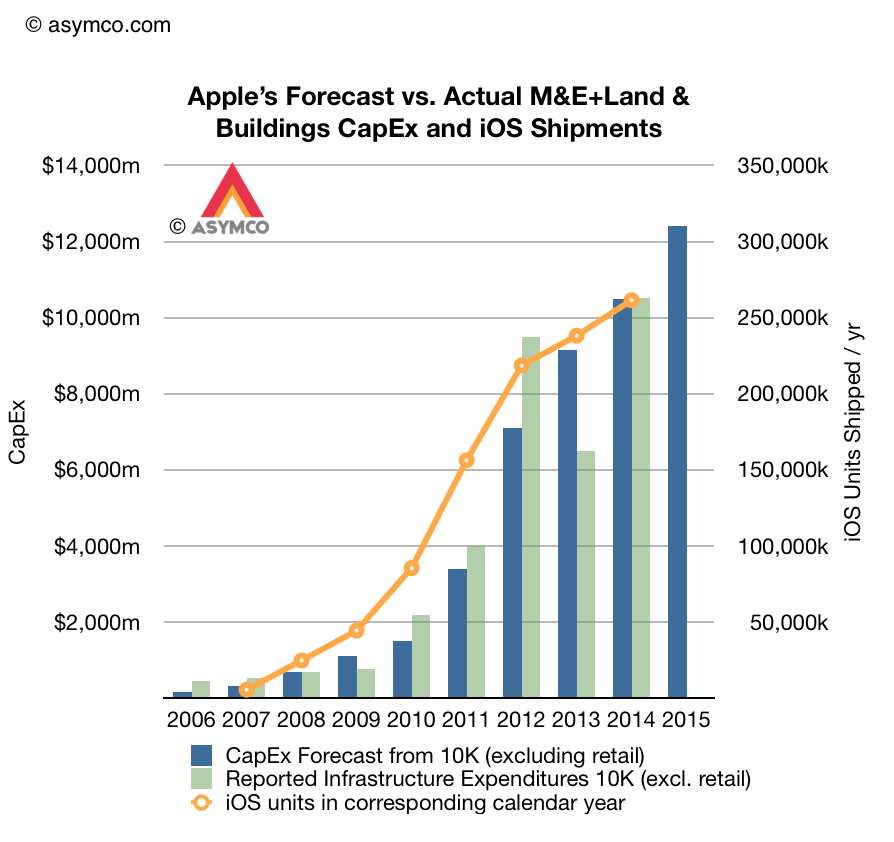
One additional benefit (for us) is that we get to inspect the allocation of resources prior to production and therefore we can more easily forecast the product's supply. Spending on tooling happens in advance of production and the company also provides full year predictions of its spending.
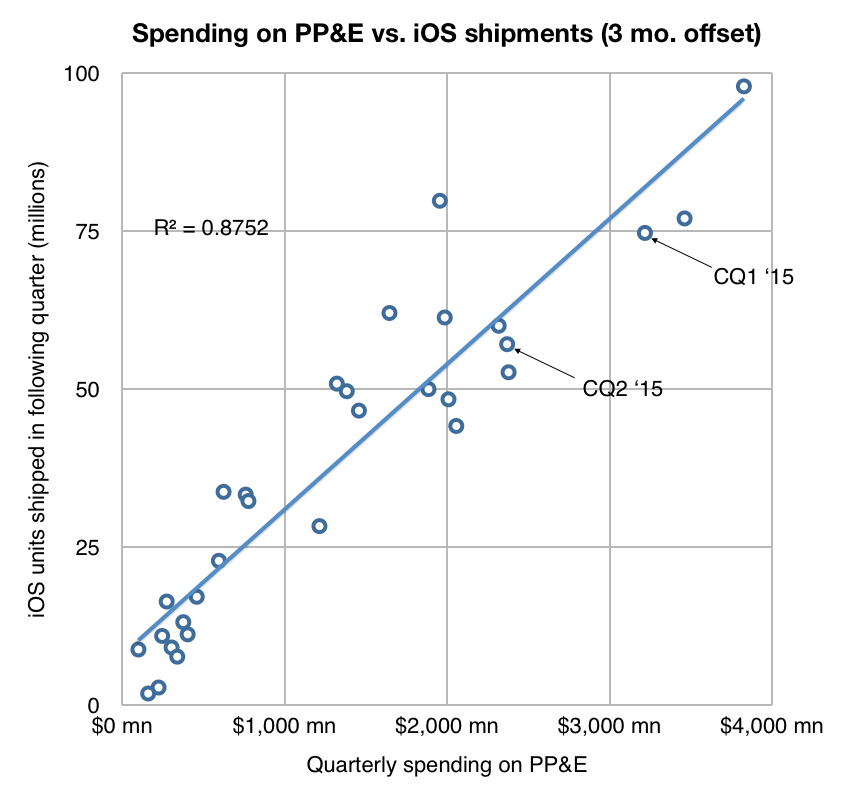
The fiscal year forecasts relative to actual spending is shown below. Note the correlation with iOS units shipped one quarter after the spending was booked.
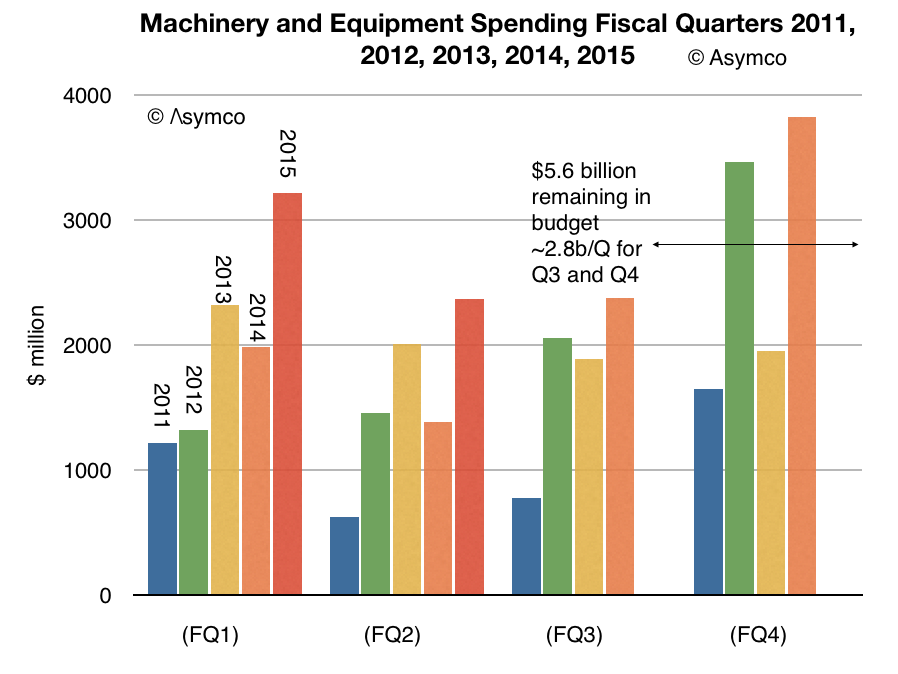
After reporting its second quarterly earnings, we received an update on what amount to half of the full year's spending giving us only two more quarters of variability. The current projections for the next two quarters imply about $2.8 billion per quarter spending.
The pattern from previous years is shown below for comparison. Note the Even/Odd year patterns.
The company also offered revenue guidance for FQ3 and therefore we can even make an educated guess on the next data point (57 million iOS devices) on the following graph:
The result is likely to be 120 million shipped between April and September.
Debug is a casual, conversational interview show featuring the best developers in the business about the amazing apps they make and why and how they make them. On this episode — Live from the Ull conference in Ireland Guy and Rene talk to Horace Dediu of Asymco fame about his background as a developer, his time at Nokia, and his current job-to-be-done: analyzing Apple.
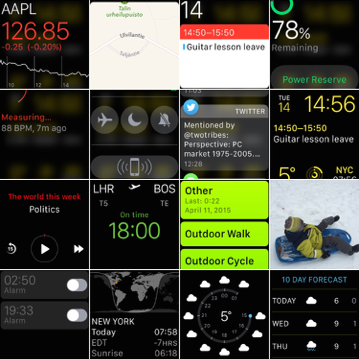
The Apple Watch offers a hierarchy of surfaces onto which software can compete for attention:
The Complication Layer
The Notification Layer
The Glances Layer
The App Screen
These surfaces are arranged in a hierarchy where the highest is the most accessible and the lowest is the least accessible. In a similar fashion we can consider the hierarchy of screens a person could reasonably be considered to be exposed to:
The Watch
The Phone
The Tablet
The TV
The Personal Computer
The Public/Work Computer
Note that this hierarchy is correlated to the size and hence the portability and persistence of proximity to the user. Each of the screens has its own "surfaces" which expose software to the user with various degrees of ease. For instance the iPhone has Notifications, Control Center, Home Screen, etc. The OS X personal computer has the Desktop, Notifications, the Dashboard, the Browser etc.
It follows then that software which is located at the top of each hierarchy on each device will have the greatest exposure to user interaction and that the device which has the nearest proximity to the user will provide the greatest value to software developers.
This implies further that the most valuable "real estate" for software will be the Complication layer on the Watch.
The software which receives either default placement there or which convinces the highest number of users to opt for placement there will have the greatest potential value. As suggested in my post on how the Watch will be valued, how software will be valued will be by the probability of its Settings being enabled for display on the Watch and its presence within Glances.
The jostling for position within the constrained real estate on the wrist will be analogous to the competition for positioning on the phone. You'll note that the winners on the phone were different than the winners on the PC. My bet is that the winners on the Watch will be different than the winners on the Phone.
Before its launch, I said that the Apple Watch would be as much a watch as the iPhone is a phone. Recall that when the iPhone was launched it was anchored on three tentpoles, one of which was being a phone and that when the Apple Watch was launched it was also anchored on three tentpoles, one of which was being a watch.
Realizing that on the iPhone the "phone" is but an app — one which I find populated with FaceTime calls rather than cellular calls and whose messaging history is filled with iMessage threads rather than SMS — I consider it safe to say what the iPhone is today not as much a phone as a very personal computer. And so the question is whether the Watch will quickly leave behind its timekeeping anchor and move into being something completely different.
I had the chance to use the Watch for a few days and can say that timekeeping is probably as insignificant to its essence as it's possible to be. It feels like a watch in the physical sense, looking good in the process (as the iPhone physically felt like a phone, also without being hard on the eyes)
However it does not feel like a watch conceptually. I find myself drawn into a conversation by its vocabulary of vibrations. I find myself talking to it. I find myself listening to it. I find myself glancing at information about faraway places. I find myself paying for things with it. I find myself checking into flights with it. I order transportation, listen to news, check live data streams and get myself nagged to exercise. It tells me where I am. It tells me where to go. It tells me when to leave.
Nothing ever worn on a wrist, or anywhere else for that matter, has done any of these things before. Not only are these things mesmerizing but they are done in a productive way on a wristwatch. In other words they are done in a mindful way.
Cynics may say it does too little. Philistines may say it does too much. But for me it does just what I want it to do when I want it done. The things which are not done stay out of the way. This discretion is just as important as the effectiveness of action.
Even more remarkably, this tasteful minder is offered not to a fortunate few but to millions of people of average means. In the true sense of technological democratization, Apple Watch is a phenomenon for mass consumption.
Its launch needs to be understood as a watershed event. It could be compared to the launch of the Mac or the iPhone but it is different as much as it is the same.
The product has a completely different character. It tries not to do more but to do less. But that which it does is more meaningful, more thoughtful. We talk of computing speeds and network feeds but we spend much more time and money to visit people who have little to say and say it slowly. We value charm and wit more than bandwidth and throughput. We are drawn to beauty more than to speed. This is what this computer captures.
A maxim of the computing of the 21st century is that the closer the machine is to us the more we value it. It does not get rewarded for being fast but for being a companion. It does not get valued for features but for beauty. It does not get hired for power but for control. It does not get worn because it's smart but because it's clever.
People understand these tradeoffs instinctively. They are not concepts that need selling. The product speaks plainly of itself and its success is therefore guaranteed.
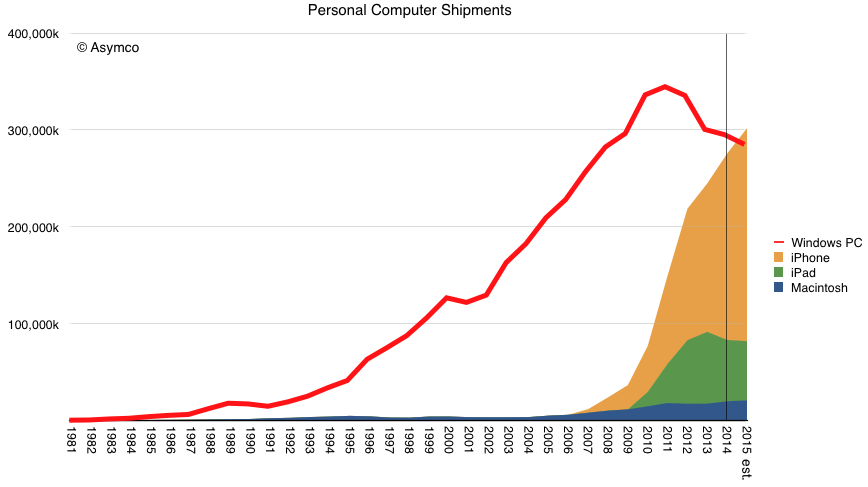
The history of the Personal Computer market (since 1981) is shown below:
Note that I added a forecast for 2015. Data from Gartner shows Windows PCs declining at a 6% rate in Q1 with a full-year forecast of -2.4% (including OS X). Assuming 20.7 million Macs, the Windows PC market will decline to 285.6 million units (from 295 million in 2014). My estimate is that iOS and OS X combined shipments will total about 302 million.
If this rather conservative forecast is correct then in 2015 Apple will ship more iOS and OS X computers than all Windows PCs combined ((This excludes iPod touch, Apple TV and Apple Watch. PC data is from public Gartner press releases.)) .