According to the latest comScore survey data, 98 million Americans above the age of 13 don't use a smartphone as their primary phone. That's 41% of US mobile phone users.
What's more, 2.5 million more people first started using smartphones in the three month period ending May vs. the three month period ending in April.
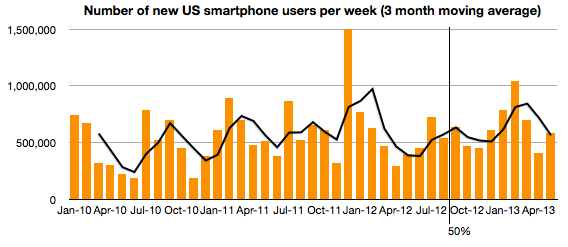
The switching rate to smartphones is shown below:
It shows the number of new-to-smartphone users who switched every week. It can be considered the "speed of adoption". The latest figure is 583k/week, above the 572k/week average maintained over the last 41 months.
[I also added a three period moving average which shows a seasonal change in adoption. I also added a vertical line showing the point when 50% penetration was reached (August 2012).]
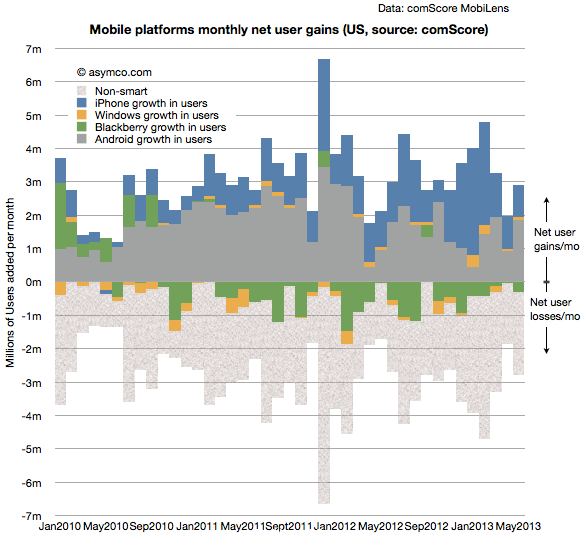
The switching rate by platform is shown in the following graph:
The data shows that churn between platforms (except for BlackBerry) is still negligible and that the majority of user losses can be attributed to non-smart devices.
To summarize, with penetration now at about 60% in the US, the rate of adoption of smartphones is not slowing in any perceptible way.
So not only is there no saturation, but there is no slowing of adoption of smartphones in the US, the most penetrated large market.
Globally, the penetration of smartphones is less than half of that in the US. About 4 billion people are about to switch.
Of course, they may not be willing to switch to what is currently offered to them in the market, but then again, the billion or so who adopted iOS and Android phones did not switch when the alternatives were BlackBerries, Palm, Symbian and Windows Mobile devices.
Apple has hired a new VP who will report directly to Tim Cook. Paul Deneve is cited as having responsibility for "special projects" and will report directly to Tim Cook.
The previous roles as a manager in luxury brand companies has led to a great deal of speculation about what new projects Apple could be working on that might also fit this new manager's background and title.
The most commonly cited speculation is around the iWatch or TV product lines (with some surprised that he will not be heading Retail.)
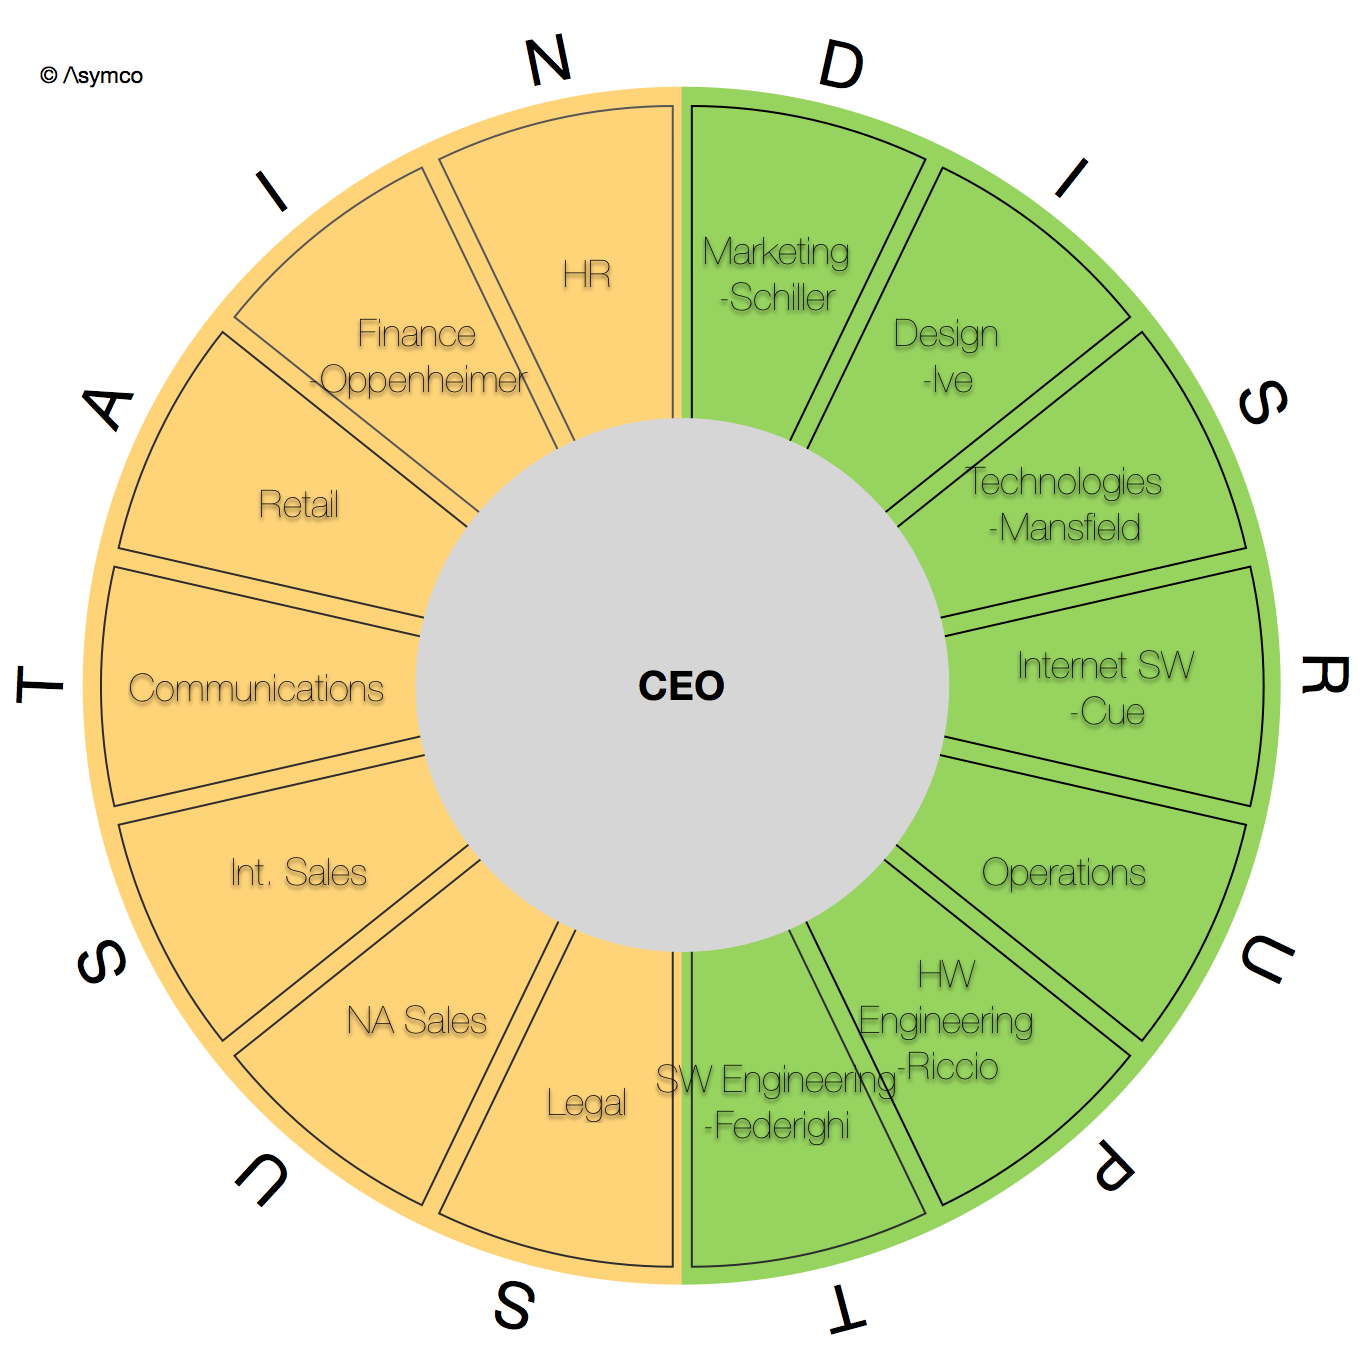
Although reading "luxury product CEO" and concluding "new luxury products" seems logical, a little knowledge about how Apple is organized dispels this notion. And a little knowledge happens to be about all we have, as Apple's organization is one of its most closely guarded secrets. Even employees at Apple have little idea of how the company is organized. What we do know is summarized into this org chart:
I've taken the liberty of splitting Tim Cook's direct reports into "Disruptive" and "Sustaining" functions—which I admit is a bit cheeky—but the point is to separate the product creation functions from the management and administrative functions of the organization[2].
When seen in this light, the first observation is that there is no "product business" ownership. Schiller's Marketing function includes product marketing by product line, but these are not business ownership roles (product marketing mostly deals with how products are positioned, promoted, priced, etc.)
There is no "head of devices" or "head of iPhone". Put more plainly, there is no organizational consistency with how the company reports its financial performance.
So it would make little sense to add a new direct report to this chart that did have a specific product ownership (or creation) role. Product is a "horizontal" responsibility for which every function is partially responsible.
In lieu of this, my reading of the chart shows another function for which there seems to be no leader: brand. Brand management is a crucial function in consumer-facing companies, and many brands-oriented companies orient their organizations (and power) around brand mangers.
In years gone by I would have said that Brand management was Steve Jobs' direct responsibility. Today I would say that it's something that needs a direct manager. This is something for which Paul Deneve might be well suited.
---
Notes:
The last chart published on this topic is from 2011.
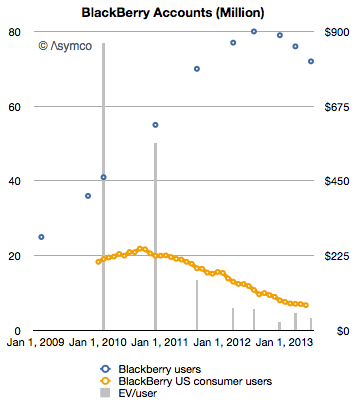
Last week BlackBerry announced that it had 72 million subscriber accounts. The current market capitalization is $5.4 billion and enterprise value (i.e. excluding net cash) is about $2.8 billion.
That implies a net present value of about $40 for each account. This is quite a drop from early 2010 when the value was $866.
The graph of BlackBerry subscriber accounts and EV/account is shown below:
I've also added a graph showing a derived value of US consumer BlackBerry users (derived from comScore's survey data).
There are several patterns which intrigue me:
First, the peak in US consumption seems to have happened about two years prior to global peak (lending credence to the notion that the US is a smartphone market "crucible".)
Second, that the collapse in value per user occurred in advance to the peak in users. This is, of course, linked to other user base leading indicators such as device sales momentum. But the drop indicates that there was no perceived value in the BlackBerry install base to begin with. As devices went, so did the company.
Third, this same lack of perceived value seems to be present within the Apple ecosystem (see below), where user value was cut to a third within a few months
.
In the case of RIM/BlackBerry, the drop in value per user accurately foretold the drop in user base. Does the drop in value per user for Apple foretell a reduction in users?
So far, iOS user base (as proxied by iTunes accounts) continues to expand, even in the US.
After having "taken the show on the road" and spending an inordinate amount of time giving presentations during the last year I came to the conclusion that what remains less than good enough for presentations is the variable quality of projectors.
The problem is not just quality of image but also the unpredictable size of screen, how far it is from the audience, how poor the contrast or color reproduction might be and to what degree there is support for wireless connections.
When presenting detailed, information dense graphs, these quality issues become presentation killers and not only do they result in poor retention for the audience but decrease the confidence of the presenter, leading to a vicious cycle.
The answer is not to lug around your own projector because many times the venue will not accept it, other times the image "throw" is not matched to the screen and it's a pain to set up and transport.
What I think needs to happen is that the projector needs to be disrupted.
This is where the iPad and Perspective come into play. When presenting using Perspective we have the ability to "airshow" or present directly to the (iOS) devices that the audience has with them.
This way not only the presenter's screen is "mirrored locally" but also the direct manipulation and choreography of the data reveal is instantly visible. You can see a fragment of how it works in this test:
This is the technique we use at the Airshow event and it has proven to work well even with large audiences. To see it in action (and to learn how to develop presentations into cinematic experiences) join us at the next Airshow in Chicago.
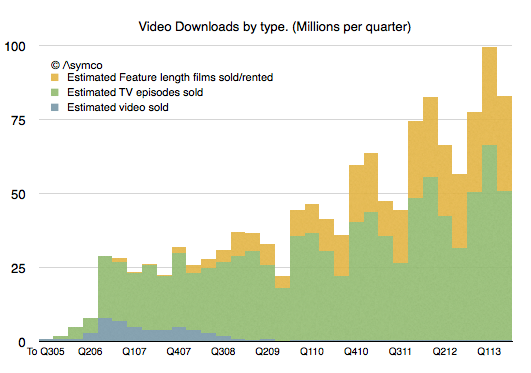
It's been five years since we had an update on TV show downloads and six years since we've had an update on movie downloads from Apple. In Q3 2008 Apple announced 200 million TV show downloads and in Q2 2007 2 million movies. That's a long period with no information making a tough extrapolation to the present.
Nevertheless, I tried. My estimates for these two quantities were 963 million TV Shows and 108.2 million movies to date.
So I was quite surprised to see that figures for both TV show downloads and Movie downloads were published today. The figures were 1 billion and 380 million respectively.
My TV show forecast has proven to be very accurate but I severely underestimated movie download rates. Apple states that the movie download rate is 350k/day. My estimate was only about 126k/day.
After adjusting for the new data, the picture of downloads that emerges looks like this:
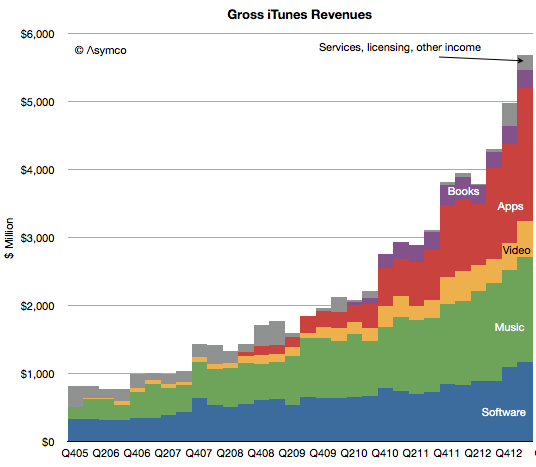
The overall iTunes gross revenues by sub-component becomes:
As a result, my new estimate for the rate of spending on iTunes video is about $1.75 billion/yr. This is much more substantial than prior estimates mainly because movies are much more valuable. A tripling of the download rate shows up as a significant rise in the profile of video vis-à-vis the other media types.
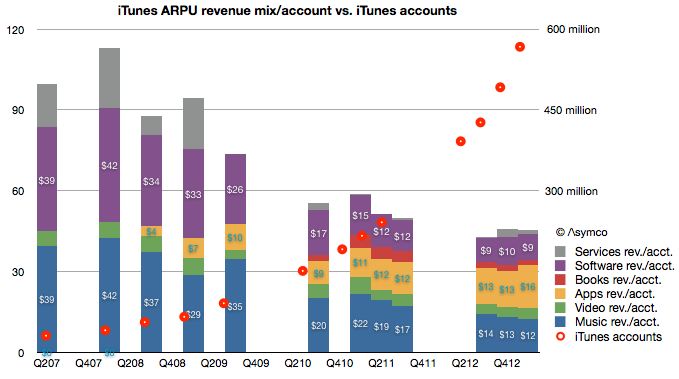
Apps and software are firmly defined and music was somewhat clear. The upward adjustment in Video means that I have to reduce either Music or services. I presently am reducing service revenues but might adjust music as well.
The overall picture of iTunes is becoming clearer every day. We have more information about number of users (575 million), what they spend on media and software and services ($20 billion/yr.) and, increasingly what they spend on each media type (about $9/yr on Software, $2/yr on books, $16/yr on apps $12/yr on music and $4/yr on video.)
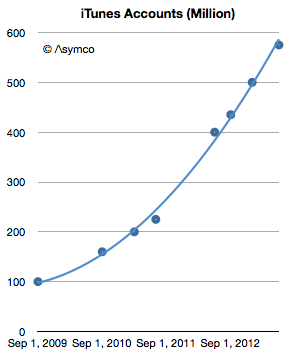
This week Apple announced that iTunes has 575 million accounts. This is the 8th update (that I know of) over the last four years. The history of this data is shown in the following graph.
The number of accounts has increased by almost a factor of six since late 2009. It amounts to an account growth rate of about 500,000/day or 44% compounded annually. Not bad, but along with this increase what happened to revenues per user?
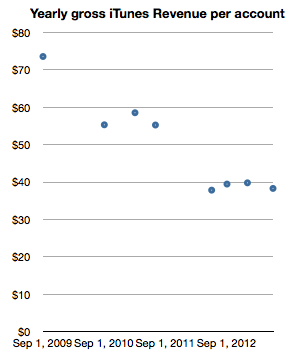
Looking at iTunes revenue (gross) reveals a picture of revenues/account, shown below:
This can be read as: "Each of the current 575 million accounts generates about half the revenue of the 100 million accounts of 2009." One would expect such a decline as an user base expands and this approximate 50% decline in revenues per account seems reasonable for a six-fold base increase. In absolute terms the graph shows that an iTunes account generates about $3.2/month in transactions.[1] Put another way, during the last year, an average of $40/yr of economic value is generated by every iTunes account.
Stretching further, one could also use the 575 million iTunes accounts as a proxy for "the Apple customer base". The assumption would be that iTunes accounts are attached to some Apple product, be it an iPhone, iPod or Mac. As a bounds check, a total of 865 million Apple devices (which interact with iTunes) have been sold since 2007. Assuming 575 million users does not seem to be a contradiction.
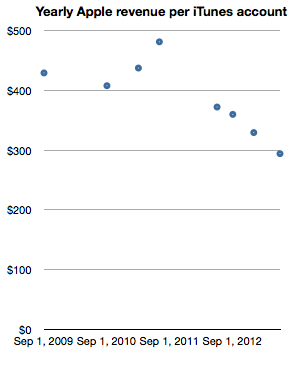
The logic deployed would be that it's unlikely for a consumer to have an iTunes account without owning or using an Apple product. If we take this leap in logic then it would make sense to measure Apple (not just iTunes) revenues per iTunes account. In order to smooth out seasonality I took trailing twelve months' average quarterly revenues and measured the following company revenues per iTunes account.
Note again the reduction in revenue per "customer" as the base grows. The reduction is less pronounced however, with about one third lower spending for a sextupling of the base. One can read this graph as "Three years ago an Apple customer used to spend $400/yr on Apple products but as the number of users increased six-fold the spending decreased to about $300/yr per customer."
The practice of valuing a company by the rate of spending of its customer base is not uncommon, especially when the customer base is relatively loyal. Apple emphasized the importance of customer satisfaction (and, implicitly, loyalty) during its WWDC presentation. It was singled out as the most important metric they track. So perhaps valuing Apple itself on the basis of repeat purchase behavior should be considered.
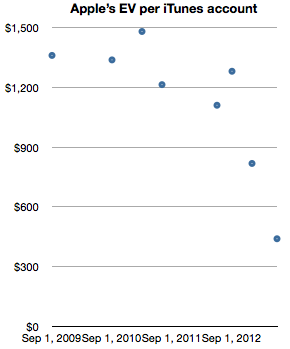
When framing the value of of the company itself as a function of users (in the form of iTunes accounts) we get the following graph.
The graph measures the Enterprise Value (i.e. Market cap minus cash) on a per-customer (i.e. iTunes account) basis.
It shows that for a number of years—from 2009 until late 2012—Apple's users were valued (implicitly by the stock market) as likely to create a net present value of about $1200 in earnings. The current value is about a third of that, or $440 in earnings. Today's expectation is therefore that each current customer will buy the equivalent of 1.8 iPhones. And nothing more, ever. A few months ago it was expected that each customer would buy three times as much.
Although the rate of spending of each customer is decreasing, the number of new customers is increasing more rapidly. As this is happening the company's equity is being priced such that an Apple user is considered less than half as valuable as she used to be—from 3.2x revenues to 1.5x revenues. This change in user value has been quite abrupt, happening only within the last nine months. What could justify a drop in user value would be a drop in customer satisfaction or loyalty. So far, I have seen no evidence of this happening.
--
Notes:
Note that these revenues include App Store, Music Store, TV Shows, Movies, iBookstore, Mac App store, and Services (including iCloud). Some of this revenue is not reported as part of Apple's statement of operations since some content is treated with an agency model.
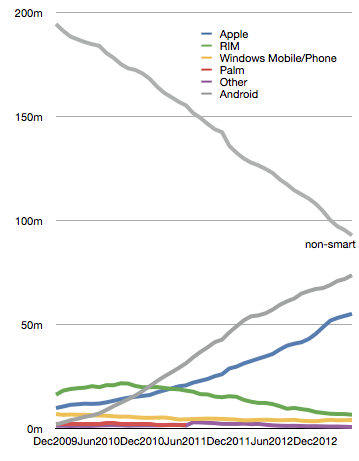
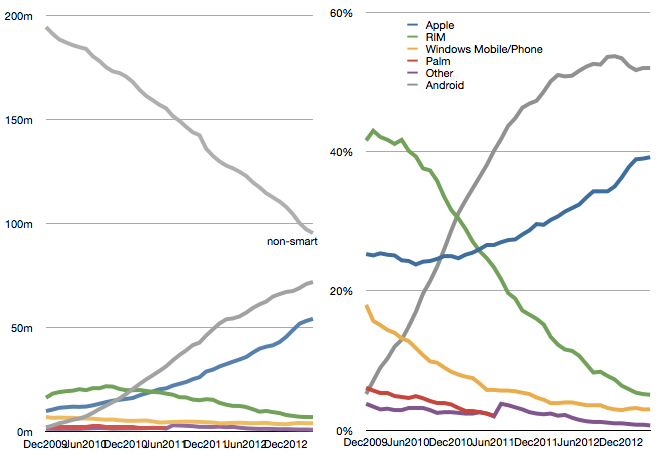
The latest comScore US smartphone install base data is in and there are few surprises. iPhone has reached a new record high penetration (39.2%) and user base (54.3 million). Android has reached a new high in user base (72 million) but share at 52% is below the peak reached in November 2012.
This pattern of gradual iPhone share gain in the US has been consistent for over two years even while Android has catapulted into an overall lead. The surprising thing is how Android seems to have peaked in share. There are still 95 million non-smartphone users and there seems to be headroom for growth even though the other platforms have been tapped out. But it does not seem that Android phones have any particular advantage over iPhone. My hypothesis remains that as price is taken out as a differentiation, the adoption of iOS is slightly higher than Android.
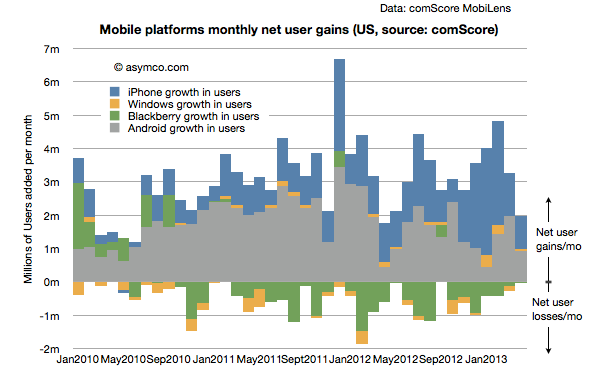
Another measure of market performance is the implied net platform user gains which is shown below:
It shows that iOS added more users in the last few months than Android.
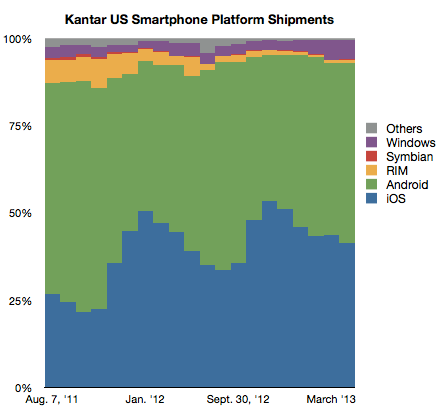
The problem is that Kantar Worldpanel measures shipments and their share data shows a seemingly different picture.
In their data Android is shown as selling more units during January through April while Apple sold more during October through December. Of course we don't have the absolute number of units so can't see the effect of higher holiday overall sales volume. Nevertheless, the balance of growth seems to be disproportionately in favor of Android relative to the data from comScore.
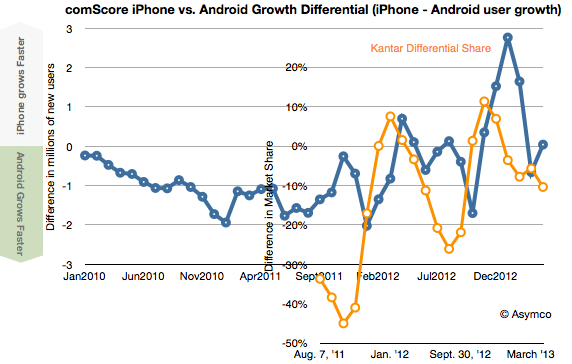
To look at the situation more closely I measured the differential in user adds for comScore and the differential in market share for Kantar's data. Then I overlaid the two differentials so that months are matching, as shown below:
There is a similarity to the frequency of oscillation with comScore data showing a delay (as would be expected since their data is sampling over a three month period). However, we are still facing a vertical offset where there is apparently more growth bias for iPhone in the comScore data.
Possible factors which might be explanatory:
Methodologies used. comScore data excludes ages below 13 and non-personal devices (business expensed phones.)
Replacement sales are invisible in comScore data since the user base does not change when phones are replaced (and old ones are discarded.)
Missing data from Kantar. Given their survey methods it's possible that their panels miss some market segments.
Last week Frank X. Shaw, VP of corporate communications at Microsoft stated:
... most of the people around me were using their iPads exactly as they would a laptop – physical keyboard attached, typing away, connected to a network of some kind, creating a document or tweet or blog or article. In that context, it’s hard to distinguish between a tablet and a notebook or laptop. The form factors are different, but let’s be clear, each is a PC.
Actually this "admission" that iPads are PCs is not something new. Steve Ballmer made the same assertion in 2010 pre-iPad (though calling them slates). Arguably, the notion that tablets are PCs has been dogma at Microsoft for over a decade and Windows running on all form factors has been a strategic guiding principle.
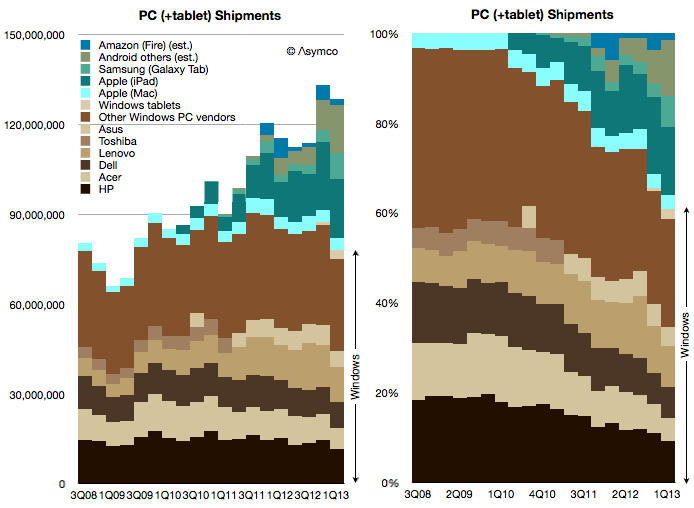
Which is why I've always added the tablet data to the PC data to create a picture of the "personal computing" market. And this is what that picture looks like today:
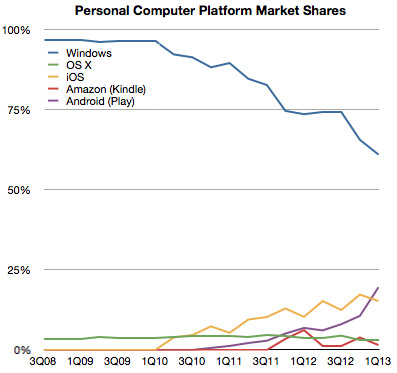
Note how the share of various platforms has evolved over this brief time span:
Seen this way, Windows has now reached 60% market share and it's likely to dip below 50% during this year. What happens beyond then is harder to imagine. If Windows tablets start growing as fast as the tablet market overall then Windows could stabilize in share. But if Android and iOS tablets follow their phone brethren in growth then it will be far harder for Microsoft to maintain share. But is that cause for concern?
Not necessarily.
The total computing market[1] is likely to expand to over 4 billion users with 1.5 devices per user in the next five years. That expansion implies that 20% share equals more than one billion devices, making such an ecosystem "good enough" for the average developer. It certainly has been good enough for Windows developers to date and they have kept hiring it throughout the new mobile app revolution.
So even if Windows dips to only 20% of the world's computing market it will still be perfectly "viable" for some time to come.
--
I define the computing market as the total number of devices which have (a) a CPU (b) a broadband connection (c) a native application execution environment which is open to third party apps. This definition implies the presence of an "ecosystem" which is bound specifically to a platform.
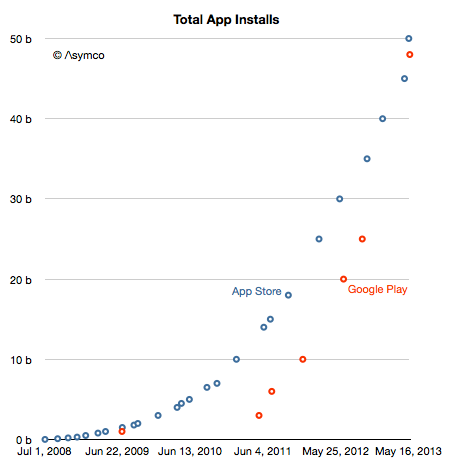
By the end of May there will be 100 billion mobile apps installed on iOS and Android devices.
Not bad for a five year old medium.
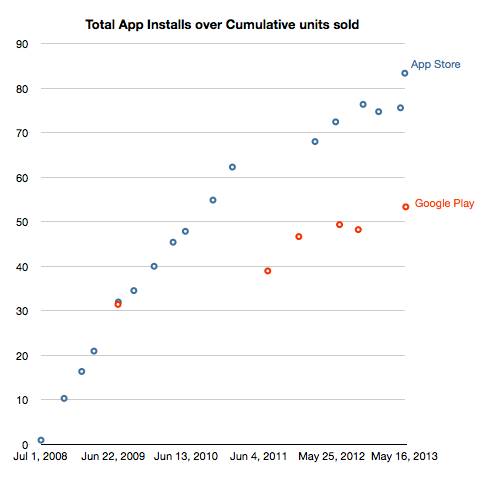
With respect to attach rate, the total downloads/install base are currently 83 apps per iOS device sold and 53 apps per Android device activation. The history of this is shown below:
The sheer weight of Android units will generate more downloads but on a per device basis the iOS devices do seem to consume more apps and the gap is not narrowing. What would be valuable would be the revenue per app on Play (the figure for iOS is about $0.23). That, as far as I know, remains unknown.
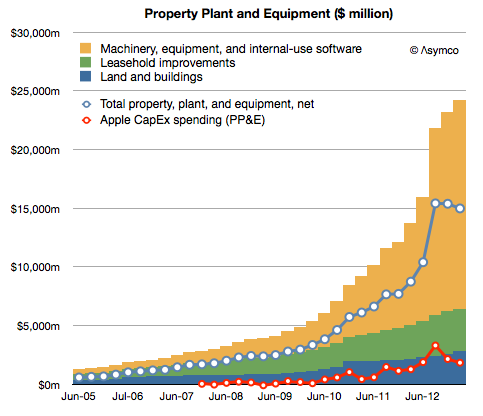
Although discussions related to how Apple will "use its cash" center on acquisitions of companies, Apple's has been busy acquiring, just not companies. It has been buying capital equipment. Capital meaning (in the original sense of the word[1]) the means of production.
Since the launch of the iPhone Apple has spent $21.1 billion on the acquisition of property, plant and equipment. The company has already stated that they will spend another $10 billion or so for the current fiscal year. This has been mostly machinery and equipment used in manufacturing.
The result in asset value is shown below:
[The Net value, shown as a blue line, is after accumulated depreciation. The red line represents spending as reported on the cash flow statement.)
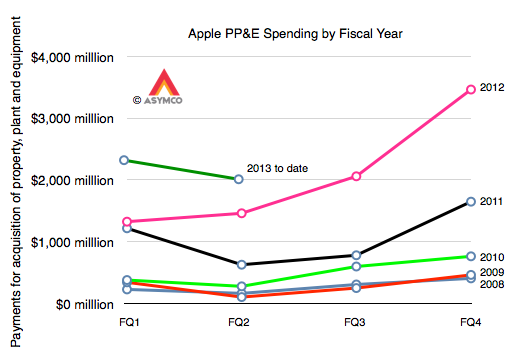
The change in spending year/year (fiscal) is shown in the following graph:
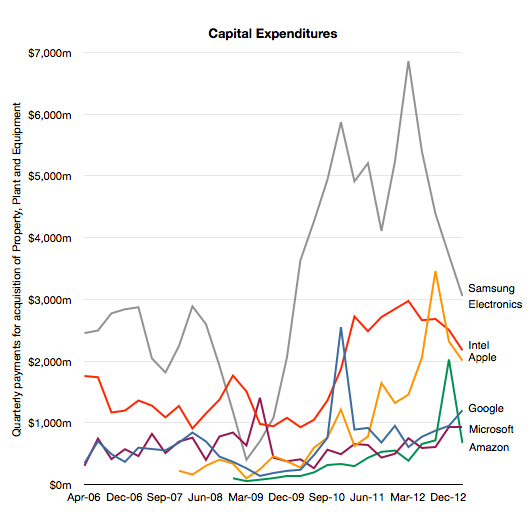
So these are very large numbers, even compared to other capital-intensive semiconductor manufacturers:
Given this enormous spending one could imagine it's the subject of intense scrutiny. However the only question on the subject that I've ever seen was from Steve Milunovich of UBS to which Peter Oppenheimer, CFO offered an explanation:
Steve Milunovich - UBS …second question would be on CapEx, you spent almost as much Intel does. I think you guys have said you’re not going to become vertically integrated per se but in a sense you are since [you buy] equipment for your partners, could you talk about the strategy here and how much of a differentiator this gives Apple in terms of your ability to ramp new products over time? And maybe a little bit more about how deep you will go in terms of semiconductor components for you, etc.?
Peter Oppenheimer - Chief Financial Officer Sure. Steve it’s Peter. We expect to spend about $10 billion in CapEx this fiscal year that will be up little under $2 billion year-over-year. We expect to spend a little bit under $1 billion in the retail stores. And the other $9 billion is spent in a variety of areas. We are buying equipment that we will own that we will put in partners’ facilities. Our primary motivation there is for supply, but we get other benefits as well. We are also adding to our datacenter capabilities to support all the services that Tim spoke about in answering Ben’s question and in facilities and in infrastructure. So, that’s where the capital is going.
I would say that this is not a very satisfying answer, which is why I thought it merits further questioning[2].
Alas, no.
Whereas there is a constant clamoring for Apple's to use its cash to "acquire" or "buy" something, anything, maybe people not looking hard enough. If you need the satisfaction that comes from knowing that money is being spent, a glance at the Cash Flow statement and Balance Sheet shows that Apple buys the equivalent of one Yahoo! every three years[3].
The main difference with this type of acquisition is that there is less value destruction. Using the capital to ensure access to capacity, differentiation and hence a high margin is better than writing off the goodwill after a few years.
--
The term capitalism, in its modern sense, comes from the writings of Karl Marx
I am prepared to be alone in this quest as it seems to merit no mention from others
Tim Cook was asked the first question (on the iPhone portfolio). His answer is paraphrased here:
We haven't so far. That doesn't shut off the future. Why? It takes a lot of really hard work to do a phone right when you manage the hardware and software and services in it. We've chosen to put our energy on doing that right. We haven't been focused on working multiple lines.
Think about the evolution of the iPod over time. The shuffle didn't have the same functionality as other products. It was a really good product, but it played a different role — it was great for some customers it was strikingly different than other iPods. The mini played a different role than the classic did. If you remember when we brought out the mini people said we'd never sell any. It was too expensive and had too little storage. The mini proved that people want something lighter, thinner, smaller. My only point is that these products all served a different person, a different type, a different need. For the phone that is the question. Are we now at a point that we need to do that?
…
At a macro level, a large screen today comes with a lot of tradeoffs. When you look at the size, but they also look at things like do the photos show the proper color? The white balance, the reflectivity, battery life. The longevity of the display. There are a bunch of things that are very important. What our customers want is for us to weigh those and come out with a decision. At this point we think the Retina display is the best. In a hypothetical world where those tradeoffs didn't exist, you could see a bigger screen as a differentiator.
Full interview here, answer begins around minute 37.
Here is how I interpret the answer:
The iPhone portfolio may still arrive. It hasn't so far because the cost/benefit is not there for Apple. On one hand it would take a great deal more sourcing effort and risk while dealing with constraints in production. On the other it would not not offer meaningful additions to the customer base. At least so far. The economics and the demand may change (or have changed) and the time will come for a broader portfolio.
The comparison to iPod is not entirely appropriate because as a music player, the iPod had a relatively small set of jobs to do. It was hired for exercise, escapism, isolation, etc. It was not hired for apps and services which extend the medium itself. In other words it was not a computer. As a computer, the iPhone has a near infinite set of jobs to be done and it's the hundreds of thousands of apps which help it perform them. But as a result the iPhone needs to conform to the dynamics of ecosystems and that means consistency of APIs and user experience. It cannot vary in terms of input methods, or be below minimum requirements of screen size or memory and power.
Because of the rapidly expanding job space, Apple believes the iPhone was not "good enough" for all these years. The improvements shipped for each generation were all "meaningful" in that they were valuable and absorbable. Users would use the new features (like better screens, cameras, battery, etc.) and they were willing to pay for them (as evidenced by the sustained high average price).
On the question of what the extension might be, changing screen size is one dimension but it has to be balanced by performance gains that don't detract from other dimensions. Engineering is all about compromise and consumers pay Apple to make these compromises in an intelligent way. Apple does not come to an answer to the question of balance by launching many products and seeing what works. It cannot afford to dilute its brand with a long list of failures. Other brands may not be affected by trial-and-error approaches to the market but they are discounted by the customer accordingly.