Asymco

Asymmetric Intelligence

Research

  1. My questions for Tim Cook

    Research · 252 comments

    Next week at AllThingsD's D11 conference in LA, Apple CEO Tim Cook will be interviewed by Kara Swisher and Walt Mossberg.

    Here are some questions I'm hoping they will ask:

    1. Why is the iPhone not sold as a portfolio product? Meaning, why, after six years, is there no iPhone product range being updated on a regular basis. Having a portfolio strategy is not only followed by every phone vendor but also by Apple for all its other product lines, including the iPad, which came after the iPhone. In other words, please explain why the iPhone is anomalous from a product portfolio point of view.
    2. There are more than 800 operators world-wide so why are there only about 250 of them carrying your phone? Competitors large and small (from BlackBerry to Nokia to Samsung) have cited relationships with more than 500 operators so Apple is being uniquely selective. My question does not stem from a lack of patience: this total number of iPhone distributors has not increased markedly for over a year. Are you limiting distribution through conditions placed on operators (like the availability of sufficient quality data services) or are operators finding the distribution agreement too onerous (e.g. too high a minimum order quota)?
    3. In 2012 Apple's capital spending has reached the extraordinary level of $10 billion/yr, higher than all but the most capital-intensive semiconductor manufacturers. This is unusual for Apple as it was less than $1 billion in the year before the iPhone launched. It's also unusual for Apple's competitors in phones, PCs or tablets. It's on a level matched only by semiconductor heavyweights. What is the purpose of this spending and what should we read into it leveling off at $10 billion for 2013?
    4. Depending on one supplier is an operational faux pas, and yet Apple has found itself in that situation with Samsung for mobile microprocessors. It may be excusable in PCs with Intel having an architectural monopoly but it's not excusable for a chip that you designed yourself and purchase in massive quantities. Why did you give Samsung such a concession, especially knowing their potential as a competitor vis-à-vis alternative suppliers who had no such potential? Does the answer have something to do with the previous question?
  2. Apple retail revenues per visitor reach new record

    Research · 42 comments

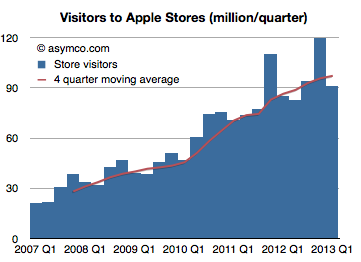
    In the US, on a sales per square foot basis, Apple retail continues to perform twice as well as Tiffany & Co., the second best retailer, and three times as well as lululemon athletica, the third best retailer.

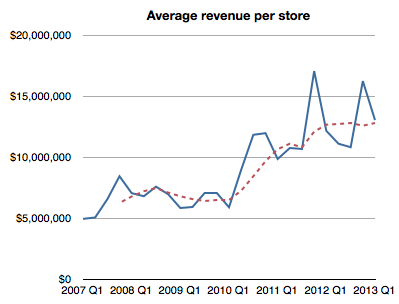
    The latest quarter showed a 7% growth in visitors and a new record revenue of $57.6 per visitor.

    Screen Shot 2013-05-20 at 5-20-12.14.23 PM

    As a result, the average revenue per Apple store per quarter reached $13 million, the highest level for a non-holiday quarter.

    Screen Shot 2013-05-20 at 5-20-12.16.39 PM

    Here are some additional metrics:

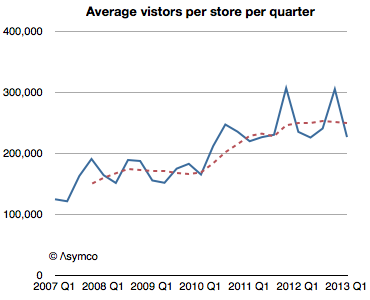
    Average visitors per store has steadied to 250,000 per store per quarter (average for trailing 12 months). This is a quantum increase from about 170,000 per store per quarter in the twelve months ending Q1 2010. The reason for this might be the increase in floor space of newer stores and the renovation of older stores. The new store throughput rate might be an upper bound due to fire regulations.

    Screen Shot 2013-05-20 at 5-20-12.17.38 PM

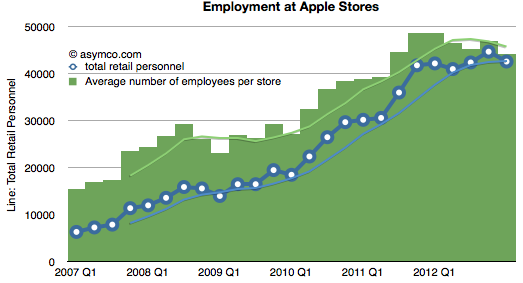
    Employment has steadied at about 110 per store. This is a remarkable increase from less than half this level in 2007.

    Screen Shot 2013-05-20 at 5-20-12.20.12 PM

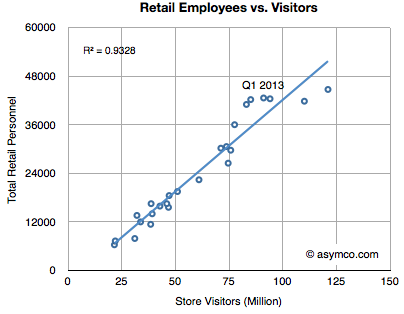
    Hiring remains closely correlated with visits with visitors per employee per quarter holding to slightly more than 2000.

    Screen Shot 2013-05-20 at 5-20-12.21.17 PM

    Profit per visitor also holding steady at about $12/quarter.

    Retail performance remains constrained by store size (hence maximum number of visitors) and the number of stores. The strategy seems to be expanding US stores while opening new stores outside the US.

    Screen Shot 2013-05-20 at 5-20-12.25.41 PM

    That would allow growth in visitors and hence in achieving the primary purpose of the stores: maintaining the brand's relationship with customers.

  3. The allure of iTunes

    Research · 130 comments

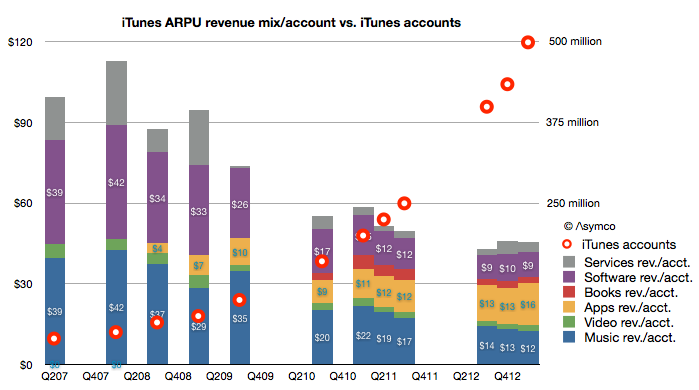
    My estimate of last quarter's iTunes gross revenues suggested a spending rate of $40 per iTunes account. It would make sense to consider how that figure changed over time. The following graph shows the pattern:

    Screen Shot 2013-05-14 at 5-14-9.49.40 AM

    You can read each bar in the graph as the total "ARPU" or average revenue per iTunes user[1].

    I overlaid a graph showing the total number of accounts as reported by Apple to the (retroactively) estimated revenue structure. Account totals are measured with the right axis and ARPU with the left.  Note that I also broke down each component of iTunes as currently defined (Music, Video, Apps, Books, Software and Services.)[2]

    The time frame covered is from Q2 2007, or the quarter prior to the iPhone launch. A few patterns emerge:

    • When there were no iOS devices (and hence no iOS apps) the revenues of iTunes consisted mostly of music sales. Those revenues were, on a per account basis, roughly comparable with Apple's Software revenues.
    • As iOS devices proliferated, the number of accounts (and users) grew. They doubled in the first two years (2007 to 2009) and doubled again in the following year (2010) and doubled again the following year (2011) and doubled again in the following 18 months. This rate of growth was accompanied by a reduction in the iTunes ARPU of about 50% (from $99 to about $45).
    • The reduction in ARPU has moderated in the last few quarters. ARPU fell 10% from $50 to $45 during the last doubling of accounts (from 225 million iTunes accounts to  500 million accounts.) In contrast ARPU fell 20% from $74 to $58 during the penultimate doubling (from 100 million to 200 million)
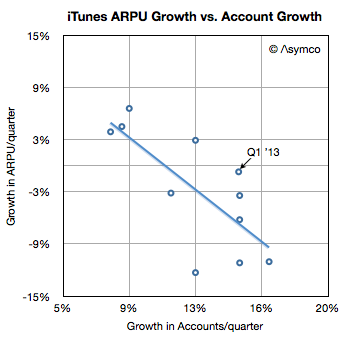
    • However, growth in accounts is broadly inversely proportional to growth in ARPU. In other words, the faster the growth in users the faster the decline in ARPU. The recent moderation in ARPU erosion is also coupled to a moderation in user growth (most recent doubling took 18 months vs. 12 months for previous doubling.) This is as would be expected as a broader, later user base tends to consume less than a narrow, early base. This can be seen in the following scatter plot:
    Screen Shot 2013-05-14 at 5-14-10.35.02 AM
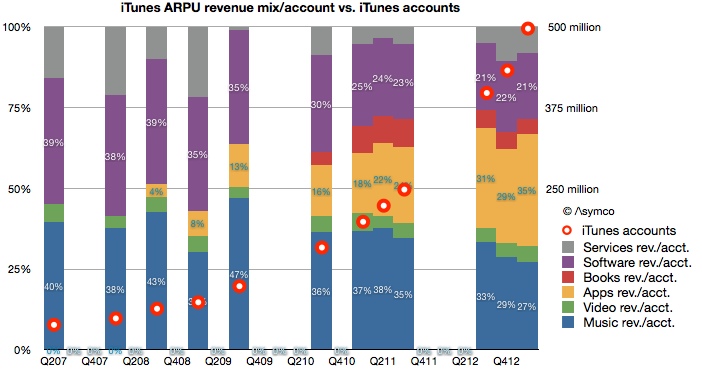
    • When seen as a percent of mix, Apps have grown to be the largest component of iTunes spending. Apps have 35% "share of wallet" while music has dropped steadily from 40% to 27% (or $39 to $12/yr.) This is shown in the following graph.
    Screen Shot 2013-05-14 at 5-14-10.34.45 AM

    As apps have grown to consume more and more of users' time it stands to reason that they should consume more and more of users' wallets.

    And as accounts reach one billion, we can begin to think about the disruptive impact on other media types. Whereas video, books and music are targeted to smaller user bases, apps are broadly consumed. Developers like Rovio or Supercell can offer their products to billions while TV producers can only hope for millions. Apps are becoming the universal medium for entertainment and iTunes the universal distributor.

    Talent is catching on to this faster than those who manage and distribute their work. The inevitable result will be a mass migration of talent away from the established content industries. Old media won't fade due to a loss of users. It will fade due to a loss of talent.

    --

    Notes:

    1. An account is not necessarily a user so perhaps more appropriately the acronym should be ARPA (average revenue per account). Unfortunately that acronym is taken.
    2. The complete model is available for purchase through Asymco Store.
  4. iTunes users spending at the rate of $40/yr.

    Research · 75 comments

    In the latest quarter the iTunes top line grew by 32%. Additional newly reported items:

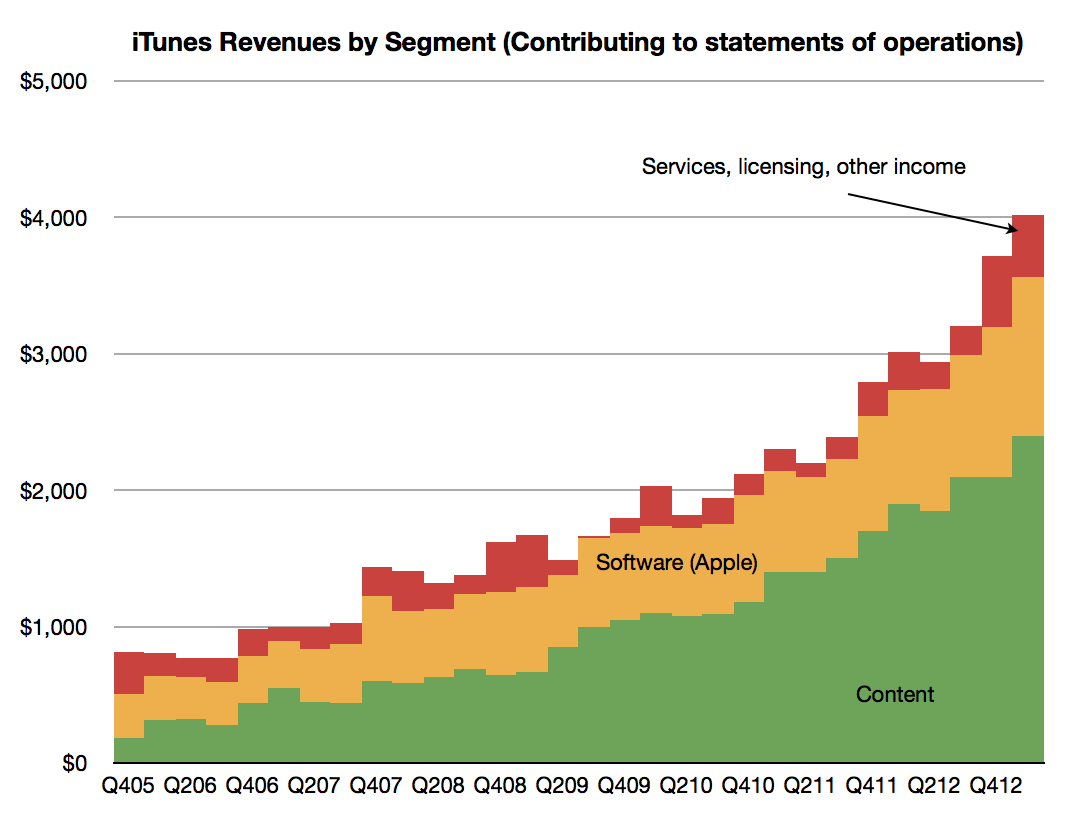
    • Quarterly revenues topped $4 billion (a new high) and the company suggests that this rate is maintainable by stating it has a “$16 billion annual run rate”. The pattern of revenues is shown below.
    Screen Shot 2013-05-12 at 5-12-8.12.30 AM
    • The content portion of iTunes revenues was $2.4 billion, up from $2.1 billion sequentially. Growth into Q1 is not unusual as many holiday iTunes gift cards are redeemed during January.
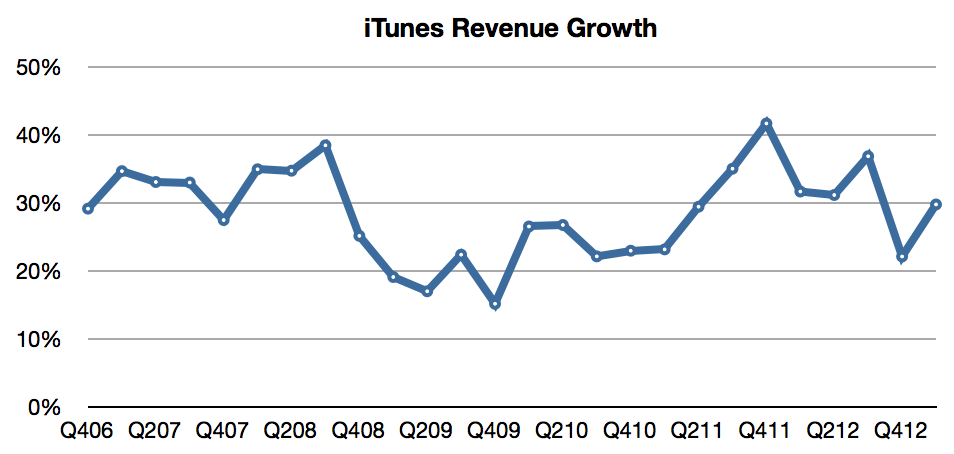
    • Revenue growth has been surprisingly steady, averaging 29%/quarter for more than six years.
    Screen Shot 2013-05-12 at 5-12-8.20.06 AM
    • Music is now available in 119 countries.
    • The Music catalog now consists of 35 million songs.
    • Movies are available in 109 countries. 60,000 titles are offered.
    • iBookstores are present in 155 countries offering 1.75 million iBooks.
    • There are iTunes App Stores in 155 countries whose residents make up about 90% of the world’s population.
    • iOS developers have created more than 850,000 iOS apps, including 350,000 made for the iPad.
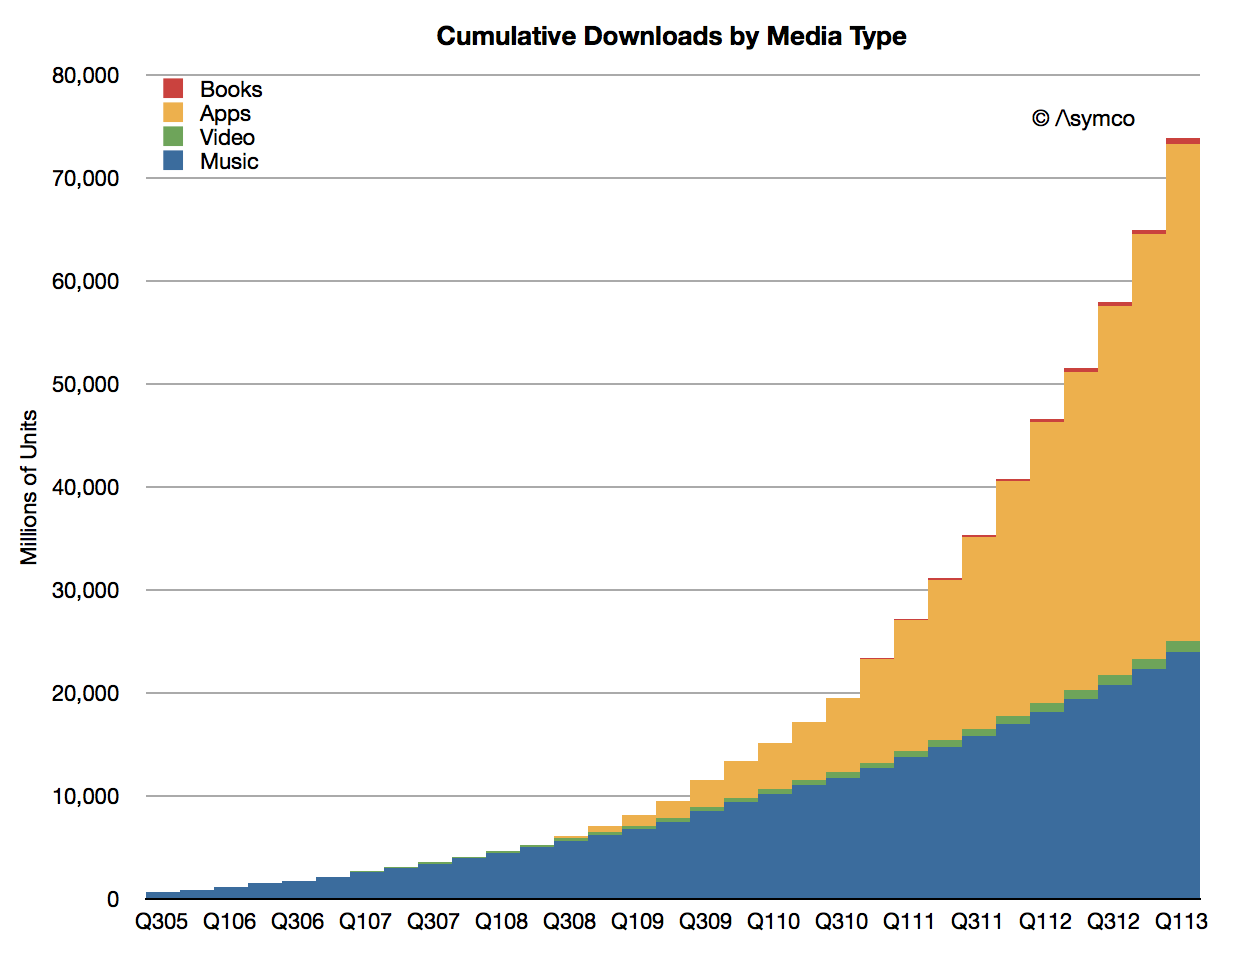
    • Cumulative app downloads have surpassed 45 billion and are on track to reach 50 billion at time of writing (estimated to be reached mid May).
    Screen Shot 2013-05-12 at 5-12-8.21.31 AM
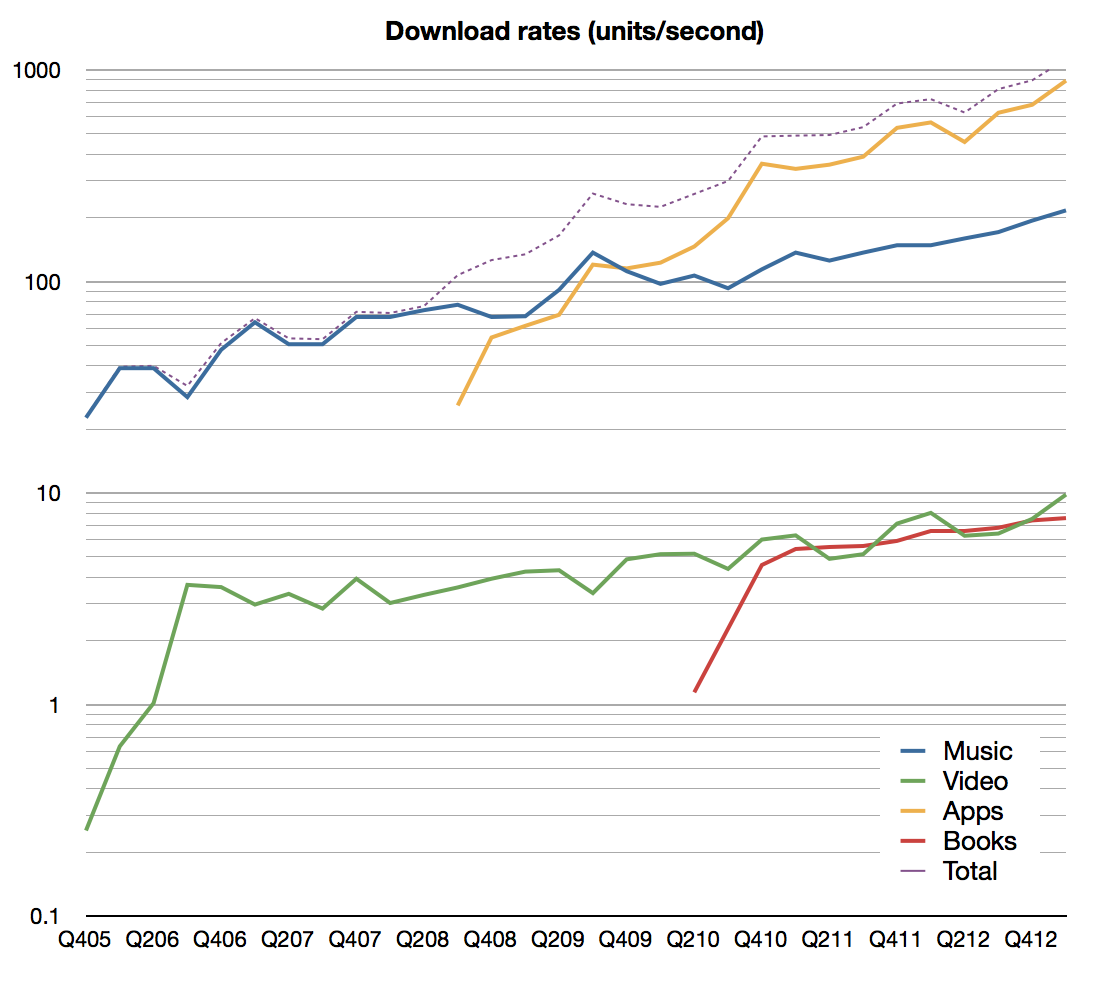
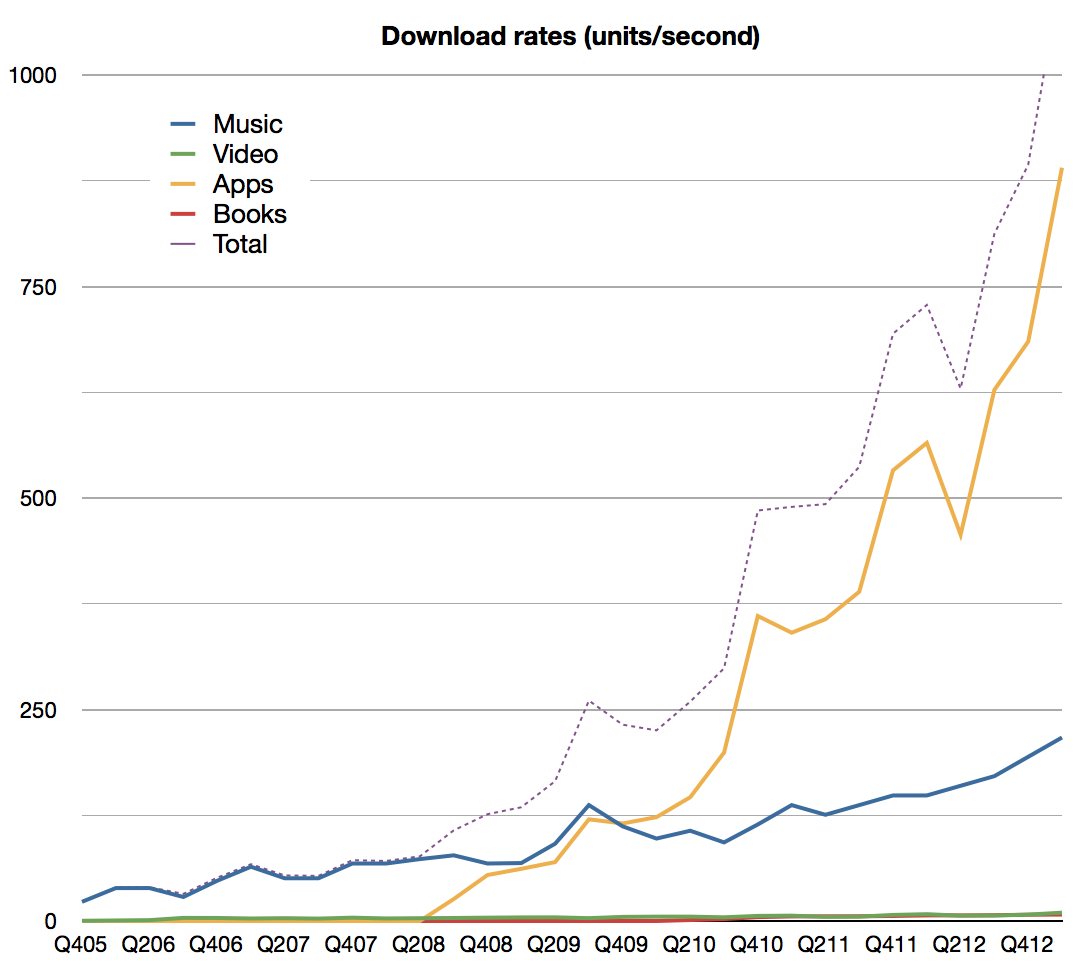
    • The company reports that over 800 apps are downloaded per second. Including all media, the download rate is now above 1000 items per second. Estimated download rates by media types are shown below (note: first graph is plotted on a log scale):
    Screen Shot 2013-05-12 at 5-12-8.34.37 AM


    Screen Shot 2013-05-12 at 5-12-9.07.49 AM


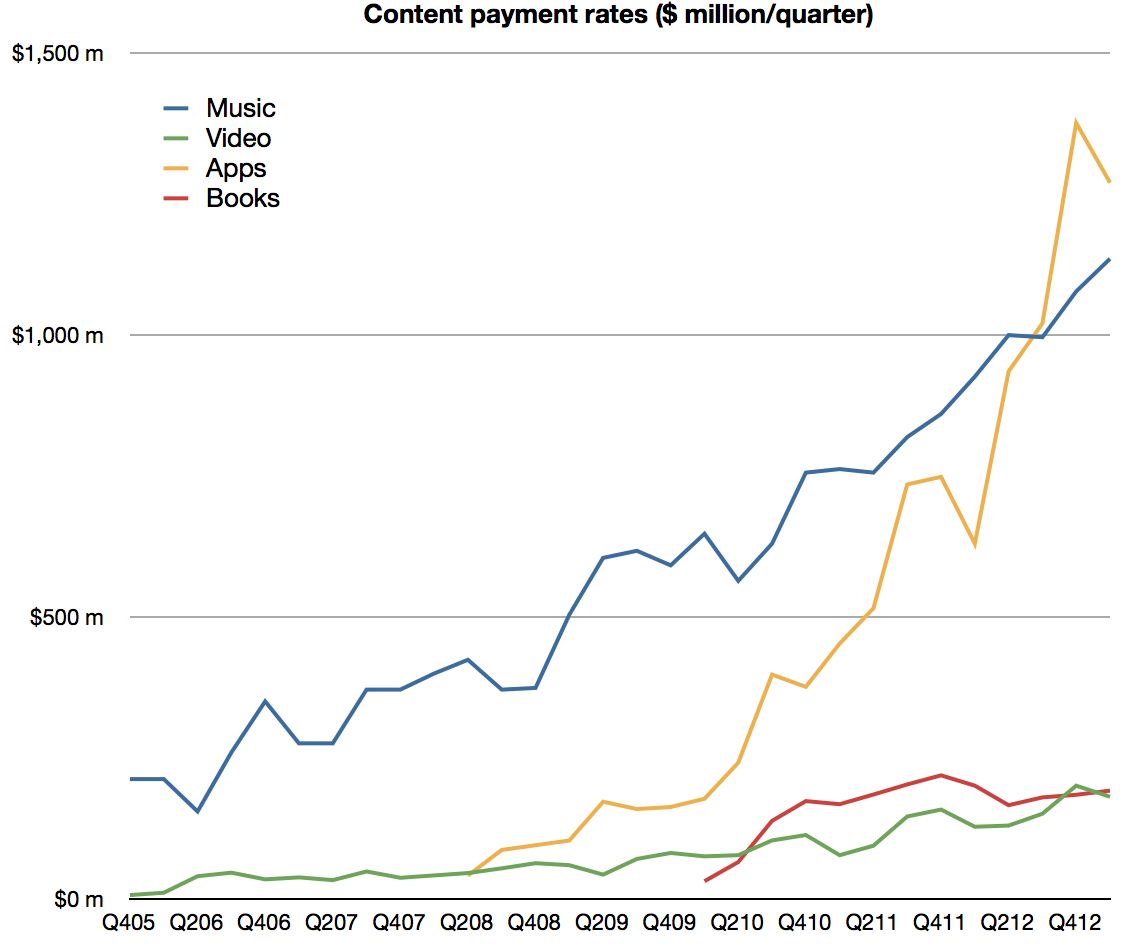
    • App developers have been paid over $9 billion for their sales through the App Store including $4.5 billion in the most recent four quarters. I estimate the split between media types as follows:
    Screen Shot 2013-05-12 at 5-12-9.13.48 AM
    • Canalys estimates that sales from iTunes App Store accounted for 74% of all app sales worldwide in the March quarter.
    • iOS app revenues more than doubled year-over-year.

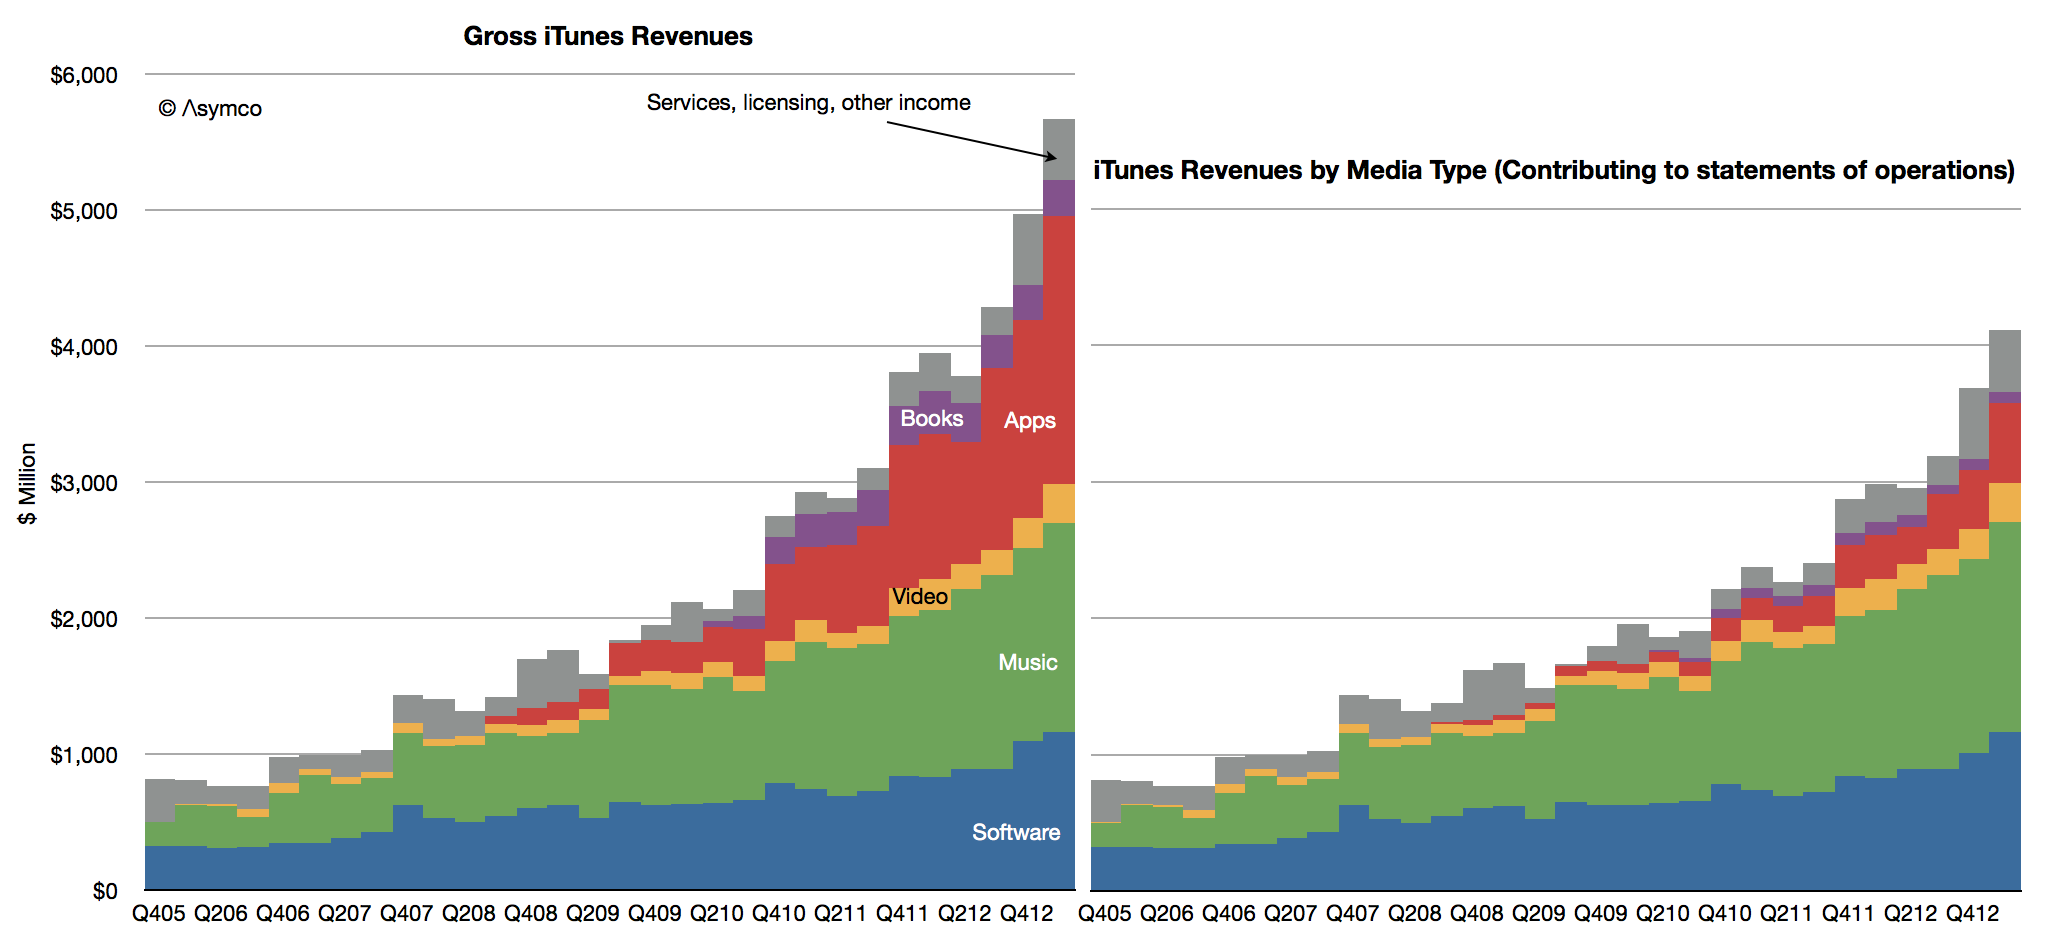
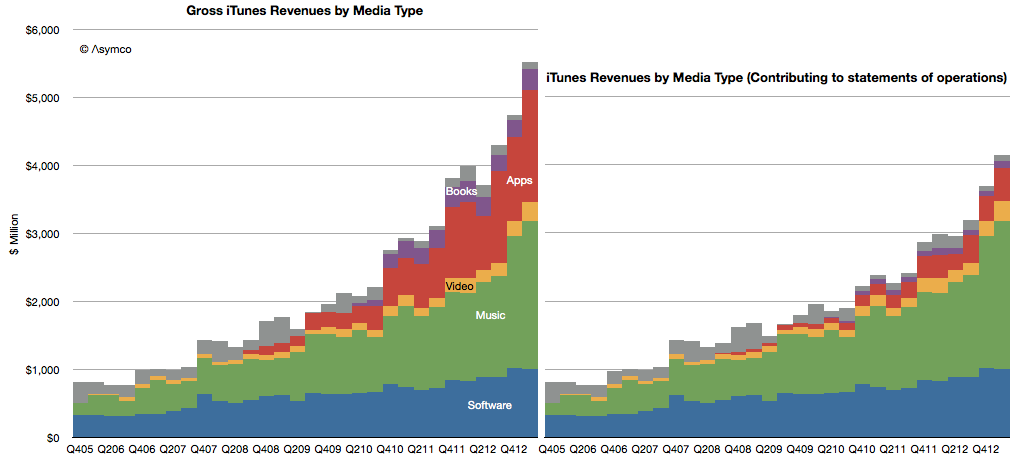
    Including all (gross[1]) content revenues, the sales rate is now nearly $5 billion per quarter ($4.94 billion). Including services, the iTunes consolidated business cleared over $5.5 billion.

    Screen Shot 2013-05-12 at 5-12-9.18.30 AM

    In March Apple reported that they have 500 million iTunes so one way to think about the iTunes business is to say that  iTunes users purchase content and services at the rate of about $40 per year.[2]

    Bless them.

    ---

    Notes:

    1. "For third-party applications sold through the App Store and Mac App Store and certain digital content sold through the iTunes Store, the Company does not determine the selling price of the products and is not the primary obligor to the customer. Therefore, the Company accounts for such sales on a net basis by recognizing in net sales only the commission it retains from each sale. The portion of the gross amount billed to customers that is remitted by the Company to third-party app developers and certain digital content owners is not reflected in the Company’s Consolidated Statements of Operations." From Apple SEC filing 10-K, October 2012.
    2. Apple users spend about $1/day for each Apple device in use making the iTunes franchise an incremental 11% marginal revenue source (assuming one device/user.)
  5. Measuring Platform Churn

    Research · 33 comments

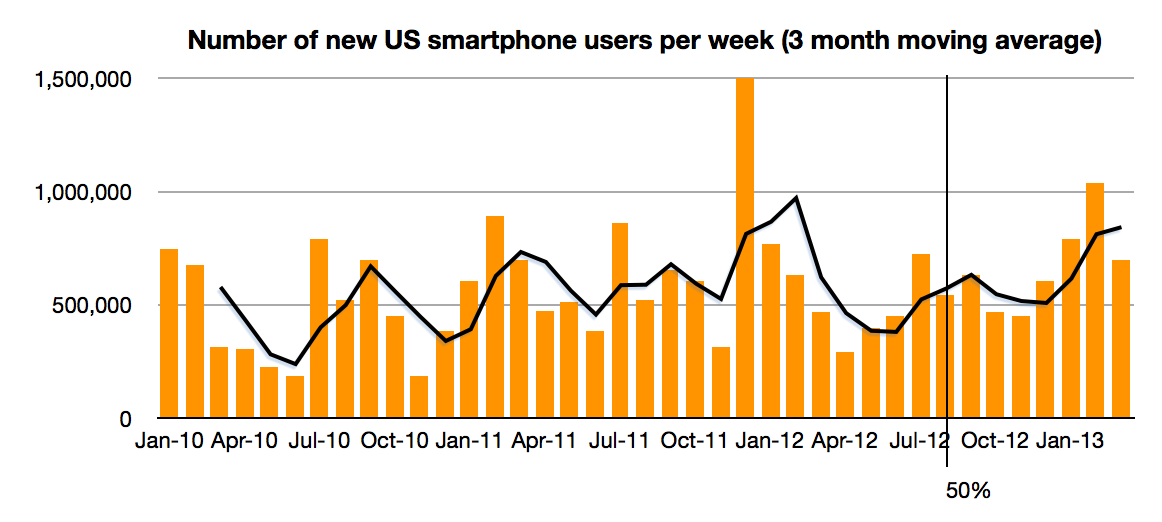
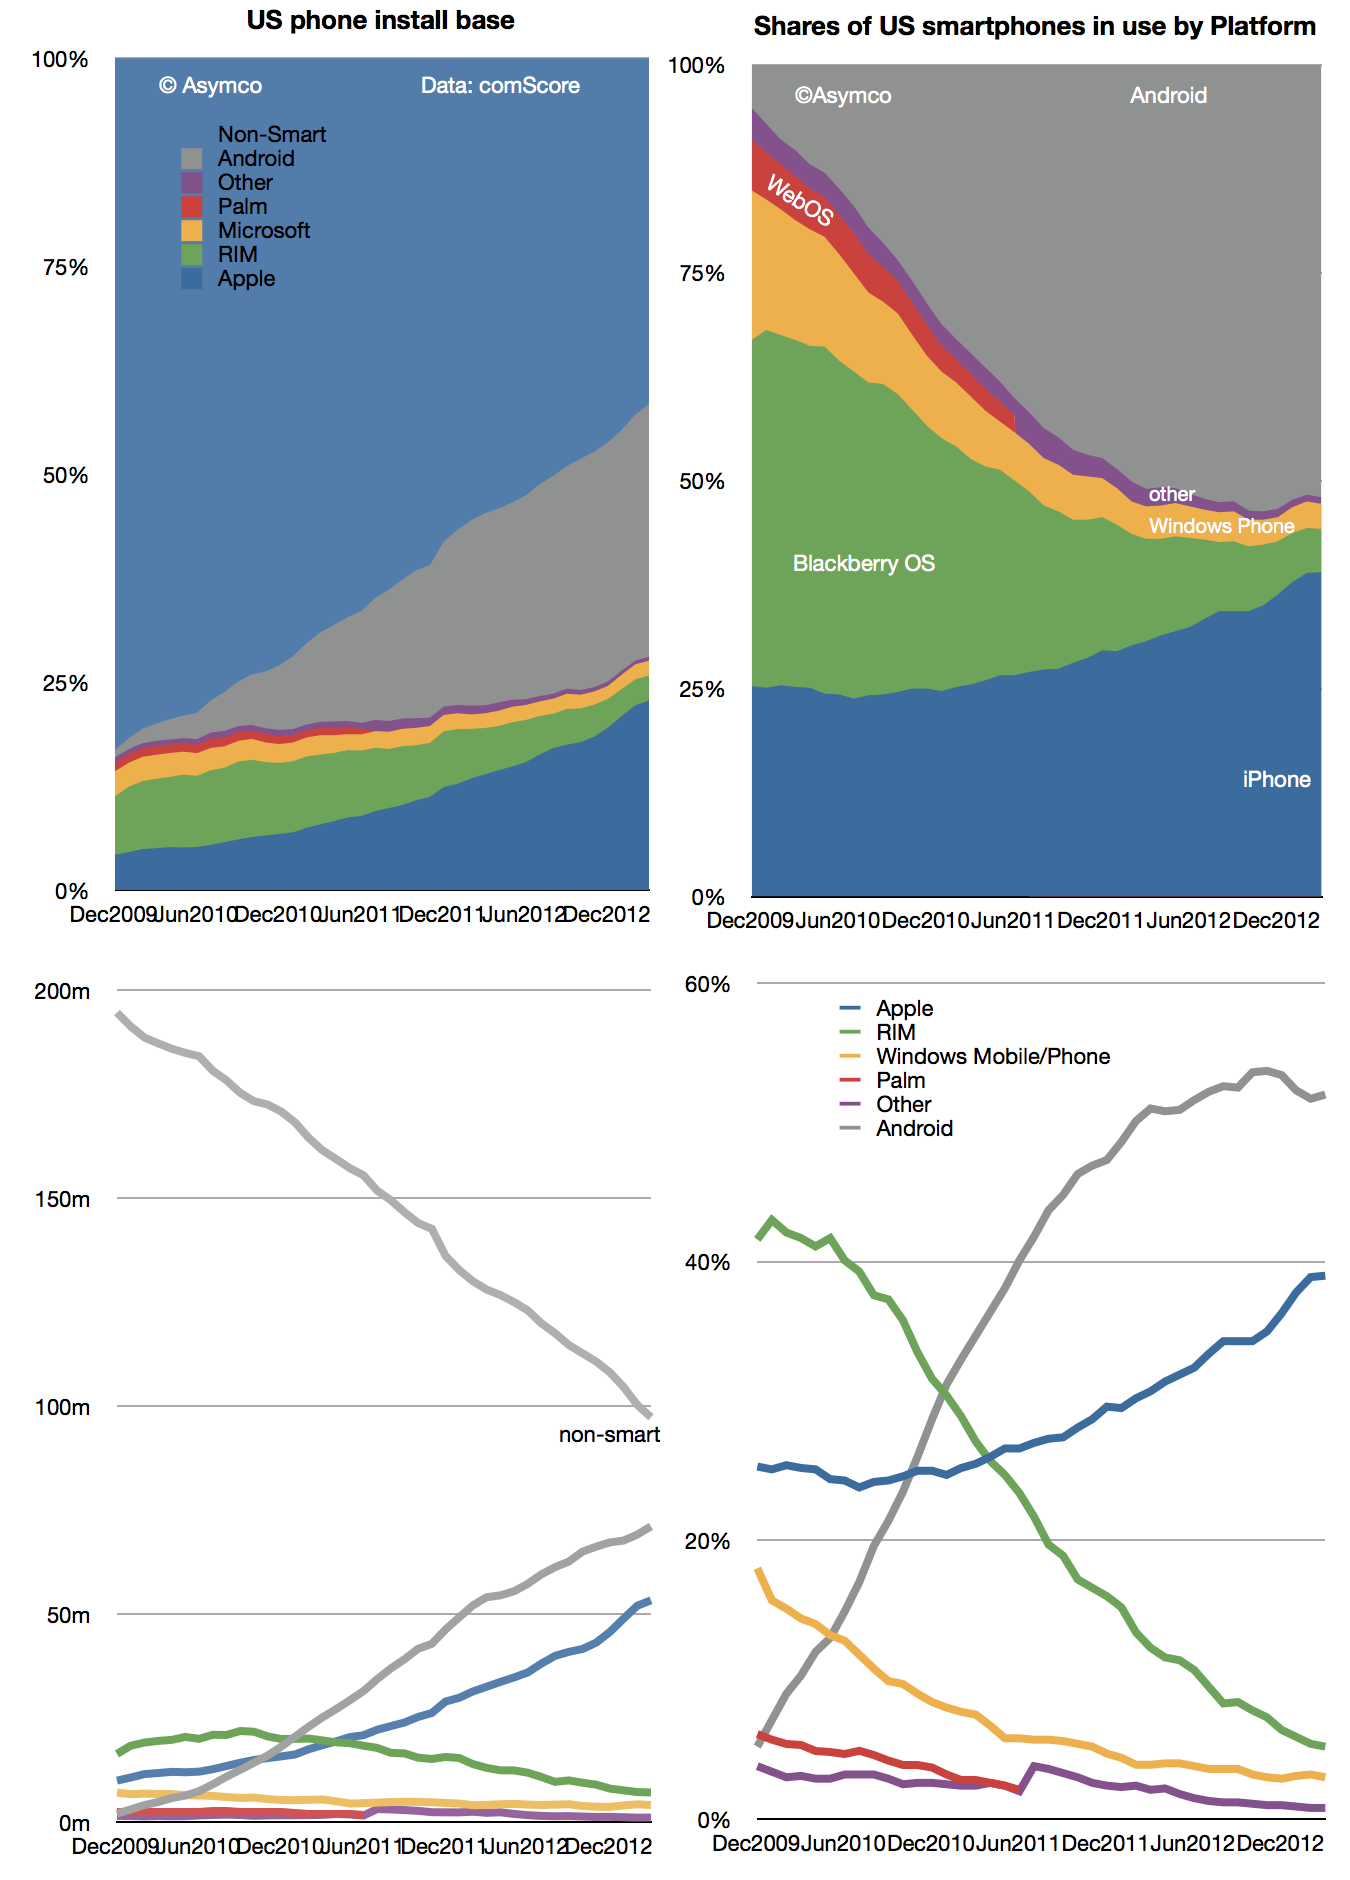
    The latest comScore data shows consistent growth in US smartphone penetration. The rate is now 58.4% of adult consumers who own phones. This is up from 20% only three years ago. The rate of growth remains a remarkable 1.2% per month. That's 700,000 new-to-smartphone users every week. The historic average over 3 years has been 1.07%/month This after having crossed over 50% on schedule in August 2012. There appears to be no slowing.

    Screen Shot 2013-05-06 at 5-6-5.42.50 AM

    The next milestone I have pencilled in is the 80% mark which I extrapolate to be achieved by October 2014. 80% could be considered "saturation" which would signify a rapid slowing of new user addition. However, that might still not happen until 100%, depending on the availability (or lack thereof) of non-smartphones to buy.

    This time frame is important because it would imply that essentially all mobile users in the US (some 234 million) would be a part of one ecosystem in about 2 more years. That's less than the life cycle of the typical mobile contract (and thus the life of one phone). Put another way, by the time a new buyer today is ready to buy the replacement to their phone the market will be saturated.

    This implies the mode of competition will be changing to smartphone replacement rather than smartphone adoption. To some degree this is already happening but as the net user gains data shows only BlackBerry and Windows platforms have had any net user declines in the last two years. "Platform churn" is still a relatively rare phenomenon.

    How that will change post-saturation will be a crucial determinant to platform growth. The data today points to a higher degree of loyalty for iOS users and potential erosion in the Android user base as a result. There are ways of forecasting this on the basis of survey data as Carl Howe did. However, the data from comScore has already begun to show that Android may have peaked around 54% share. Android share is now at the same level it was in July while iPhone share has grown by more than 6 points since then.

    Screen Shot 2013-05-06 at 5-6-5.40.28 AM

    There is a pattern of higher growth into the end of the year and an iPhone plateau into the first quarter, undoubtedly due to holiday buying favoring the iPhone. I don't want to discount the possibility of some change in this pattern but so far there seems to be a plausible reason for it: with iPhone pricing and availability in the US offering no advantages to alternatives, Apple's product is the most popular. Nearly more popular even than all the other competitors combined.

  6. Martin Bryant of The Next Web Interview

    Research · 22 comments

    "So paradoxically, the opinion of those who are highly paid should be treated with suspicion while the opinion of those subject to peer review should be treated with respect. It brings to mind the difference between highly paid fortune tellers and pundits whose methods are obscure vs. poorly paid graduate students whose methods are open to all. Whose opinion is worth more?”

    To read more see Horace Dediu on the bad habits of Apple analysts and why Tim Cook shouldn’t be fired - The Next Web


  7. Surface Tension: The effect of Surface on Windows revenues

    Research · 34 comments

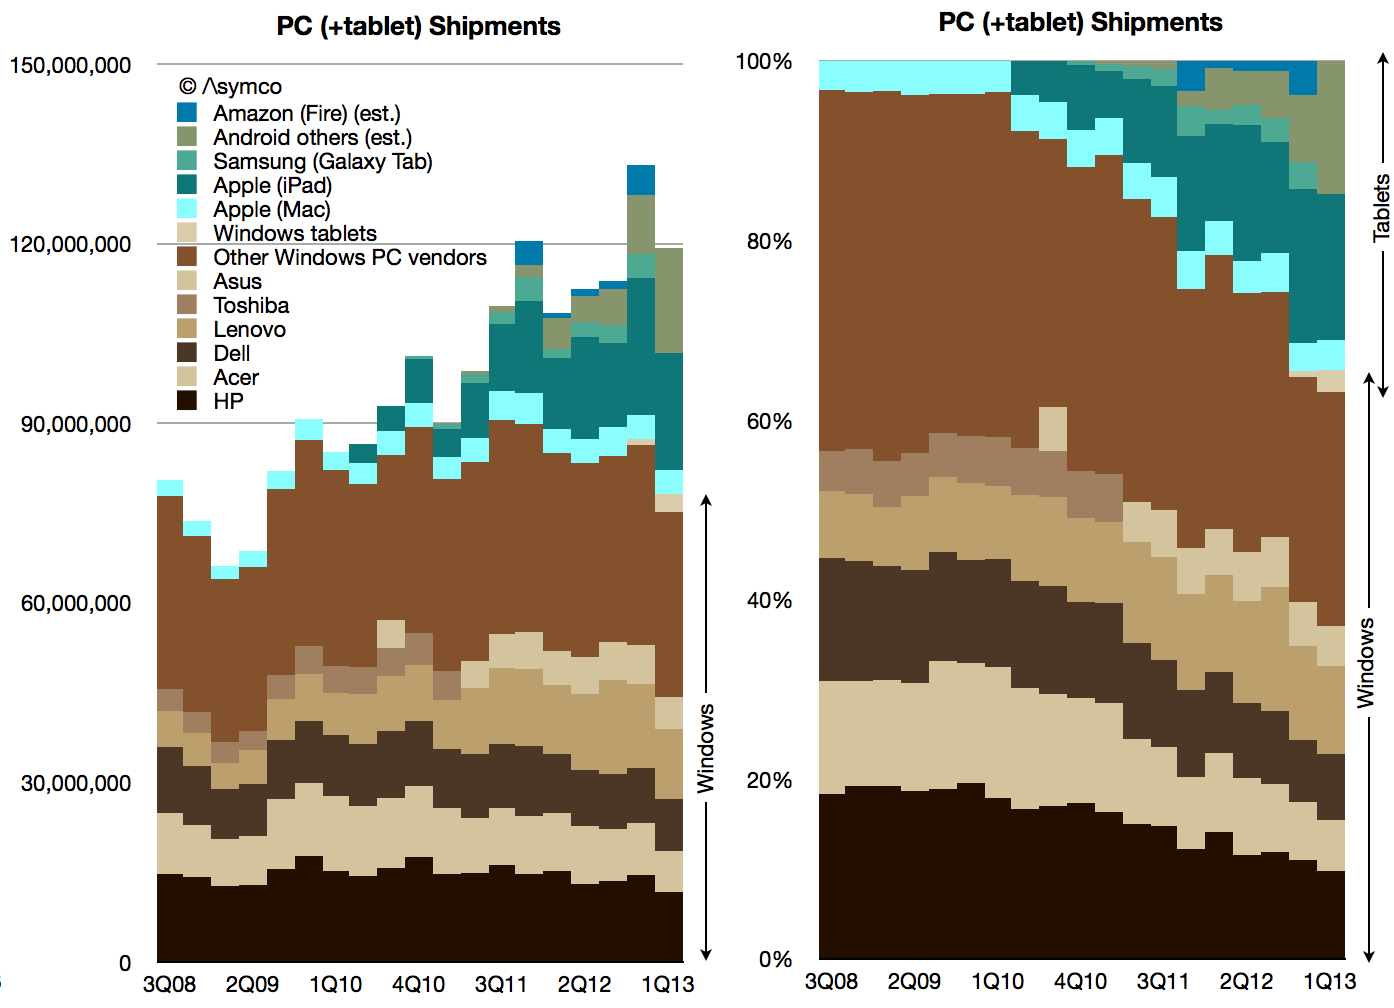
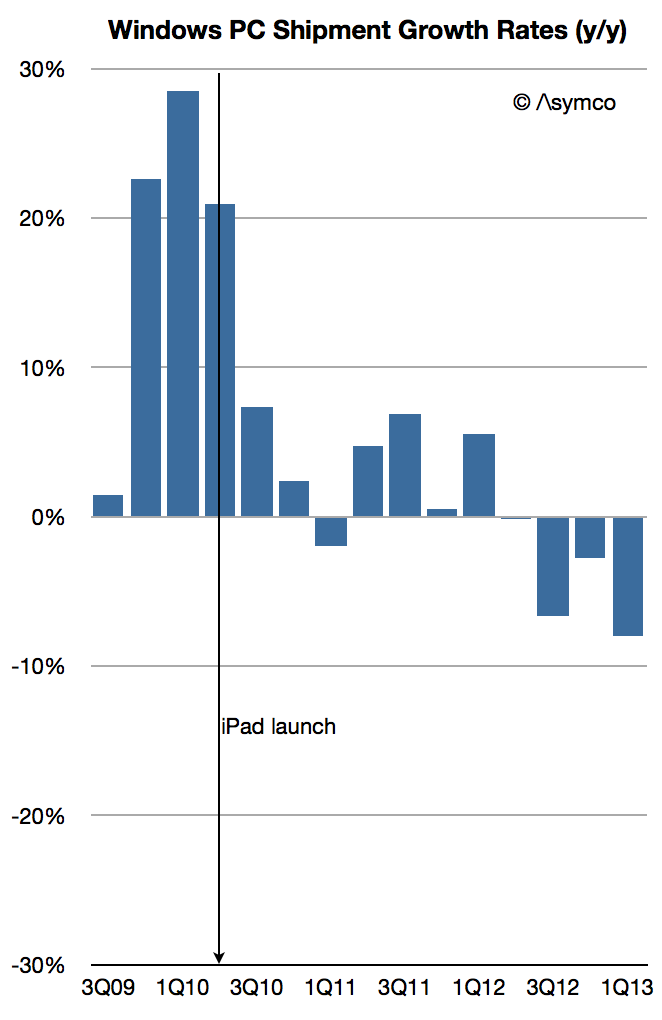
    According to Strategy Analytics 3 million Windows-based tablets shipped in Q1. That is not inconsequential. It would add 4% to the total Windows-based computers and reduce the decline in Windows PC growth to -8% (from -11%). You can see the effect of those units on share in the following graphs.

    Screen Shot 2013-05-02 at 5-2-2.06.21 AM

    Note the "boundary layer" of pale blue Macs between the brown-hued Windows and the green-hued tablets.

    Including tablets of all kinds, here is the market share growth in Windows PCs.

    Screen Shot 2013-05-02 at 5-2-2.06.30 AM

    As the post-PC disruption evolves, Microsoft has made an effort to shift its business model. I discussed this some time ago and there remain quite a few questions about the sustainability of the strategy.

    However, there might already be evidence that it's working. The clue is in the growth in Windows revenues at a time when PC shipments (at least traditional ones) are declining rapidly. Some of that might be due to deferrals and software assurance revenues which are insensitive to shipments. However some have to be due to the Surface.

    Remember that Surface launched with an RT version priced starting at $499 (which did not sell well) but received a boost in Q1 with the Pro version priced at $899 to $999. If we assume a 80:20 mix of Pro to RT and an average price of $950 for the Pro and $550 for RT, 3 million units would generate at least $2.5 billion in gross revenues. Accounting for retail margins of 20%, Microsoft could still be recognizing $2 billion in revenues. That's a significant portion of $5.7 billion in Windows revenue.

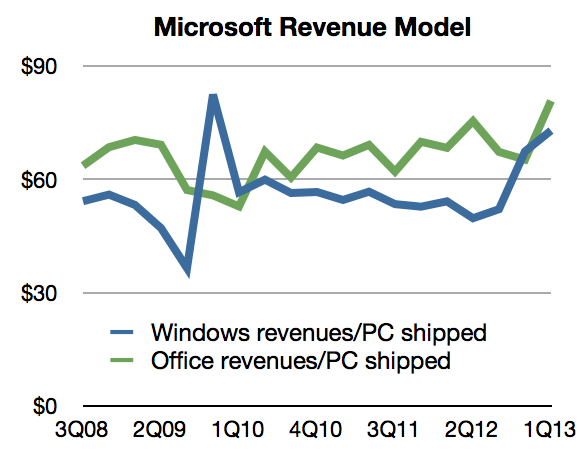
    We can back into this figure from another direction: Prior to Surface launch, the Windows revenue per PC shipped (combining Microsoft's revenues and Gartner's estimates) was about $50. After the Surface Pro shipped the revenue climbed to $73/PC.

    Screen Shot 2013-05-02 at 5-2-2.06.38 AM

    Assuming the same pre-Surface revenue/PC and given the shipment figures for Q1 we would get about $3.7 billion for Windows. The difference to actual revenues is about $2 billion.

    So the extrapolation of Windows royalties approach yields $2 billion in Surface sales and the Price x Units estimate also yields $ 2billion. It would suggest that Surface has had a significant impact already: More than a third of Windows revenues depend on it.

    [UPDATE: I've been informed that not all the Windows tablet sales reported by Strategy Analytics are Surface products. As many as 1 million might not be. That would reduce the revenues as calculated to about $1.4 billion. In addition, not all Windows revenues are current with much of that deferred. Actual revenues were $4.6 billion. With both of these adjustments considered, the impact of Surface might be only 30%.)

  8. Happy Birthday iTunes Store

    Research · 16 comments

    iTunes (including software and services) revenues in Q1 topped $4 billion and were 30% higher than (re-stated) 2012 Q1 revenues. Accompanying this revenue figure were additional data points from the company:

    • Cumulative app downloads have surpassed 45 billion
    • Payments to developers reached a cumulative total of $9 billion
    • Payments to developers were $4.5 billion in most recent four quarters
    • Now paying $1 billion to developers every quarter
    • 800 apps are downloaded every second
    • iOS app revenues doubled since year-ago quarter
    • App Store accounted for 74% of all app sales in the quarter (citing Canalys)
    • App stores reach customers in 155 countries (850k Apps, 350k iPad apps)
    • iTunes music downloads are available in 119 countries (35 million songs)
    • Movies are sold in 109 countries (60k titles)
    • iBookstore is available in 155 countries (1.75 million titles)

    This data allows for a few inferences:

    • Nearly 70 million apps are downloaded every day
    • The average revenue per game is about 23 cents
    • Gross app revenues are about $16 million per day (of which 11 million is paid to developers.)
    • Gross iTunes revenues were $5.4 billion last quarter of which I estimate:
    •  …App revenues were $1.6 billion
    •  …Music revenues were $2.2 billion
    •  …Video revenues were $287 million
    •  …Book revenues were $312 million
    •  …Apple's software generated $1 billion
    • In addition, I estimate that Services generated $100 million

    Note that there is a difference between the amounts transacted through the store and what the company reports. The difference is shown in the following graph

    Screen Shot 2013-04-29 at 4-29-1.02.50 PM

    To mark it's 10th year, I wrote a segment for Billboard Magazine describing what iTunes has become. I suppose it's easy to become numb to these numbers, but there is perhaps one way to look at iTunes that is still compelling:

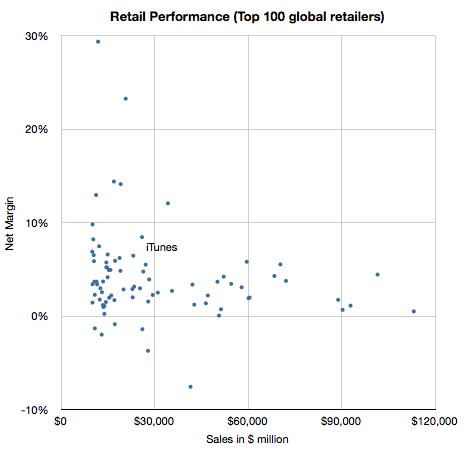
    Selling $20 billion a year would put iTunes in the top 20 US retailers and top 50 Global retailers.

    Screen Shot 2013-04-29 at 4-29-1.36.41 PM

    Not bad for a 10 year old.

  9. Margin call update: About those changes in service policies

    Research · 21 comments

    In the March quarter, our gross margin was 37.5%. It was at the low end of our range. We had a few items that on balance resulted in us reporting at the low end. They included mix, in particular, selling more iPads than we had planned, including getting iPad mini into our four- to six-week channel inventory range, some changes in our service policies that required us to make provisions for prior quarter sales, and we had some unfavorable adjustments.

    - Peter Oppenheimer, Apple CFO, FQ2 2013 Earnings Conference Call

    [my emphasis]

    Thanks to Philip Elmer DeWitt for bringing this quote to my attention in the comments to Margin Call 2.

    I was curious about the "changes in service policies" and what that might have meant, especially since they seem to have been retroactive (provisions for prior quarter sales).

    The 10Q offers more details:

    Accruals for product warranty for the three months ended March 30, 2013 include $414 million associated with product sales in prior fiscal periods reflecting the impact of changes to certain of the Company’s service policies and other estimated warranty costs. Of this amount, $224 million is associated with product sales in the first quarter of 2013, and the remainder is associated with product sales in 2012.

    - Apple 10Q, Note 6, Page 17, second paragraph.

    These service policy changes were made around April 1st and were in response to editorials in the People's Daily, the official paper of the Chinese Communist Party. Though seen as a PR issue, their impact goes beyond the company's image. Changes in warranty policy implies setting aside some of the revenues as an expense, increasing the cost of sales and reducing margins.

    The 10Q says that $190 million of the additional warranty set-aside was for prior quarters and that $224 million was for the March quarter.

    If we were to subtract the $190 million from the cost of sales the gross margin would increase from 37.50% to 37.93% and if we subtract the full $414 million the gross margin would increase to 38.44%.

    The calculations are shown in the following table:

    SalesCost of SalesGross margin
    Q1$43,603$27,25437.50%
    Q1 adjusted for change in service policies in 2012$43,603$27,06437.93%
    Q1 adjusted for change in service policies in 2012 and 2013$43,603$26,84038.44%


    If we read 2012 and 2013 as meaning fiscal years then the entire $414 amount is for prior periods (i.e. not for the current quarter) and the gross margin for Q1, excluding one-time items, would be nearly 1 percentage point higher than reported.

    The effect of the change in policy would have been very difficult to anticipate when estimating the gross margin, even for Apple's own team three months ago.

    It's also important to note that this does not say much about the supposed effect of competitive pressures on Apple's margins. 38.44% gross margin is not as good as last year's, but they're pretty good.

  10. Margin Call 2

    Research · 159 comments

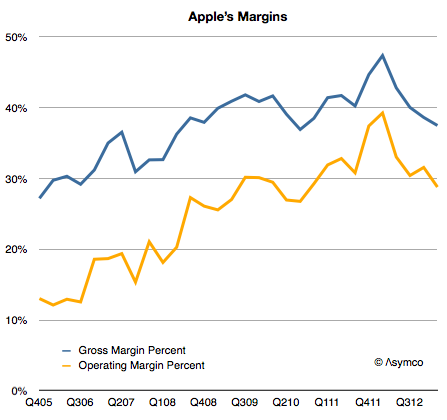
    I expected Apple's margins to improve  last quarter. They didn't and so the question I needed to answer is why. Here is a history of Apple's gross margin and operating margin as reported since late 2005:

    Screen Shot 2013-04-25 at 4-25-9.26.53 AM

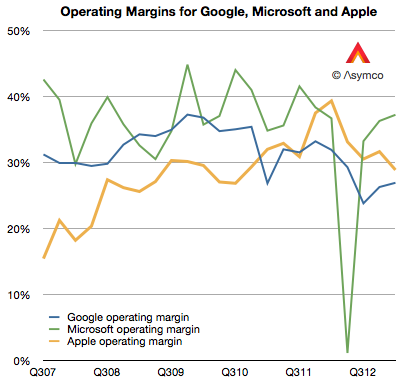
    For a company selling hardware these are extraordinarily high margins. They are higher than those of Google and have narrowed the gap with Microsoft,  neither of which has a high proportion of hardware sales:

    Screen Shot 2013-04-25 at 4-25-10.06.04 AM

    But they are not growing and the reason is to be found in the reason they grew in the first place: because of proportion of iPhones making up the total sales.

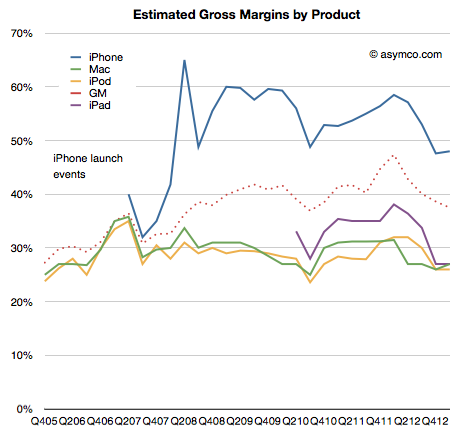
    As a reminder, the iPhone is a uniquely profitable product. I estimate that it obtains about 50% gross margins. The history of these estimates is shown below:

    Screen Shot 2013-04-25 at 4-25-9.32.34 AM

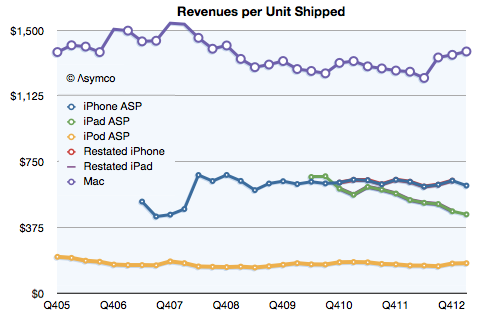
    It remains in stark contrast to the margins Apple obtains for its other products. Much of that is due to the pricing power of the product as shown below:

    Screen Shot 2013-04-25 at 4-25-9.33.13 AM

    Notice that even after the launch of the iPhone 5 and the persistence of two previous generations of iPhones (and their lowered pricing) has barely put pressure on pricing.

    Contrast that with the iPad. As its breadth of offerings increases, it causes a lower price per unit.  The iPhone is now at $613 per unit, even with two older generation products available. (The lowest price was in Q2 2012 when the average price was $608.) The iPad is at $449 per unit, down from $662 at launch three years earlier.

    So overall, margin is a function of three things:

    1. Price changes: iPhone had a small reduction (from $635 to $613) but the iPad has had a moderate reduction in price (from $531 to $449).
    2. Cost of components: This is reflected in product-line gross margins which can only be estimated. Compared to last year I estimate that iPhone gross margin dropped from 58% to 48%. iPad margins also fell from about 38% to 27%. The reasons were given by management as "Last year, our business benefited from …a more favorable foreign currency environment, and historically low costs."
    3. Mix of high and low margin products. The iPhone units grew at 7% but the iPad units grew by 65%. A year ago iPhones were 58% of revenues and this year they were 53%. The iPads were 17% and now they are 20%.

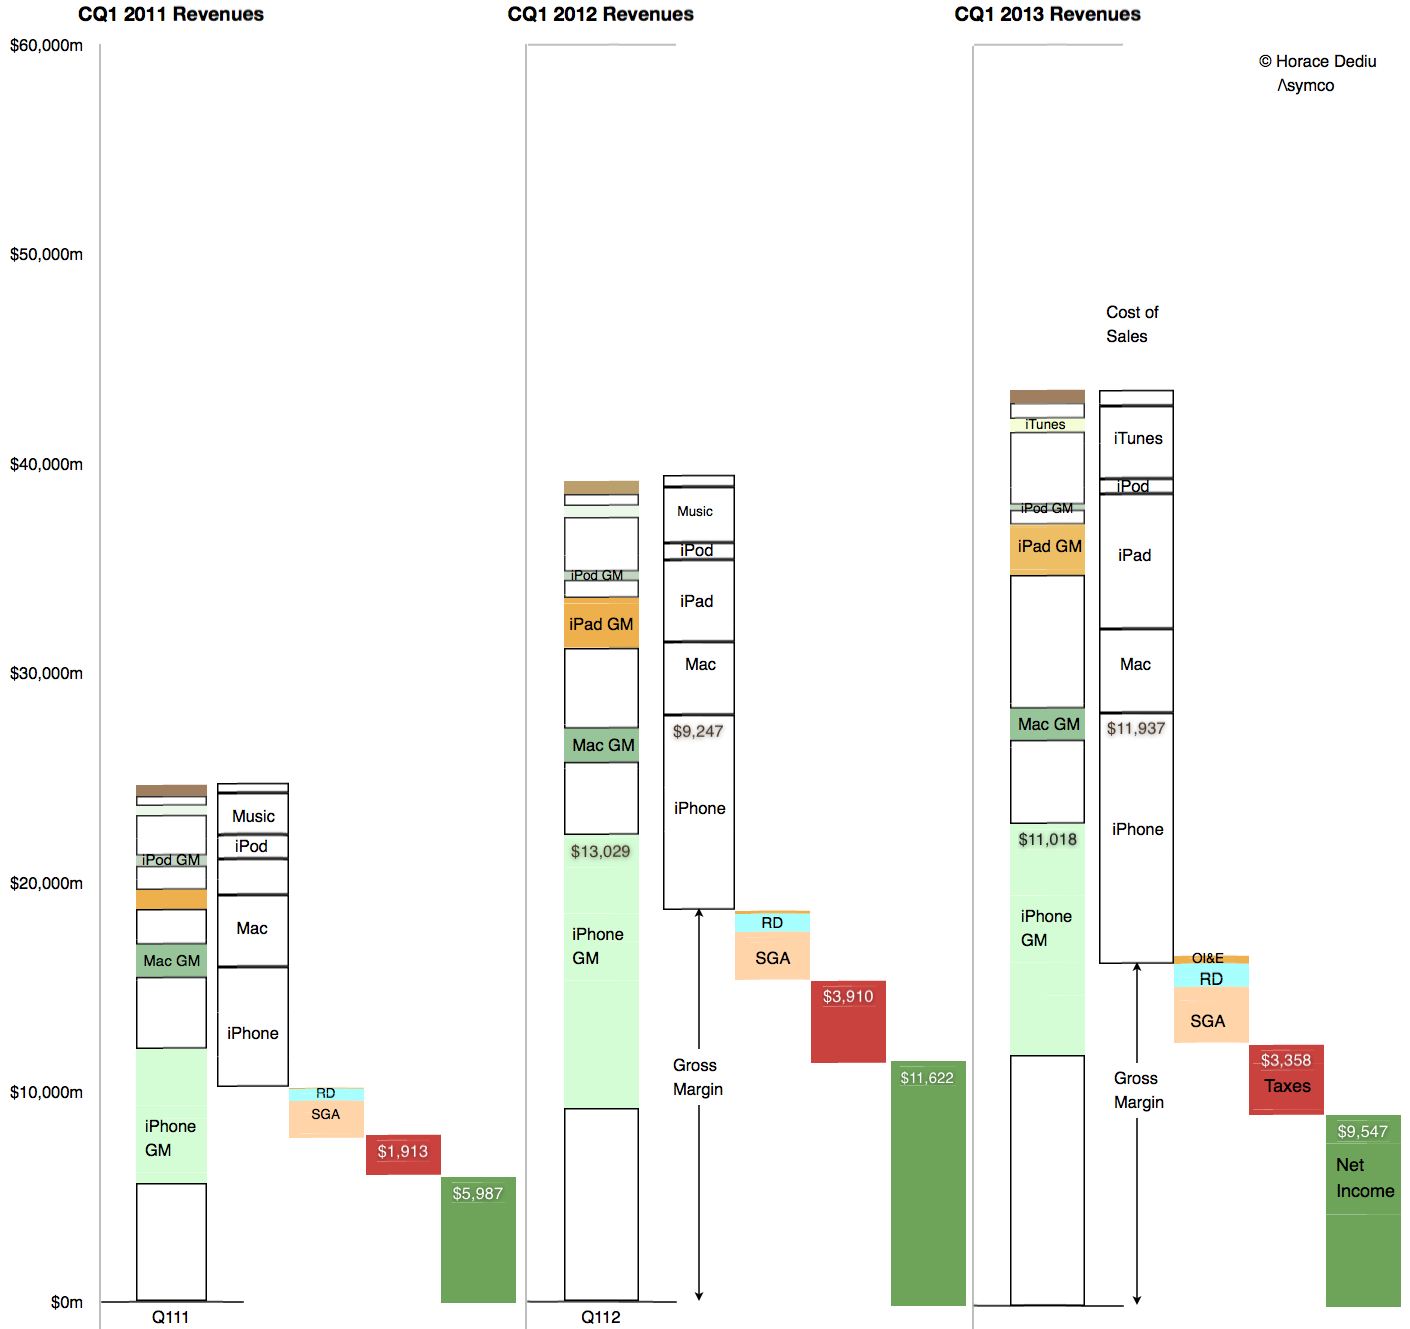
    The result is seen in this one graph showing the allocation of revenues and margins by product:

    Screen Shot 2013-04-25 at 4-25-8.46.04 AM


    So what is surprising? My expectations were met in terms of iPhone units (and exceeded in terms of iPad units). The mix was also something that falls out of the unit expectations. The pricing is also not  surprising.

    My guess is that the largest contribution to the "reduction of margin" is the increased cost of components. Note that the graph implies that even though iPhone revenues were nearly flat at 3% growth, the cost of those revenues went up by 29%! In addition, the iPad revenues grew 40% while costs went up 65%.

    Unit pricing (and implicitly competitive pressure) is still not the primary cause of the reduction in Apple's margins. Indeed, the curious thing is that margins are now at levels seen for most of 2009 and 2010, a time when the iPhone (and iPad) were seen as near monopolies in their respective categories.

  11. Asymco Workshops Australia 2013

    Research · 18 comments

    Screen Shot 2013-04-24 at 4-24-6.38.35 PM

    I will be in Australia in May and thought to invite local readers to join me for a few hours of in-depth discussion on the future of our industry.

    I plan to have an event in Sydney on the 3rd in the morning (9:00 to noon at the Radisson Blu 27 O’Connell. Press Room) and in Melbourne on the 6th in the afternoon (1:30 to 4:30 PM at Victoria University City Flinders Campus: Level 12, Function Room 4, 300 Flinders Street, Melbourne, VIC, 3000).

    Nominally, the topic will be: The history and future of computing using disruptive analysis.

    I will present recent material (including the latest data from Apple) and we will have a few hours of Q&A.

    Tickets are $120 and seating will be limited to 100.

    You can register here: Asymco Workshops Australia 2013.