Asymco

Asymmetric Intelligence

Research

  1. Nokia's Lumia brand strategy for the US

    Research · 29 comments

    Last July I asked the question "How many Lumia phones were shipped in the US?"

    My answer was 630k through the first half of this year.

    I revisit this question following Nokia's latest quarterly report.

    As a quick review, Nokia reported the following performance for its mobile phones operations:
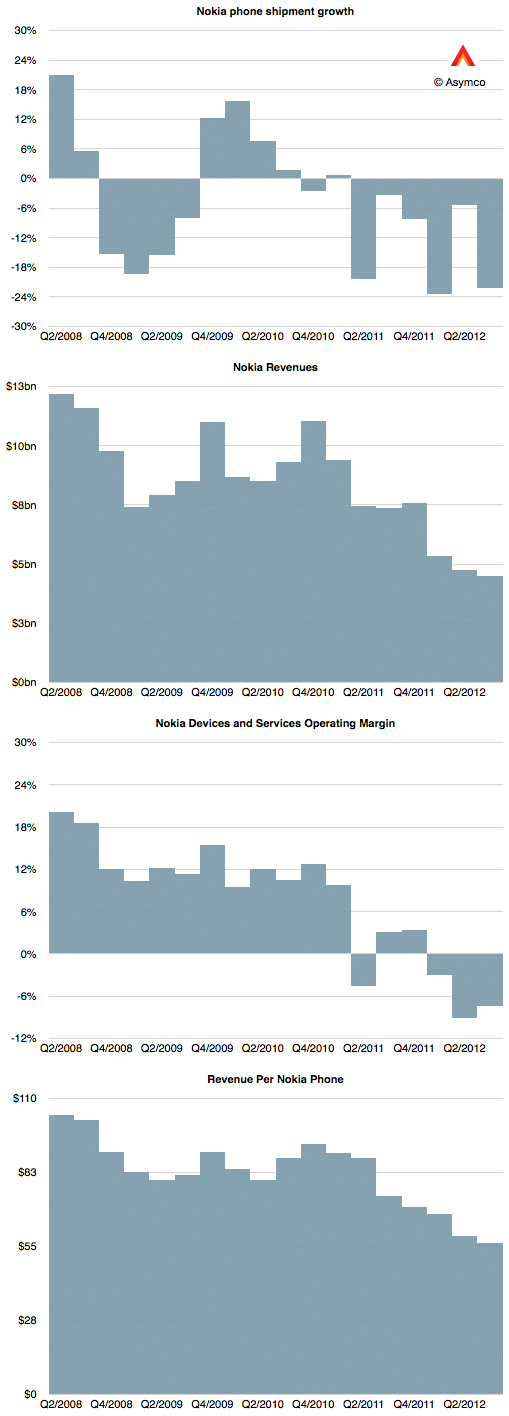
     

    The most worrying thing of all however is that Nokia's smartphone performance has collapsed. With only 6.3 million units shipped, the company may be the worst performer among eight competitors I track. They were below RIM's shipment total.

    The value of 6.3 represents only 7.6% of their overall phone shipments.
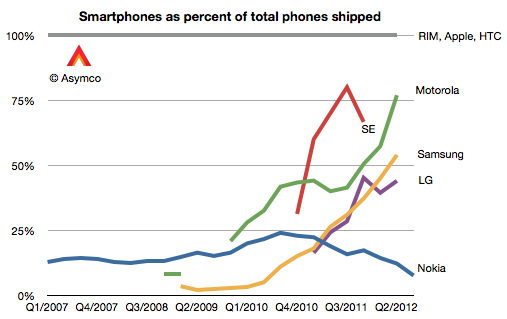
    As the graph above shows, Nokia is going in the wrong direction with respect to moving to a smartphone portfolio.[1]

    Of the total 6.3 million smartphones (aka smart devices, as per Nokia's reporting nomenclature) 2.9 million were Lumia Windows Phone units.

    Using information about average selling prices and total volumes into North America, I was able to estimate that there were about 180,000 units sold into North America during the last quarter.
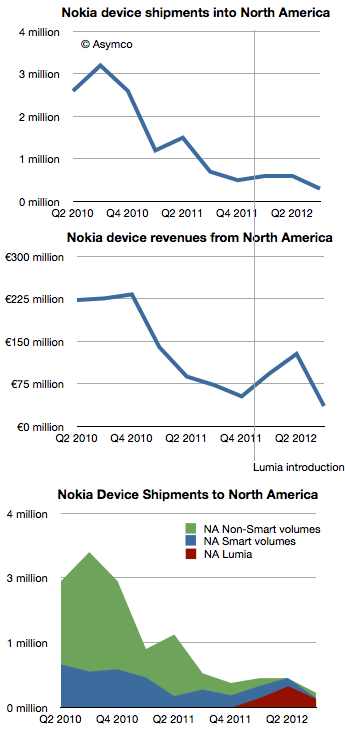
    Since launch, my estimate is that Lumia has sold 810k units in the North American market.

    This cannot be seen as a good performance. There are mitigating factors such as the lack of upgradeability to Windows Phone 8 which probably deflated demand[2]. However, it's a poignant observation that during the last quarter the US reached 50% smartphone penetration by users. As traction is still absent from both Nokia and Microsoft in the US market, we are back to the question of how to compete.

    As the market in the US transitions from competition against non-consumption to competition among rival platforms, the Lumia brand is being forced into targeting smartphone "switchers" rather than smartphone "adopters". The switching option is expensive, requiring aggressive advertising (see Samsung Electronics' $11 billion ad budget).

    There's only one source of cash for that sort of strategy.

    ---

    Notes:

    1. The caveat is that they market some of the Series 40 phones are "smartphones" on the basis of having "smartphone-equivalent" performance. However, smartphone equivalency is and has been purely subjective. On that basis there were many times in the last decade and a half that we could have counted Java-based or BREW-based or i-Mode-based phones "smartphone-like". Smartphone has been defined on the basis of running an operating system with native APIs for developers.
    2. I imagine that the upgrade path could have been known to Nokia, AT&T and Microsoft nine months ago when the Lumia was unveiled for the US by the three CEOs and therefore expectations could have been modulated accordingly.
  2. iOS portfolio price distribution

    Research · 35 comments

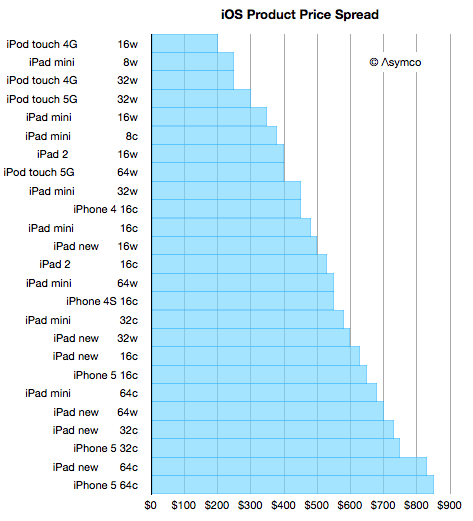
    With the iPad mini launch imminent, it's time to think about the expanding iOS portfolio. We don't know how much the "mini" will cost or what variants will be available but I took some rumors as a basis to form a hypothesis.

    The idea is that there will be 24 variants which have three dimensions:

    • 2 colors
    • 4 capacities
    • 3 radio chipsets

    The starting point would be $250 for an 8 Gb WiFi only model and increases of $100 for each doubling of capacity and $130 for the addition of cellular chipsets.

    The results would slot into an increasingly broad price spectrum. I included all the models of iPod touch, iPhone and iPad that we already have available and built the following graph.


    The number after each product name is capacity in Gb and the letter "w" signifies Wifi only and "c" signifies WiFi and Cellular.

    You can look through the list and see whether products of comparable prices are "competing for a purchase decision" or whether there is some marketing logic to the arrangement. I consider the purchase decision not to be determined by price but by many factors like the job being offered by the product.

    But in many cases buyers have a budget and are looking to fit a product into that price. This is more common when the product is a gift.

    So with that in mind I created a quick motion chart in Perspective to answer the question: Given a budget, how much iOS device can you buy? You can "dial in" various price points and see what products are available with graphical representation of capacity.

    If you are on an iPad and have Perspective, you can launch the story (with voice-over) through the following link:

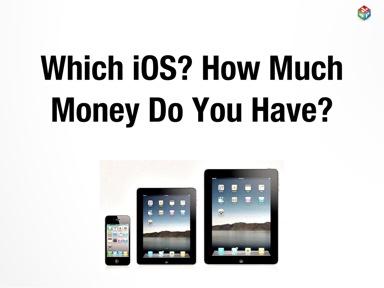
    Which iOS? How Much Money Do You Have?.

    If you're not an iPad but have one click on the "Send e-mail" to get a link in your inbox and open it on the iPad.

    If you don't have an iPad but have an iPhone, stay tuned as an iPhone version of the app will be ready soon.

  3. The omnivorous app

    Research · 62 comments

    Marc Andreessen famously coined the phrase "software is eating the world." It's an apt observation. If you look back on the history of computing you're likely to measure computers sold or devices sold or users harvested or productivity gained. These things are measured because they can be measured. But the greatest cause of value created and captured has been the development of software. An ephemeral product whose value is often ignored in analytical discourse.

    Software is not easily measured and it's not easily valued due to its intractable nature. Firstly, because businesses that make software tend to have weird cost structures--absurdly high fixed costs and operating margins: They operate without income for years and then suddenly are massively profitable with a minimal set of resources. They have a non-linear, "big bang" trajectory.

    Secondly, software companies tend to capture revenues from something other than the direct sale of the good. Software is rarely sold. Services sometimes are sold on the basis of software but more likely audiences for services are sold to a set of bidders, or revenue is obtained in even more circuitous ways.

    Thirdly, because there are curious multi-sided markets for software platforms. Charlie Kindel hints strongly at how difficult it is to understand the dynamics of software platforms. There is the prospect of lock-in of users and data. There are relationships to nurture with developers and there's the principle of an ecosystem that creates network effects. The virtuous/vicious cycles are non-linear and unpredictable even for the experts who have been at it for decades (e.g. Microsoft).

    Given these difficulties, software is seldom seen as the core value proposition for a particular business. But make no mistake about it, Apple, Google, Microsoft, Facebook and Amazon are all software companies. They "monetize" or integrate software differently but software is causal to their profits. Their use of software has also made them all disruptive. Software enabled the disruption of consumer electronics, retail, computers, advertising and broadcast media.

    But we have not seen anything yet. There is another class of software that is poised to lay waste to a new set of industries. The lowly app coupled with cloud-based services[1] is the termite that is set to eat the foundations of the largest of the industries still standing.

    Consider the following:

    • Games. A software industry in itself, the app versions are attracting non-consumers and eventually will get good enough to absorb all  usage and profits. Games merged with "entertainment" concepts will lead to new models of user recreation leading to new global brands that could challenge even Disney.
    • TV. As apps come to the big screen TV will never be the same. Not only will show creators build directly for an audience but advertisers that currently sponsor shows will produce them instead and package the result as an app.
    • Shopping/dining/entertainment/hospitality are changing with location services and with novel "bits to bricks" purchase options (e.g. PassBook). Increasingly services will exploit handheld devices to enable product discovery--the main job retailers are tasked with.
    • Communications. The observation that "phone" is just an app and that messaging can be done in dozens of ways depending on message, relationship, context or even custom is possible because apps conform to the user's needs rather than the user conforming to the tools they get from the network service provider.

    Although these are enormous opportunities in themselves, this is in addition to several industries that are already crumbling (photography, book publishing, to name two).

    I don't need to rely on prose alone to make the point. A graph can also lend a hand.

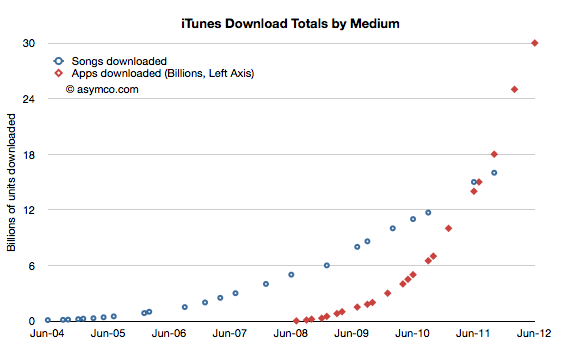
    Consider that Apple's App Store and Google Play together have had over 50 billion installs in less than four years and that the number of users of apps is at least 750 million. Furthermore, consider that apps have moved from a smartphone phenomenon to tablets and even PCs using OS X or Windows. Within one year these software capsules are going to be in use by one fourth of the global population.

    Nothing has this kind of reach or engagement, not even browsers. What makes the app disruptive, even ahead of a browser-based service, is that it includes incentives for developers (or, more precisely, app producers) to get paid and to have a relationship with the buyer. These two value propositions, in isolation or in combination, are available to millions and consumable by billions. The most democratized market that can be imagined. An unbounded set of producers and an unbounded set of consumers and a persistent connection after the purchase with nothing in between them except a payment mechanism

    The world has never seen such an opportunity.

    The consequences are unforeseeable. Apps are a form of software that goes beyond its ancestral "application" as a product and as a business model. It's the software that will take in and assimilate everything in sight.

    ---

    Notes:

    1. I have a simple rule to distinguish between an app and a service. If you have to supply a username and password to an app, it's a service.
  4. My talk at Tampere Goes Agile

    Research · 9 comments

    Steve Jobs once joked that engineers think Hollywood writers do their work by drinking beer and telling jokes and Hollywood thinks building software is as easy as writing a check for the tech. In reality creating software and creating art are more similar than they are different. The phenomenon of mass market software in the form of entertainment has blurred the lines even further--making software has become more like making movies than making machines. There are lessons to be learned by all developers.

    Developer as Artist

    Image (pixxa.com)

    File Size 14.9MB, Talk duration about 30 min. Requires iPad.

  5. What is Apple's Realized P/E ratio?

    Research · 78 comments

    The Price/Earnings ratio is a very simple measure of the "value" a company has. The Price is the current share price and the Earnings is usually the sum of the last 12 months' earnings per share. In other words it measures how many of the last year's earnings are built into the share price. Put yet another way it's the answer to the question "If earnings don't change, how many years will I have to wait before I'm paid back for my share purchase with retained earnings."

    So a company with a P/E of 10 implies that if nothing changes, in 10 years a share owner would "earn" back the price they paid for the share. Any earnings after 10 years would be "profit" for the share owner. You can imagine it even more simply as buying not shares but an actual small business of your own. You pay up front for it and then wait until it pays you back. After getting paid back for the initial purchase you then make money that you can set aside.

    Obviously this figure of P/E is very sensitive to growth in earnings. Consider paying $100 for a share of a company having just earned $10/share last year. It would have a P/E of 10. If earnings stayed at $10/yr for 10 years, you'd "get your money back" in 10 years. However if earnings grow at 20% then next year the earnings would be $12 then 14.4 then 17.3 then 20.7 etc. Adding these up means you'd get your $100 back in five years, not 10.

    So with a company growing at 20% the "realized P/E" is 5. You realized the price of $100 in five years' worth of earnings. In the scenario above you paid expecting to wait 10 years but you got paid in five. If that's your retirement plan then you can retire five years early. Not bad.

    Let's then look at what Apple gave investors as "realized P/E."

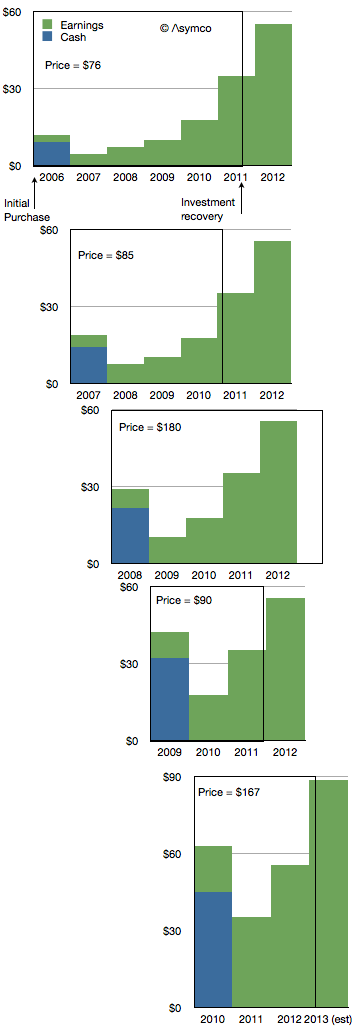
    If you bought shares in the first Friday of 2006 you would have paid $76.3/share. At the time the company had $9.36 in cash so you actually paid $66.94 for any future earnings. The P/E ratio at the time was around 35.

    The company went on to earn $2.78 in 2006. Another $4.63 in 2007,  $7.47 in 2008 and 10.24 in 2009 and 17.91 in 2010. Then in 2011 it earned $35.11.

    If you add these values up you realize that Apple reached your price about two thirds of the way into 2011. So the company earned your purchase price in 5.7 years. That becomes the realized P/E if you bought in early 2006. The following diagram shows the time period as a box encompassing the earnings (and cash) for a share purchase in early 2006.

    I repeated this for purchase in early 2007. The result is a Realized P/E of 4.9. I did it for 2008 as well[1] and got 5.4 then 2009 yielded an astonishing 2.9. 2010 was not much different with 3.2.

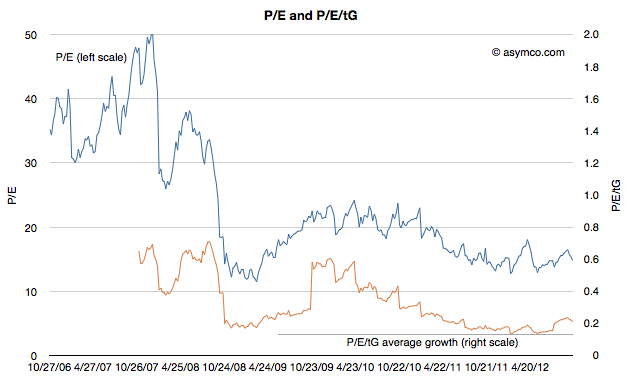
    Investing in Apple between 2006 to 2010 meant obtaining a payback period of less than 4.5 years, on average. In other words, regardless of what the trailing or forward P/Es getting quoted at the time (trailing is illustrated below), buyers actually paid for only about 4.5 years of earnings. In other words they actually bought Apple for a P/E of about 4.5.

    Using our small business analogy, buying Apple in the past few years has meant getting paid back in less than five years. That makes it a very low risk opportunity.

    I could try to repeat the process for years 2010 onward but it would require making forecasts beyond 2013, something I leave as an exercise to the reader.

    ---

    Notes:

    1. I had to make assumptions about full year 2012 and 2013 earnings. I used $55.4 earnings for full calendar year 2012 and 60% growth for 2013.
  6. Why are tablets and smartphones insulated from tough economic conditions?

    Research · 46 comments

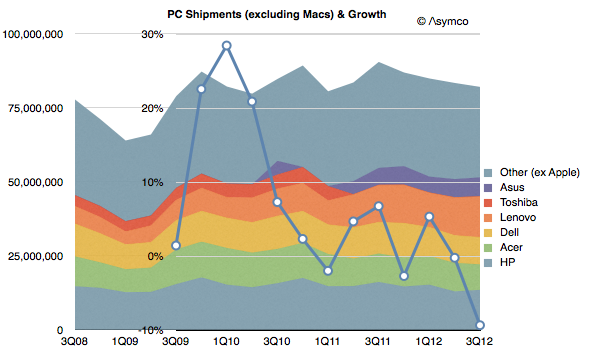
    The iPad launched in April (i.e. Q2) 2010. Since then the PC industry (excluding Macs) has seen a decline in growth. The following graph illustrates global shipments as reported by Gartner:

    Note that the growth rate has been negative for 4 out of the eight quarters since. The latest data shows a decline in shipments of over 9% bringing yearly growth to negative territory for the first time since the recession of 11 years ago.

    There's not much I can say that hasn't been said every quarter since 2010. The industry analysis as provided by Gartner suggests a different cause for the decline, becoming more creative each quarter. This time it's "challenging economic environment" and "lack of appeal and innovation", "delays due to tax incentives", "lack of new models", "conservatism", "clearing out inventory" and "softness".

    The primary challenge to these ascribed causes has to be that all these factors also affect the tablet industry and yet it's growing at phenomenal rates. The rate of new product introductions is not faster for the iPad than for PC vendors. The public and private sector buying conditions are the same. The "conservatism" on the part of institutional buyers should affect the newcomer more than the established.

    The notion that an outside challenger with a new platform, an unproven set of features and missing "security" should grow in the face of difficult macro conditions that are slowing the established platform makes no sense.

    My hypothesis is that the new products are solving new jobs for the users and those new solutions are trumping any "softness" in demand. In other words, an upgrade to an over-serving product will be deferred at the slightest excuse while an installation of an under-serving product that attacks an unsolved problem will be rationalized no matter the circumstances.

    One product will be met with "Why should we buy it?" and the other by "Why shouldn't we buy it?"

    These are the decisions made by millions every day and yet it seems that some analysts don't see any pattern forming. Such is the dilemma of disruption.

  7. Using Capital Expenditures to predict Apple's share price

    Research · 83 comments

    It takes money to make money. That's a cliché. But it's also true. The interesting question is how much can be gained from how little.

    In previous articles I explained how Apple's expenditures of capital for equipment used in manufacturing affects their output of products. The relationship between capital in and product out should stand to reason.

    The more surprising aspect of that analysis is that we get to know in advance how much Apple spends (since they tell us their budget a year before it's spent.) and therefore it becomes possible to get a rough idea of how much they will produce. And since demand has generally been higher than supply we can get an estimate of how much Apple will sell.

    The only missing piece to this logic chain is to estimate how much will shareholders benefit from the capital expenditure. I'll try to establish the relationship through a build-out of graphs.

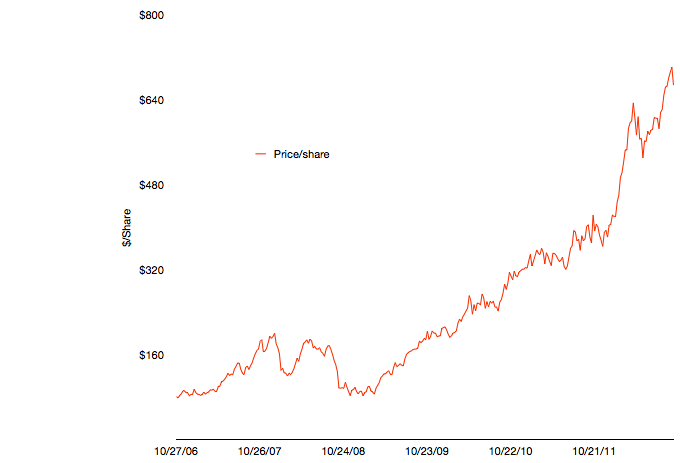
    The first graph shows Apple's share price at weekly resolution.

    The time frame stretches back six fiscal years. The time span includes some dramatic periods including the financial crisis and the launch of the iPhone and iPad.

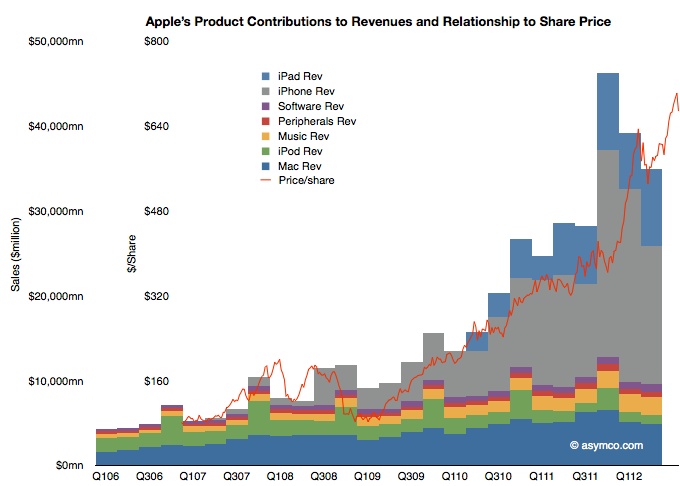
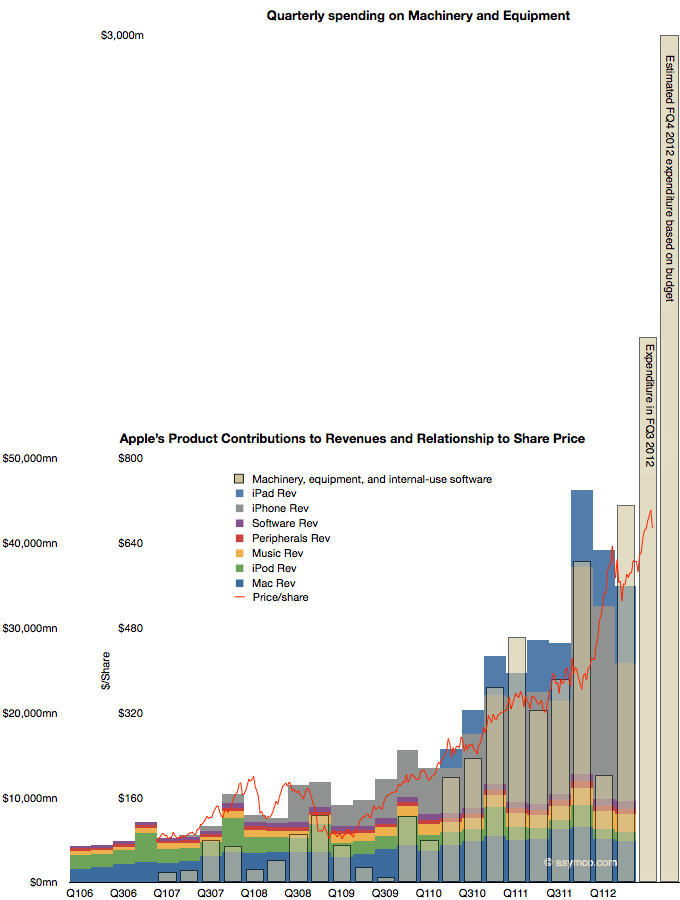
    To illustrate the effect of the iPhone and iPad on this share price appreciation, I've overlaid a quarterly resolution graph showing revenues over the same time period with each product line shown separately.


    Note that I've indexed the vertical scale to match approximately the highest peaks of both graphs. The two axes scales are shown separately on the left.

    The relationship between growing sales and growing share price is plain to see. Note that the iPhone and iPad account for the vast bulk of  sales growth and hence they are mostly responsible for the share price appreciation. Again, this should not be surprising. The scale gives an approximation of the relationship where $50 billion in quarterly revenue roughly yields a share price in the $700 to $800 range.

    As I've shown in the last post on forecasting production using CapEx (focus on the last chart) iOS device shipments (mostly iPhone and iPad) correlate with capital expenditures in the previous quarter. Using the historic relationship, the next two quarters could see a significant increase in iOS unit production. The sum of the low end of the range implies about 163 million units.

    If the relationship is therefore CapEx -> Production and Production -> Share price appreciation, then the transitive implication is that CapEx -> Share price appreciation.

    That relationship would be illustrated as follows:

    The CapEx data shows the offset to the right due to the relationship with production being time shifted by one quarter. Recall that expenditures are booked ahead of output and therefore we have this apparent view into the future.

    The fourth fiscal quarter's spending has just ended and the output will be produced during October-December period.

    The obvious question is whether production will increase in response to spending (as it has in the past), or, put another way, will the stacked bar areas follow the beige bars and, furthermore, will share prices follow production (as they have in the past) and thus the red line will follow the beige bar.

    It takes money to make money. The relationship seems to be that $1.5 billion of CapEx per quarter yields a share price of $800. With spending reaching $3 billion per quarter will the share price reflect a similar ratio?

  8. The Crucible of the Phone Market

    Research · 34 comments

    [The following was originally published on LinkedIn.]

    The US is in the forefront of smartphone usage. This has not always been the case. Five years ago only 3 percent of US phone users were using a smartphone, lower than the global average. At the time Palm and BlackBerry were the prominent devices in the US while in Europe Nokia's push with Symbian and Microsoft's licensing of Windows Mobile led to a smartphone adoption rate of about 7%.

    All that changed with the iPhone. After 2007 the US began to rapidly catch up and eventually overtook all other regions in terms of smartphone adoption. The latest data from comScore Mobilens shows that the US is now effectively 50% penetrated. The following chart shows just how quickly this happened.

    Image (media01.linkedin.com)

    In December 2009 only 17% of Americans used a smartphone as their primary phone. As of August the total reached 49.8%. By today the US is effectively a majority smartphone usage country and it looks like there is no slowing. We might very well see the US reach saturation with 80% smartphone usage in another two years.

    Of course, the US is not the first country to reach this threshold. Some northern European countries were there earlier, but North America is the first major region to get there. That means over 115 million smartphone users in one market. As a result, the US has become the crucible of the whole smartphone market. It's where platforms are most concentrated in use and therefore the most sensitive to the effects of that usage. That leads to more innovation, more discovery of new use cases and more ecosystem growth. Quite simply, it's where competition is most heated.

    This prominent position implies that the US could now be seen as a leading indicator of global trends. It might allow a keen observer to predict what will happen from US data. So what does the mobile platform rivalry look like in the US?  We are fortunate because the data is finely grained in the US. We have montly updates from comScore and we get specific platform penetration data. The following graph shows the shares of the major platforms since late 2009.

    Image (media01.linkedin.com)

    It becomes immediately evident that BlackBerry has lost a huge part of its user base to Android and iOS. In 2.5 years share when from about 42% to 8%. In raw numbers that's 11 million users that switched to another smartphone.

    Looking closer you can also see a consistent growth in share for the iPhone since mid 2010 with a slightly higher rate of increase of share than Android in the last few months. The problem is that this pattern of rapid decline in RIM and moderating growth in Android is not necessarily mirrored globally.

    RIM just reported an increase in total users during the last quarter (from 78 to 80 million subscribers.) Google also recently reported 500 million Android activations globally with no apparently letup in growth.

    So there seems to once again be a disparity between the US and global platforms. Do we take the US market to be anomalous or is it a pre-cursor to global trends?

    Certainly the US market is in many ways unique with a very low rate of pre-paid usage and a relatively high ARPU and average device pricing due to subsidies. However, the global trend has been to increasingly mirror the US not vice-versa. The iPhone has radiated out of the US in terms of usage and so has Android. Attempts by other platforms to make inroads in the US have been unsuccessful. Symbian failed to gain a foothold and it seems Windows Phone is stumbling as well. Both of these platforms have had more success outside the US. The US operator subsidy model has also been "exported" more than pre-paid has been "imported". By 2007 Europe was moving away from subsidies as prices of feature phones were coming down and 3G was still in its infancy. That was reversed as the large screen smartphones became the device of choice. In addition to device and operator trends, most apps originate in the US and the major social media platforms are all American-based. In other words, the modes of usage are being conceived in the US.

    On the other hand, the US is still a tiny percent of total consumption. It represents only about 6% of all phone users. Chances are that prices for devices in the US (especially the iPhone) can't be sustained for 5 billion consumers. Then there are "cultural" considerations where regions cling to their own usage habits and perceptions of value.

    So it's still an open question of whether the US is the leading indicator for how platforms might change globally but I would watch this data very carefully. When it comes to mobile platforms, it might be that if it plays in the US it will play globally.

  9. Speaking at TOC Frankfurt October 9 about publishing

    Research · 3 comments

    This is a quick note to mention that I'll be speaking at the Tools of Change (TOC) Frankfurt Conference this October on the eve of the Frankfurt Book Fair. Conference details:

    • Tuesday, 9 Oct. 2012, 8:30 a.m. to 6 p.m.
    • Frankfurt Marriott Hotel
    • Hamburger Allee 2
    • +49 (0) 69-7955-0
    • Directions

    You can get a 20% discount if you use the following code when registering:

    TOCPartner20TSpeaker

    I'll be speaking about the jobs publishers are hired to do. Without giving too much away, here is my synopsis of the talk:

    We're inclined to "categorize" or "segment" media according to its attributes. We think of visual, auditory or written forms as distinct. Within each of these definitions of media we further sub-segment according to the way they are packaged. As in books, periodicals, or TV vs. film and albums and singles. These definitions are convenient because they describe the product and the product has evolved into a distribution chain and a therefore a market. It becomes therefore analogous to think of a book market and a TV market and a periodicals market as if these are what people actually desire.

    But what people desire are more basic things. They desire to feel good or to be comfortable or to escape into fantasy or to be aroused. They have thirsts for knowledge or flights of fancy or needs for belonging. Authors and story tellers have sought to serve these needs for as long as we've been humans, regardless of the medium. When you step back and ask what the real "markets" are you realize that we've categorized according to technical and business means of delivering these needs.

    Business theorists have a word to describe this categorization: segmentation according to product attributes. It's a common practice to define markets according to products rather than what these products are hired to do. The great Harvard marketing professor Theodore Levitt used to tell his students, “People don’t want to buy a quarter-inch drill. They want a quarter-inch hole!” The idea that you can categorize by what consumers want to get done rather than what you are selling them is not new but it's still a very hard thing to get your head around. It's become known as "Job to be done" segmentation and has changed product planning for many firms. If you apply this method to your industry you realize that the products you sell are in competition not with other products like them but with completely new products. A newspaper may be in competition with Angry Birds and a TV show with FaceBook and a Movie with a cinematic themed video game.

    If you take the history of story telling and job to be done analysis into consideration you realize that technology has always played a part in how stories are told and re-told. This technological progress is accelerating and we are now in an era where apps are the new medium which can encompass much of any of the previous story telling mediums. Apps are so flexible and so easily distributed and consumed that they threaten to converge multiple media types. I'll explain how app economics are affecting not just games, but all forms of publishing.