This is a talk I gave today at Aalto University. It's a wide ranging talk and Q&A session lasting about 2 hours.
You can listen and see the visuals using the Perspective app on your iPad. Download the app (free from the App Store if you don't already have it) and open the link below using the iPad.
On October 5th, 2011 I asked Why is there no iPhone 5? The question was prompted by the pervasive media surprise that the 2011 iPhone launch was the "4S" and not a completely new design.
I answered this question with the conclusion that an iPhone "5" in 2011 would over-serve the market by offering more than most buyers would be looking for. That was because there could only be three groups of users the iPhone 4S would need to target: existing iPhone users, smartphone non-consumers and non-iPhone smartphone users. The majority of iPhone users in late 2011 who would be willing to upgrade were iPhone 3 or 3GS users and for them the 4S would be a huge improvement. Non-consumers would find the 4S attractive, as they would any iPhone; and existing smartphone users (mainly Android) would still be in their first contract and not likely to be looking to upgrade. Given the conditions at the time, the 4S was an adequate fit with customer expectations.
I wrote "The question will be very different a year from now when most early Android buyers will be looking for a new phone and when most iPhone 4 users (all 70 million of them) will be looking for a new iPhone. That would seem like a good time to introduce a new iPhone '5'."
It is now a year hence and we can consider how these same three targeted user groups see the new iPhone:
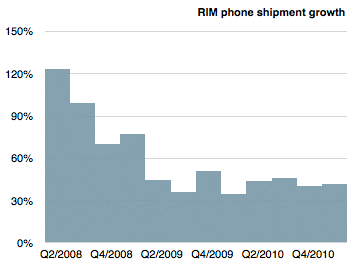
Quarterly financial data is often a lagging indicator of strategic success. RIM's vital signs were exceptionally strong up until early 2011. Consider the following graph showing RIM's device growth.
Using language commonly heard among analysts, one would say that the company was "reverting to the mean" and growing nearly in-line with the market. In other words, exceptional growth was over but continuing growth was likely. The company was returning to something "normal."
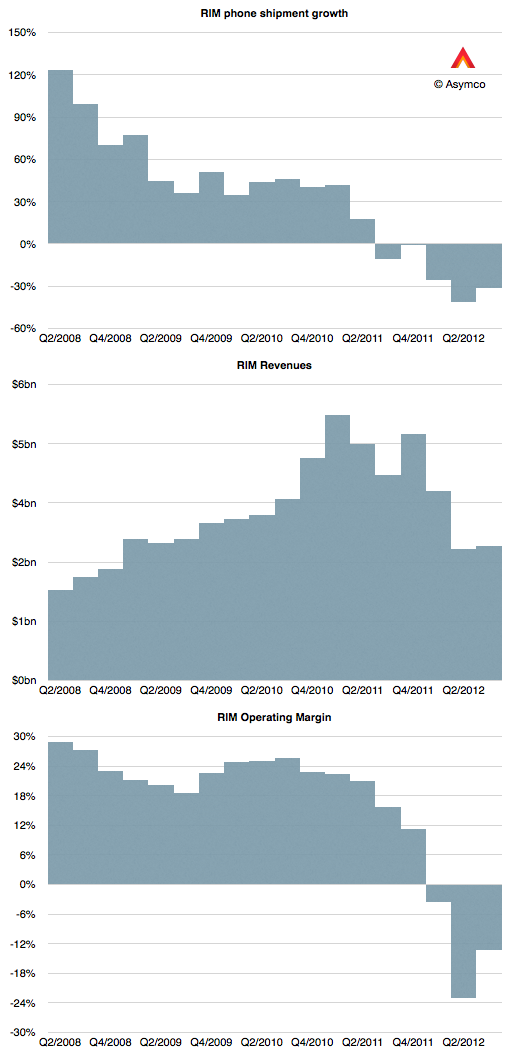
However, keen observers of the market would have been hard pressed to find any reason for justifying that performance. Seen through a disruptive lens, it was evident as early as 2008 that RIM's strategy was not sustainable. The company had a very weak smartphone product relative to emergent iOS and Android ecosystems. And yet, the company continued to prosper for nearly three years, through 2008, 2009 and 2010. Those shorting the stock during this period would have been unrewarded.
But then in early 2011 it fell off a cliff.
There was no reversion to the mean but an acceleration toward oblivion. The share price dropped to book value or below liquidation.
This pattern was very similar for Nokia. It too looked fairly strong on paper until early 2011 when it found it necessary to fling itself off a platform.
This pattern of disproportionate decline is a mirror image of the disproportionate ascent of Apple.
It might sound like a spectacular story; an anomaly, a once-in-a-lifetime reversal of fortunes. However, the moral of this story is that this is not an exceptional phenomenon. Disruption happens. It happens quickly and perhaps most quickly in this industry, and looking at trailing indicators like revenues and profits is of no help. I've only witnessed sharp expansions and sharp declines. I've never witnessed steady state, quiescent markets in technology. The history of platforms is always virtuous cycles followed by vicious declines. Whatever amplifies success seems to also amplify failure.
Rather than assuming that businesses are in a state of average growth or in some anomalous state above or below that average (from which they'll recover) we need to think of them being either growing or failing. Going straight up or straight down.
If this is the case, how can anyone expect to manage this? Orthodox management theory assumes continuity but the world seems discontinuous.
In a discontinuous framework it's important to look for unfair, unsustainable advantages that can be capitalized. Once exploited the advantage often disappears. The victim assumes it becomes sustainable. The survivor looks for another advantage. Resting is not an option and the mean is only an illusion.
Tim Cook is quoted as having said the inventory is not only evil but that it's fundamentally evil.
With just-in-time production inventory can be reduced, at least work-in-progress inventory. Unfortunately inventory cannot be completely eliminated. The fact remains that you sometimes need to stockpile product for launch and need to have some on hand depending which way it's sold. There is also substantial channel inventory (which is off Apple's books but still evil) that needs to be in the hands of distributors.
Tight inventory management has become a characteristic of Apple and that contributes to getting ranked number one in Supply Chain Management. So we can expect that Apple runs a tight ship. In fact we have evidence of this through the ability to track our purchases from when they ship out of a factory in China all the way to our homes.
This tracking in itself shows that when product is in high demand production is initiated on direct consumer orders not just in response to maintaining a level of inventory. So with that in mind, we can revisit the question of how many iPhones 5 the company has produced.
First, we need to step back and recall the method for analyzing production. I built a model which attempts to show what a typical production run for an iPhone model would look like. I first published the process in early 2011. It used the historic data from iPhone 1, 3G and 3GS to try to predict iPhone 4 production. I've updated the model to show what that would look like today.
The assumptions driving the model are:
There has to be some inventory on hand during any given month (i.e. inventory cannot be negative.)
Inventory has to be kept as low as possible. Preferably below one full month of shipments in the month. This rule needs to be broken on launch as there has to be an attempt to meet first month sales, which are usually substantial.
There is an assumed mix of older variants equal to about 10% of current model sales.
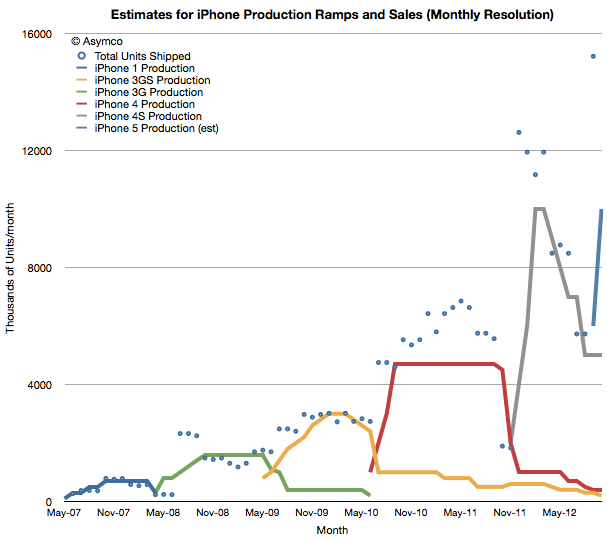
The results are shown below.
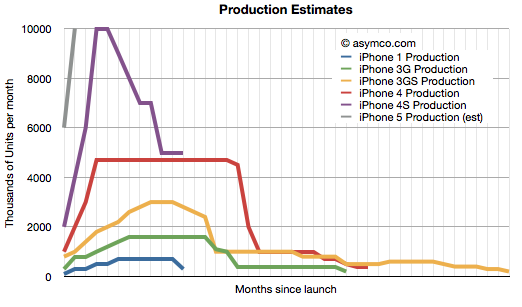
The solid lines are estimated production and the points are actual shipments (the resolution is monthly so quarterly shipment data is averaged over the months covered by the quarter and normalized for the number of days in a given month). Note that each product ramp differs slightly in shape but that overall there is a doubling of peak production. This is shown more clearly in this view where each production ramp is indexed to the same starting point.
The ramps roughly match the shipment data which assumes the JIT production method is being used. Note also that the start of production was roughly double that of the previous product run--consistent also with the spending on capital equipment (Machinery and Equipment as part of PP&E). Note also that the iPhone 4S was more "peaky" with a shorter maximum run than the 4 but that the 3GS also was peakier than the 3.
The iPhone 5 production, shown in grey, assumes 10 million units sold in September and a quicker ramp to maximum run rate. The need to have units on hand led me to assume 6 million units were produced in August and none prior to that. We don't yet know peak production or duration of peak production but my guess would be that peak will be well above 4S level, perhaps 15 million per month and that the run will be longer than the 4S.
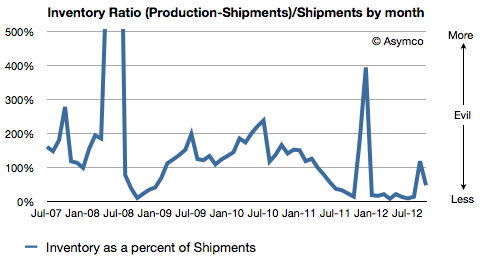
The maximum inventory on a monthly basis runs to about 6 to 7 million for the iPhone 5 but as a percent of total shipments, I'm assuming the performance is improving over time. The following chart shows this ratio:
For the sake of argument, I would create an equivalency between this ratio and the amount of evil present. My model is based on many assumptions and a mostly a work of (informed) fiction but it would not surprise me that the amount of evil is decreasing.
When Apple announced five million iPhone 5 were sold to end users over its launch weekend, I was surprised. Not because my guess had been around 6 million, but because the company had set expectations by announcing a doubling of pre-orders from the year-ago 4S launch.
Instead of doubling its performance for the launch weekend the company only sold 25% more units. How can there be this discrepancy? Is this a sign that demand is not growing at the rate we've become accustomed to? Is it a sign that there are shortages of components or labor or other production problems?
No, probably none of the above.
What we saw in the 5 million figure is what the company was able to deliver in the hands of buyers. It's possible that there were people who did not get a phone when they wanted it, and at the same time it's possible that some phones were available for sale and did not get bought.
This is because Apple offers the product through multiple channels. Some channels like Apple Stores may have gotten too many units while other channels like their on-line store, operator stores or retail partners did not get enough.
In other words, we have a situation of over- and under-supply (or over- and under-demand) simultaneously because the product is misallocated.
Can this really happen?
The fact that pre-orders were twice as fast indicates that online purchasing was much more popular. The company's press release suggested that only "a majority" of online orders shipped so far and we know that day one delivery of units was only offered to online buyers for 40 minutes.[1] At the same time some stores seemed to have plenty of stock.
This is easily explained. It's possible that this year a larger group of consumers decided that braving long lines is not their cup of tea. Instead, this larger proportion could have chosen to bravely endure waiting for a package at home rather than the companionship of their fellow man. Maybe the population of buyers is broader this year as one would expect from such a large base, and there are fewer who have the time or inclination to queue for a device.
If the shift to online from in-store was unforeseen, the company could easily have allocated too many units to retail and not enough to online resulting in weeks-long waits for orders placed online and relatively short waits in queues.
It's easy to fault the company for making this error. However, we can only calibrate our expectations on what we've seen before. If the company measured demand in its stores and on-line for three years and saw a pattern, it would make sense to allocate the limited supply according to the same pattern of demand[2].
But overall, the performance of the product is relatively solid. The iPhone 4S launched into seven countries in 2011 with a total combined population of 704 million and sold 4 million units in three days. The iPhone 5 launched into nine countries in 2012 with a total combined population of 721 million and sold 5 million in the same amount of time.
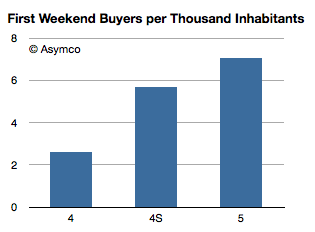
That means that 0.57% of the addressable market bought an iPhone 4S in three days and 0.69% bought an iPhone 5. A handier measure might be that 7 out of 1000 inhabitants in the launch countries bought an iPhone 5 in the first three days.
The pattern for the last three phones is shown below:
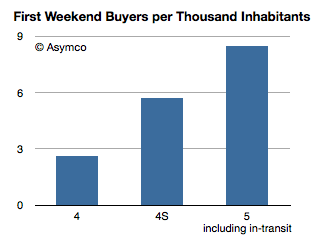
The growth from 4S to 5 is subdued, but it fails to account for the in-transit inventory. Assuming that due to the misallocation of stock, unfilled online orders number one million then the growth would look as follows:
For the markets iPhone launched in, this would be a fairly healthy take-up rate. Anecdotal evidence I've seen suggests that 1% penetration on day one is not uncommon.
---
Notes:
The fact that more than those initial promises were met means that the company quickly re-allocated stock and production to online after they sensed there was a problem.
Demand estimates are also driving the allocation of production capacity and capital expenditures for process equipment and pre-purchase agreements for components. All indications are that these allocations are running at the usual growth rate.
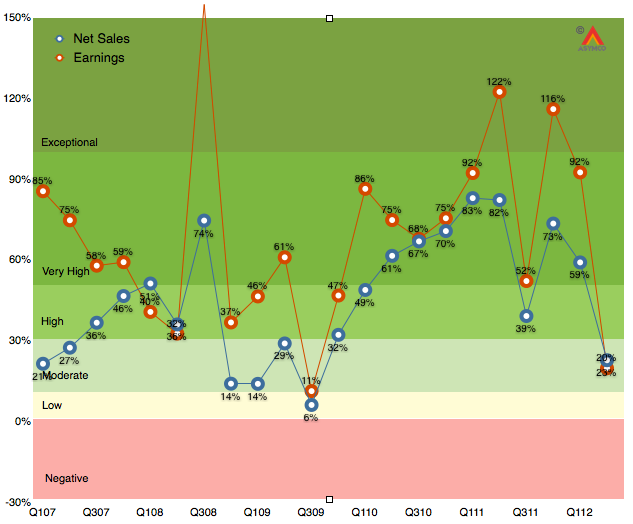
As the chart below shows, the last quarter (second calendar 2012, third fiscal 2012) was disappointingly moderate with 20% earnings growth and 23% net sales growth.
It was the first quarter since the iPhone launched that earnings growth has fallen into moderate (below 30%) territory. Much of that disappointment (to me) was the relatively low performance of the iPad following a launch quarter. The iPhone was weak as well, though that was expected. As I said last quarter, the iPhone is still the most important component but the iPad is becoming increasingly decisive in overall performance. In fact, I’m projecting that the iPad will have the same revenues as the iPhone had one year earlier.
The iPhone is going to be extremely difficult to project. On one hand we have the launch of the i5 which will account for about 10 million units in the quarter, on the other, chances are that sales were very weak prior to the launch as purchases were being deferred even more than during the last quarter.
So with these very meager clues, here are my estimates for the quarter (with y/y growth in parentheses):
iPhone units: 27.8 million (62%)
Macs: 5.6 million (15%)
iPads: 18.8 million (69%)
iPods: 5.6 million (-15%)
Music (incl. app) rev. growth: 40%
Peripherals rev. growth: 10%
Software rev. growth: 15%
Total revenues: $39.5 billion (40%)
GM: 42%
EPS: $9.75 (38%)
This earnings value would imply a trailing twelve months’ EPS of about $45.2. At the current price of $697/share the P/E would be 15.4. Cash and equivalents will probably increase to $125 billion or $131/share. Excluding cash, the P/E would be 12.5.
[Update. The EPS figure above includes a tax rate estimate of 30%. Company guidance was 25.5%. Using the company's guidance yields an EPS of 10.43. TTM EPS becomes $45.9/share and at $697 the PE is 15.2. At time of this update the share price has fallen to $665 and thus the pro-forma trailing P/E ratio is 14.5).]
With its recent release of the new Kindle Fire HD tablets, some have argued that Amazon has declared war on Apple and its iPad. But how serious is the threat? Are the two companies even playing the same game? I reached out to analyst Horace Dediu, founder and author of Asymco, to get his take. Dediu will speak on all this and more at TOC Frankfurt on October 9, 2012. Our short interview follows.
Matteo Fumagalli is a student of economics at University of Insubria, Italy. He is writing a thesis for a bachelor's degree analyzing the smartphone industry.
He asked me to answer the following questions:
-First question is about you. Why did you found Asymco?
I founded the company to develop software, mainly apps. I began writing the blog as a way to drive traffic to the site. I would have preferred to build a blog only but did not think it was possible to earn any money doing that so I treated it as a hobby. Even after the site became more visible I changed from development to consulting and did not expect that writing in itself could be self-sustaining. It took about two years before I felt comfortable with the idea that I could do writing and speaking exclusively. I am still exploring additional business models however.
-You worked 8 years as analyst and business development manager at Nokia and you anticipated their current crisis with your first post on Asymco. Do you think Nokia will have the chance to recuperate, and eventually what will be the role of Windows Phone?
Nokia may recover or remain independent, at least. But it will be far smaller. The idea of a return to dominance or 40% share seems very unlikely. As I pointed out in the first post, the organization cannot cope with the new marketplace. Large organizations require extreme stress and damage to change. It's a phenomenon at all levels of society that success results in rigidity. From the individual to the nation to the civilization, success makes change very, very difficult.
Windows Phone is an attempt to create a third ecosystem. I am concerned that the logic of having a third alternative is not solving a consumer need but an operator need. In other words, consumers are not asking for a third option and when they are presented with a third option they are not excited by it. The consumer does not think in terms of increasing their options. They decide once every two years which phone to buy and that is the end of their thinking on the subject. By focusing on the operator's needs the platform is fundamentally mis-positioned.
What Windows Phone needs to be positioned as is either as fundamentally different, solving a different job for the consumer. Or fundamentally better along a new dimension like price or convenience. These are some of the claims it makes but they are very weak claims right now.
-What about RIM, other company which is going through difficult times? What do you think about their decision not to move to Android and stake everything on their closed OS?
The decision to remain with their own platform may sound risky but it's a simple decision about retaining their business model. RIM is not a general-purpose manufacturer. They have always made an incremental margin on services, messaging and email. For them to use a third party OS would force them to build within the constraints of that OS or platform. That would result in a difficult competitive environment and not one where the company could sustain margins vs. larger competitors. In other words, the company faced two risky alternatives. They chose the risk they were more familiar with or the one that they already had an operating company organized for.
-Recently Apple lost market share in Europe and China favoring Android. What will be the impact of iPhone5 on this situation? As expert of Apple strategy, do you think Apple has done something wrong in these last months?
Apple lost market share when considering the smartphone market. I agree with management (and I've argued this before they did) that the market for the iPhone is all phones, not just smartphones. In that context, Apple is increasing its share consistently. Since Apple has only one product in the market (with some residual older versions as well), it's very seasonal. It would be natural to see variance in share through the year. What should be watched is a four period average performance. Overall, Apple is growing its iPhone business faster than the overall phone market so it follows that its share is increasing. I see a long-term potential for the iPhone having 20% share of all phones. That would give it an installed base of over 1 billion users.
-Smartphone penetration is reaching 60% and we probably talk about saturation in next 2 years. What will be for you the future role of tablets and phablets, they will be threaths of substitution for smartphone or maybe an opportunity to offer complementary products?
The evidence so far is that buyers don't mind having more than one device. It makes sense if each device is hired for a different job and it cannot be general purpose enough. We've seen this phenomenon with mobile phones where penetration in many markets is above 100%. That implies that even a basic feature like a phone number cannot serve all the needs on one person. To me it seems likely that one person will have more than one device and more than one form factor.
-What do you think about legal battle between Apple and Samsung? There will be consequences also for Google and Android?
I defer to my blog post Deus Ex Machina. Legal battles are not strategy.
-What will be the role of the possible entry of Amazon in the smartphone industry? It's too late for them?
Amazon is a retailer. I find it hard seeing a retailer becoming a platform provider. Not only is retail a difficult to expand business model internationally, but it's hard to imagine partners being comfortable building an ecosystem on top of retail. Retail is not sufficiently flexible as a business model.
We don't want to just make a new phone. We want to make a much better phone.
- Jony Ive, video at iPhone 5 launch event
Disruption theory has taught us that the greatest danger facing a company is making a product better than it needs to be. There are numerous incentives for making products better but few incentives to re-directing improvements away from the prevailing basis of competition.
This danger is more acute for technology companies. Coupling incentives with the speed of improvement in various technologies (aka Moore's law) means that over-service can come suddenly and more quickly than warnings from the marketplace. A product can tip from under- to over-shooting the market within one product cycle. One year the product is under-performing and trying to catch up to the competition and the next it's superfluous and commoditized. The dilemma is compounded by the cycle time of development which can span multiple product cycles.
Therefore, how to tell whether a product is over-serving a market is one of the most important and frequently asked questions I get asked. It's easy to see over-service in the rear view mirror when looking at a multi-year pattern. The trouble is that by the time you see the data, it's too late. How do you tell you're on the cusp of good enough, subject to imminent disruption before you get there?
I consider measuring a product's absorbability to be a marketing problem. The marketer's job is to read the signals from the market[1]. Determining absorbability comes down to reading two market signals, both of which must be met before green-lighting an improvement: (a) a product's improvements must be used and (b) a product's improvements must be valued.
If a product's improvements are not used and the buyer will not pay more for them then they are not being absorbed and the effort to develop the improvements should be redirected.
Now the problem becomes one of measurement. Of the two, utilization is easier. Data can be gathered on whether a feature is being used. Research methods exist to tell if a feature would be used even if it's not available[2]
The more difficult assessment is that of the value of a feature. You can usually only tell value by trying to price it and watching what happens. For example, you add more speed/memory/capacity and try charging more (or the same) for the product. The acceptance will be measured by sales growth and will give you an indication of whether these improvements are valuable.
If you have to add features and drop prices at the same time then it's likely that the market does not value the improvement.
But this is extremely risky. You need to wait through a sales cycle and iterate through a development cycle before you have an answer. In a space where competitors are placing opposite bets, the experiment fails even if you get the data.
How can you structure a value measurement experiment without wasting an opportunity?
Rather than dealing with hypotheticals, let's use the iPhone as a test case. As Jony Ive states, the focus for the latest iPhone was to make it better. Is this improvement absorbable? What happens if Apple's bet on being better is wrong?
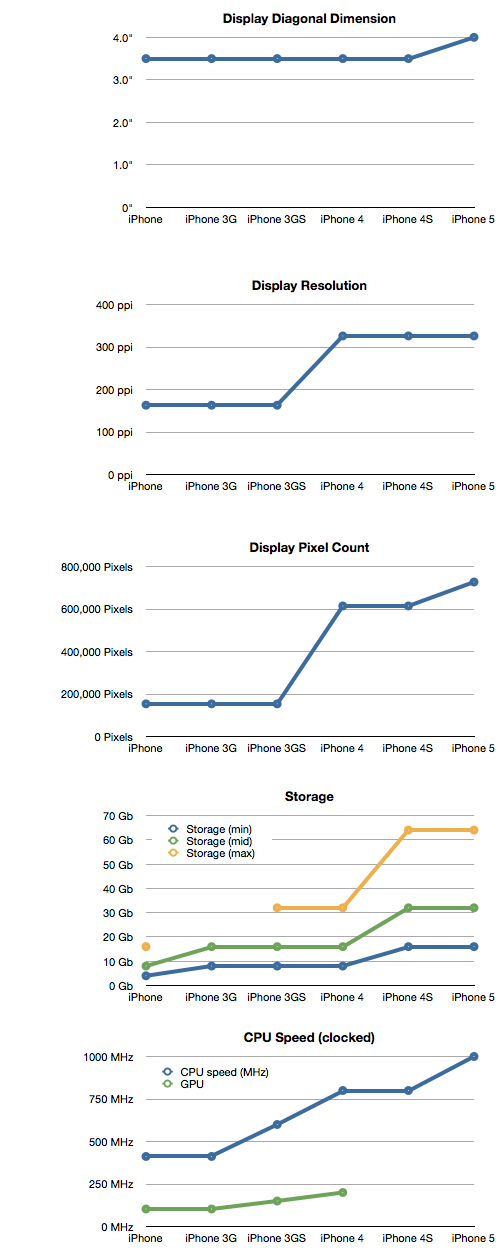
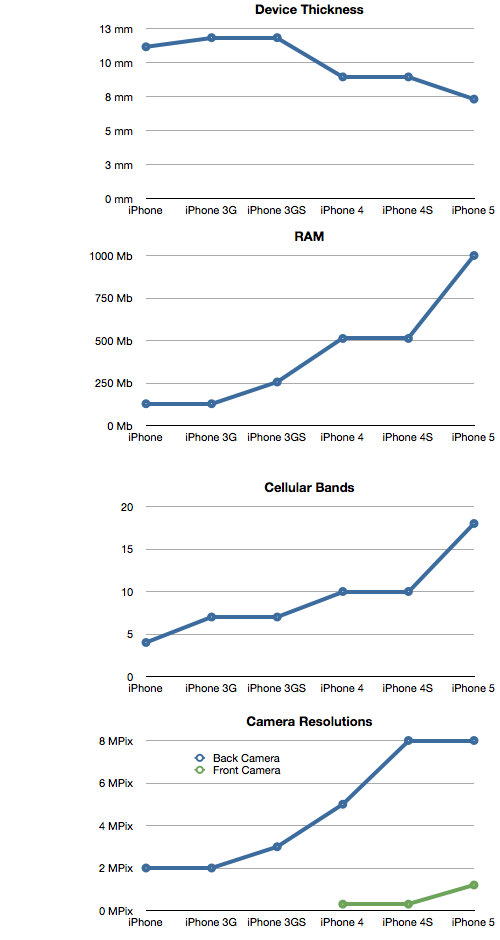
First, we can confirm that the iPhone has been on a trajectory of getting better and that those improvements have been absorbed so far. We can measure the history of performance of the product (roughly doubling every year) and we can also measure proxies for performance as I have in the following charts:
As the product has been improved along these dimensions, sales have increased and prices have held steady (even rising occasionally.)
The question is about the future: what about the latest "5" variant?
The clue to this experiment is the presence of a control group. We could test the question of absorbability by keeping a version of the product which did not improve (or got cheaper) and measuring whether it performs better vs. the "improved" version.
Of course, this is exactly what Apple does with the n-1 generation products. By ranging products which are older and at lower price points it can measure whether the improvements are valued.
If sales of the n-1 variant were to increase relative to the new version then they can understand when they are at the point of good enough. The experiment is brilliant because the margin on the older products is maintained even at the lower price point.
We don't have public data on the performance of the old vs. the new but some studies show that, at least in some markets, the older variants have, so far, been a minor part of the sales mix. The CIRP study from early this year showed that about 90% of holiday iPhone sales in the US we for the latest (4S) variant. If this pattern persists globally and for the 5 then the improvements can be said to be valued.
If the new features (as represented by the metrics charted above) also get broad engagement--data which Apple can easily obtain--then the iPhone 5 can be declared not good enough. The company can then comfortably work on improving it further.
---
Note that the marketer's job is to listen not to talk.
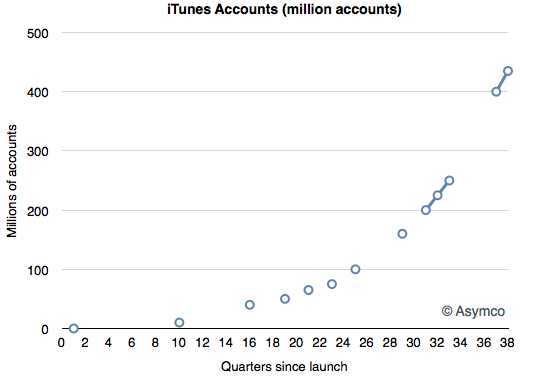
During the iPhone 5 launch event, Apple announced 435 million iTunes accounts (with credit card numbers) with one click shopping.
The account total is updated occasionally by Apple and the history of these updates is shown below:
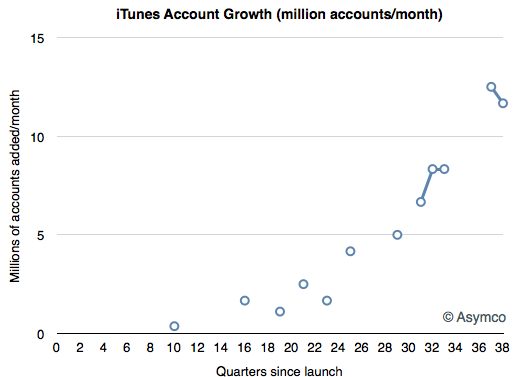
Measuring the growth in accounts shows steady acceleration.
The current rate is approximately 12 million new accounts per month.
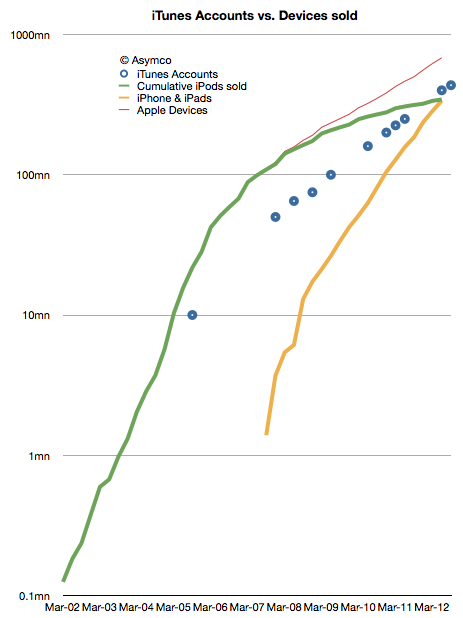
The growth in iTunes accounts mirrors the growth in iOS usage as shown the following chart:
The alignment between the circles and the red line should offer an alternative method of projecting the platform's growth.
Projecting the growth forward would imply one billion accounts in another two years. As iPhone and iPads growth increasingly converges with iTunes (of which there are 400 million units sold), the same time frame could apply to iOS cumulative sales.
This is not a very precise forecast, but late 2014 to early 2015 could see one iOS billion units sold.
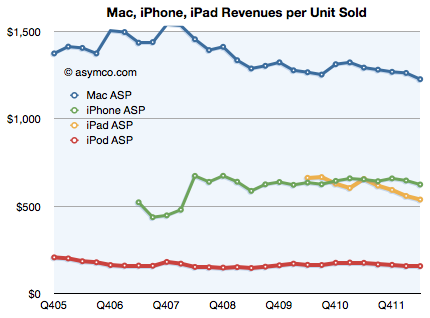
The most remarkable thing about the iPhone as a technology product is that it has been able to maintain pricing stability for over five years. As the following chart shows, the revenues per unit sold for the iPhone (as reported by the company) have held even as volumes grew exponentially.
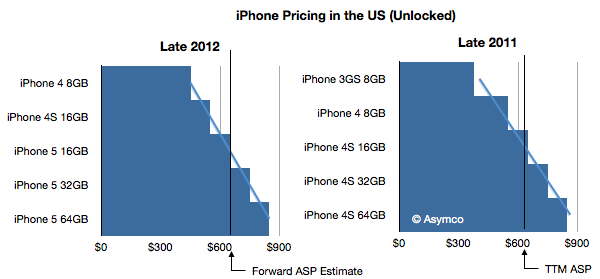
The latest version of the product should see no significant change in this pattern. I show below the price spectrum of the iPhone as available unlocked in the US (therefore assuming no sales taxes or VAT and no subsidy). I also highlighted the average revenue per unit from the latest four quarters.
The only difference between 2011 and 2012 is that the lowest priced variant is now $450 vs. $375 a year ago.
Without knowing the split between products, it's hard to tell how much impact this price increase will have. Note that the average price was very nearly the same as the 16GB variant ($643 ASP vs. $649 16G pricing). Assuming equal volumes for each variant, the average pricing for 2011 would have been $634. Therefore the actual ASP was only $9 higher than average pricing.
If we assume the same for this year (equal split between variants + $10) then the average price could rise to about $660. That would be a slight increase but it would be multiplied by many more phones sold.
In fact, going from $634 to $649 and selling 200 million units would imply an additional $3.4 billion in revenue.