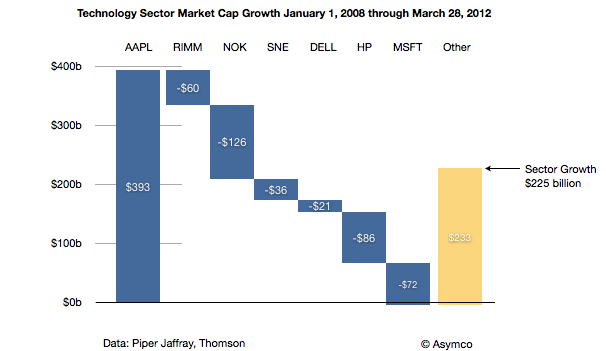
Philip Elmer-Dewitt published a table from Piper Jaffray's Gene Munster which has some interesting details. Munster has taken a four year "tech sector" view of value creation (and destruction) and tried to see if there is a bound on the value Apple can continue to capture. This "share of value" is one of many approaches to bounding an opportunity. You could consider "share of wallet" by measuring disposable income, or "share of eyeballs" by measuring screen time available or even "share of GDP".
The attractive part of the share of value of industry is that we have an implicit way to see winners and losers, or the transfer of wealth from one group to another. I charted the data published as follows:
Seen in this context, Apple generated nearly as much value[1] as RIM, Nokia, Sony, Dell, HP and Microsoft destroyed. The rest of the sector generated $233 billion of value but if it were not for Apple, the tech sector would have declined by $168 billion.
As a result, Apple went from being 5.6% of the value of the sector to being nearly 17%. The argument goes that its share of value could still increase further even if the overall sector does not. At 30% of current total value, Apple would be valued above $1 trillion.
My observation is that the conservation of value exhibited in this data is not the entire story. What is gained by Apple should be more than what is lost by others. The disruption under way has had victims but the net value created should be more than what they lost. The iPhone and iPad should be competing with non-consumption, bringing new value into the sector from other sectors or from non-productive capital. Perhaps they are and the losses by the cohort arrayed above are incidental, but there is likely to be a blend of competition and new market growth.
Does the analysis satisfy?
Perhaps. It's one more perspective into the puzzle. Growth rates, market sizes, technology improvements, brand and satisfaction analysis as well as jobs to be done are all offering perspective views. I would say there is consistency in the data but they should all be weighed with vigilance.
---
Notes:
Market cap is the perceived net present value of all future cash flows discounted to the present for a publicly traded company and hence defines the value created by the firm. It's measured by markets so there is room for error but it's the best measure available and has historically been accurate over long periods.
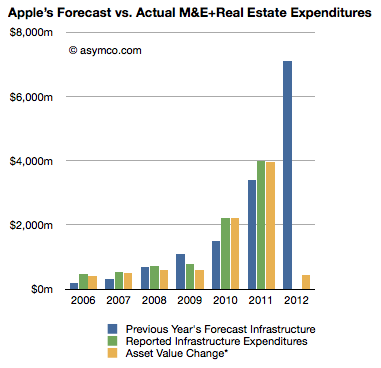
At the end of 2011 Apple's net property, plant and equipment (PP&E) was $7.8 billion. This reflects $12.34 billion gross PP&E net accumulated depreciation and amortization of $4.5 billion. The depreciation and amortization increased by a total of $533 million and the gross PP&E increased by only $572 million. I say "only" because in the previous quarter PP&E increased by $1.42 billion. If we assume that this growth is equivalent to capital expenditures for the quarter, it's also a very small amount given the company's stated intentions to spend $7.1 billion during the fiscal year.
The gap is illustrated in the following chart:
The blue bar in the 2012 year represents the company's stated intentions (from the 10K). The Yellow bar in 2012 is what has been spent so far as measured by the change in reported asset values. Given that the company has been exceeding their targets lately, one should expect the yellow bar to reach as high as $8 billion after another three quarters.
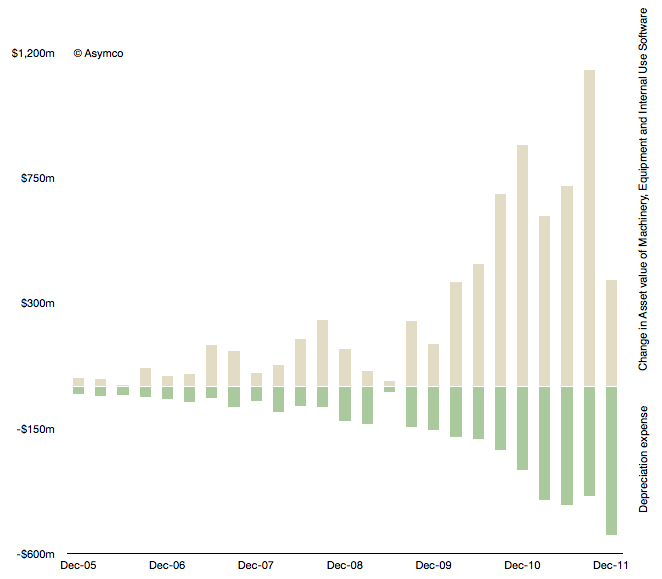
Another view into this data is provided by the following chart.
The beige bars represent the quarterly change in asset value and the green bars are the depreciation expenses for the same quarter. This view also shows a significant slowing in spending.
In the past I showed that CapEx, especially spending on machinery, equipment and internal-use software correlates with iOS device production during the next quarter. It's not a relationship that helps much in quarterly predictions due to the elastic nature of product transitions. There were quarters when spending and output were de-coupled, for example spending in March and June 09 quarters was far lower than one would expect for the 3GS launch quarters that followed.
We will have to keep an eye on the change in asset value to be reported for CQ1 to see how the spending ramps up during the year. At this time the company needs to spend at least $6.5 billion in three quarters or over $2 billion per quarter to meet its target for the fiscal year (ending October this year). We have to see whether and why Q1 (fiscal) was too low.
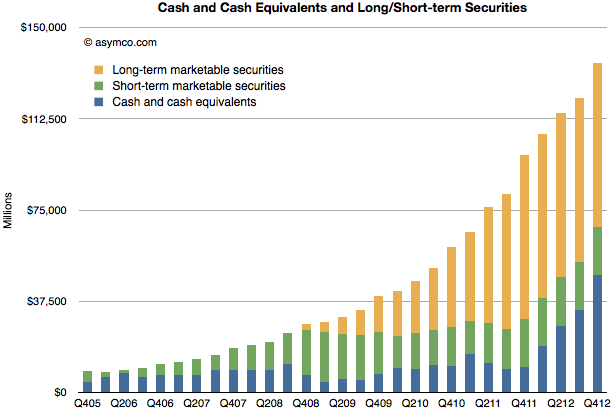
This discussion is also affected by the discussion on Apple's other balance sheet item: cash and cash equivalents. The magnitude of its assets is staggering: $100 billion in cash, $7.8 billion in PP&E, $3.47 billion in acquired intangible assets (mainly patents), and $896 in Goodwill (acquisitions). With this much "capital" the company does not make use of any debt facilities.
In this regard Apple is also an apparent anomaly. As it gets subtracted out of indexes because it weighs too much or skews "reality" so Apple and its balance sheet is causing a warp in "time-space" of capital markets. The traditional relationship between financiers and operating companies assumed some form of symbiosis but as the credit crisis has shown some have not kept their part of the implied bargain.
So we have to ask yet another unsettling question: what is the value of capital markets when their products are commoditized by relatively unsophisticated CFOs?
---
Notes:
This is the material accompanying the third case discussion at Asymconf. Participants are encouraged to read it at the material linked before the show.
Charles Arthur, writing for The Guardian, has noted that court filings seem to be revealing Google's Android revenues. If this is the case, we have a significant breakthrough in understanding the economics of Android and the overall mobile platform strategy of Google.
The new data is a reference to a settlement offer Google made to Oracle of $2.8 million and 0.515% of Android revenues on an ongoing basis. The key assumption to make this data useful is that the $2.8 million offer represents 0.515% of revenues to date.
In other words, that revenues from 2008 to end of 2011 multiplied by 0.00515 results in $2.8 million. That implies that revenues from 2008 to 2011 were $544 million.
I think that's a fair assumption. I don't see why Google would offer a higher or lower royalty rate for years 2008 through 2011 than for years after 2011. The offer would seem to be 0.0515% in the future as well as retroactively in the past.
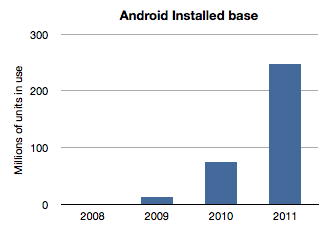
If we work with this assumption then the next question is how to distribute this $544 million over the four years 2008 through 2011? The installed base of Android has grown exponentially and it would seem logical to assume that revenues have followed in a similar pattern. Here is a chart of installed base given activation data supplied by Google.
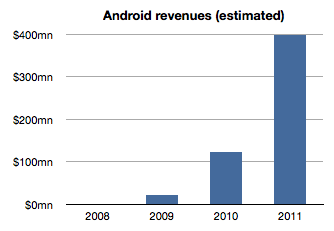
If we assume revenues were distributed the same way we would get something like this:
The sum of the bars in this chart equals $544 million and the ramp is approximately the same as the installed base. The relationship between the first graph and the second is a multiple equivalent to the revenue per device.
Therefore a second assumption is that revenue per device remained fairly constant. In this model the revenue comes out to be about $1.70 per device per year. It's possible that rev/dev/yr. is increasing as Google services are discovered by users. It's also possible that the rev/dev/yr. is decreasing as later adopters are less likely to engage as early users. I just don't know how to adjust this value so by leaving it at the average, I can avoid introducing more assumptions.
Now we can stop and look at this figure and do a test. Does $1.70 make sense as a device revenue for Android? Google had spoken about targeting $10/device/yr. but we have no indication that they are nearly at that level. If they did achieve that level, with an installed base of 300 million, Google could be collecting $3 billion a year in Android income. Are they getting it?
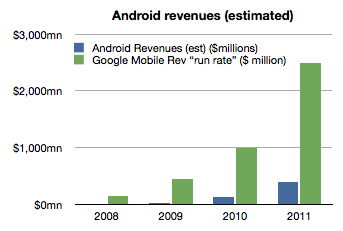
As of October, Google mentioned that it had a $2.5 billion "mobile run rate". But we know that this figure is not only from Android. Mobile includes all mobile devices and services including those running inside iOS, Symbian, BlackBerry, Windows Phone, etc. They could be counting ads on all mobile browsers as well as ads running inside all apps on all platforms. Furthermore, Google also testified that iOS accounts for two thirds of their mobile search revenues[1].
Adding run rate to the Android revenue chart results in the following:
So the step is to take the "run rate" figure of $2.5 billion and assume, as Charles Arthur did, that iOS income is what is left after taking out the Android part[2]. I also noted that Google previously mentioned a run rate of $1 billion and I will assign that run rate to 2010 and $2.5b to all of 2011. Since we know the number of iOS devices in use for years 2010 and 2011 we can calculate Google's revenues per iOS device in use.
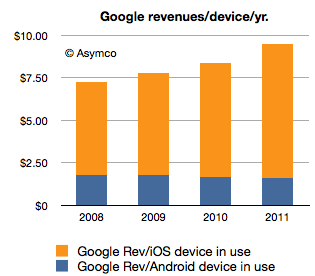
If we thus combine all the data we know (revenues derived from settlement offer, units in use, run rate and iOS installed base) we get the following revenue profile:
This shows a positive trend for Google: revenues per smartphone per year is increasing. However, the growth is coming from non-Android devices which means mostly iOS. Revenues per device for Android is probably declining.
The story for iOS revenues however is not all rosy for Google. Google has to pay for that revenue. The mechanism is a payment that Google makes to Apple for the prominent and default placement of Google search on Safari.
We don't know the terms of the arrangement but if we assume $2/device Google needs to shave $2 from the top of the chart above with that money going to Apple (attached as iPhone/iPad service revenues.)[3]
That still leaves a healthy $8.33 in 2011 as operating income from mobile with $1.70 or so coming from Android.
However, to make this operating income into bottom line profit, we have to extract the R&D and SG&A associated with mobile at Google. This would be, therefore, Andy Rubin's yearly budget.
Andy Rubin has stated in the past that Android is profitable. That is certainly believable. The budget would have to be about $400 million/year in 2011.
Charles Arthur concluded that Google obtains four times more revenue from iOS than from Android. My estimates indicate that in 2011 the revenue ratio was closer to 5 but if we subtract the cost of those sales in the form of payments to Apple then the ratio could well be four to one.
Many of these figures begin to "hang together" as we balance assumptions about costs, revenues and statements made in public. There is a consistency within a comfortable margin of error. If that is the case, then the economics of Android begins to take shape.
My take is that it's not a bad business. But it's also not a great one. As long as there is exponential growth in units, Android will improve its position inside Google relative to iOS. But from Google's perspective, iOS is today a bigger business. And iOS is not standing still. It's growing not only in terms of units but in revenue per unit.
Strategically, and historically Android was never one thing. P&L considerations were not the only (or even at all) factors in investment for Google. Having a hedge against hegemony of potential rivals, having a means to learn and develop new business and having a role in defining the post-PC computing paradigm are all probably bigger considerations than profitability.
So in terms of returns, Android is sustainable. However, in relative terms the value created leaves much to be desired. Whereas Android generates $1.70/device/year and thus an Android device with a two year life generates about $3.5 to Google over its life, Apple obtained $576.3 for each iOS device it sold in 2011[4]. The economics of Android are nothing like the economics of iOS.
---
Notes:
This figure is also not conclusive as search is not the only form of revenue on a mobile device but it does imply that Android is not the majority of Google's mobile revenues.
Clearly this is overstating iOS as the non-Android income is broken up between several platforms. We can only say that iOS is the vast majority of non-Android income.
Assuming a $2/device payment model means Google paid $312 million to Apple in 2011 and $171 million in 2010. This would go toward boosting Apple's revenue per iOS device. Naturally, if this distribution cost is higher or would be subject to re-negotiation then it could vary widely.
The iOS figure includes accessories and licensing of trademarks but excludes income from App Store, iTunes music, movies, TV shows, iBooks, greeting cards or textbooks.
RIM’s CEO, Thorsten Heins was quoted as saying, “We plan to refocus on the enterprise business and capitalize on our leading position in this segment. We believe that BlackBerry cannot succeed if we tried to be everybody’s darling and all things to all people. Therefore, we plan to build on our strength.”
RIM's latest quarterly results show a continuation of the decline in sales that began in Q1 2011.
Here are the highlights:
Smartphone units declined 26% y/y and 21% sequentially. Over a four year period the company still shows a positive growth of 20% compounded, though that is far below industry average
The smartphone revenues were down 29% y/y and 23% sequentially.
Including service revenues, the revenue per smartphone dropped to $346, a drop of 4%.
I estimate the phone operating margin to be less than 5%. The company swung to a net negative operating margin due to write-downs of tablet inventory but the phone business managed to break even.
Operating income from phone operations dropped to the lowest level in five years.
The company is still generating cash flow and has a cash reserve of over $2 billion.
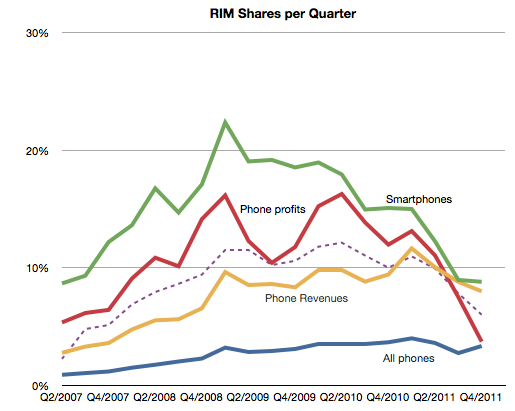
Seen in isolation, the company is clearly struggling but does not seem to be on its last legs. But no company should be seen in isolation. As part of a competitive market, the company is in far worse shape. The following chart shows the AMP index which measures relative performance through a blend of market shares.
This chart does not include the latest quarterly data but if it did it would be sure to show a continuing decline. The AMP index actually shows RIM peaking in Q1 2009, well before the volumes peaked.
It's within this context that we need to evaluate the new CEO's strategic shift. In the quote above we have the first significant strategic departure and split from the past. Should it inspire hope or despair?
The idea of focus has huge benefits. Focus and the art of saying no are keys to greatness. However, you only succeed if you focus on the right thing. "Enterprise" is not the right thing. It's not a valid target. Enterprise support is a feature, not a product. I don't mean that as opinion, but as a point of fact. Focus on a set of customers whose only characteristic is a job description is missing the whole point of focus.
Focus needs to be positioned on a job a brand needs to be hired to do. The idea should be to solve an open problem which is either too complex or too uneconomical for anyone else to solve. Corporate buyers have problems to solve but the BlackBerry no longer offers unique or defensible solutions. Furthermore, corporate buyers are themselves being dis-intermediated from the computing purchase decision. Sometimes this process is called "consumerization" but it is more plainly explained as "commoditization". The selection of tools for workers by a group that claims to understand their needs better than they do is an archaic concept.
This was true even in 2005 when RIM began targeting consumers. It was then that they saw the writing on the wall--that their enterprise business was being commoditized. All of RIM's growth since has been in consumer segments. By abandoning that trajectory RIM is effectively giving up on growth. And giving up on growth is simply giving up.
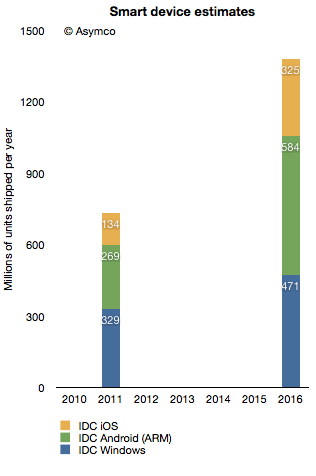
In terms of platforms, IDC expects a relatively dramatic shift between 2011 and 2016, with the once-dominant Windows on x86 platform, consisting of PCs running the Windows operating system on any x86-compatible CPU, slipping from a leading 35.9% share in 2011 down to 25.1% in 2016. The number of Android-based devices running on ARM CPUs, on the other hand, will grow modestly from 29.4% share in 2011 to a market-leading 31.1% share in 2016. Meanwhile, iOS-based devices will grow from 14.6% share in 2011 to 17.3% in 2016.
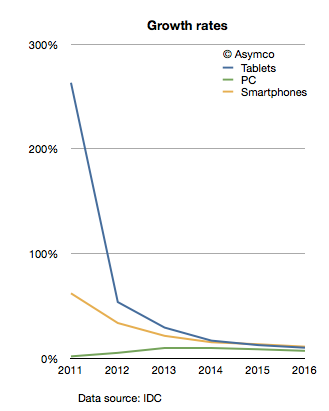
The company provides a stacked bar chart (follow link above) to illustrate their view of the market. I took the data they included and measured the implied growth rates for the product categories:
IDC is implying that in four years the tablet market will be growing at 10%, the Smartphone market will grow at 11% and the PC category will grow at 11%. In other words, five years from now the PC market is expected to grow faster than the tablet market and just as fast as the smartphone market!
What's more remarkable is that this situation is not going to happen in four years. The slowdown in growth is actually expected much sooner. The growth rates two years from now are expected to be: Tablets 17%, Smartphones 15% and PC 10%. IDC is unequivocal: by 2014 the good times will come to an end to the post-PC challengers. These growth rates would be catastrophic for share prices and the value propositions of the new platforms to developers, partners and consumers.
What's more, these growth rates are striking not only because they predict a collapse in the value of most market challengers but that they also predict a strongly resilient PC market. How can we test this forecast?
I tried to reconcile this doomsday scenario with what is known about the components making up the data. I.e. what "bottom-up" data is IDC using? In the quote above, IDC offers some insight into this market participant data. Based on the category and share data they published it's possible to infer the following:
Bearing in mind that neither iOS nor Android existed five years ago, we can observe they are bigger together than the PC market. And yet, IDC predicts a compounded average yearly growth rate of 16.7% in Android, 19.4% in iOS and 7.5% in Windows between today and 2016.
In aggregate, IDC forecasts that in the next five years Android will not manage to double and that iOS will only increase by a factor of 2.4. Is this believable?
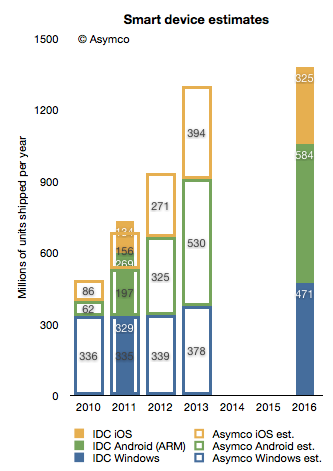
I try to stay away from long term forecasts, but I do maintain a short term forecast based on recent growth data. My forecasts for this year and next year are shown below.
I super-imposed my short-term forecast (outline bars) on IDC's long term forecast (solid bars) and a several differences become apparent.
First, my 2013 forecast is nearly the same as IDC's 2016 forecast. To see why we need to look at each platform separately.
Perhaps we might (with difficulty) agree on Microsoft's potential. I believe Windows 8 will have a catalyzing effect and that Microsoft will begin to see its platform grow again. However, my expectations are modest. To increase Windows sales rate by 100 million units/yr between 2013 and 2016 is possible but ambitious.
The real problem is that our Android and iOS forecasts are outside any zone of possible agreement. Maybe there is a difference in what we measure. For a hint, we seem to disagree on the number of Android devices shipped in 2011. I used Google's own reports of activations to work out the yearly shipment estimates. Perhaps IDC is including versions of Android that are not Google sanctioned.
We also disagree on the 2011 iOS figures. I obtained 156 from Apple's own reports. Again, perhaps the difference is the inclusion of the iPod in my case.
Nevertheless, the difference in the long term cannot be accounted for only through these categorization differences. I would put the cause of the difference down to the methods used in forecasting. As can be seen from the first chart above, IDC's growth rate reductions are extraordinarily steep. Perhaps the approach used by IDC was to forecast the overall market growth and then assignment of shares to participants. This can be called the "top-down" approach. In contrast, my approach is to forecast growth rates based on recent growth rates and moderating these rates gradually. This can be called the "bottom-up" approach.
My experience and all the data I've ever collected about historic disruptions tell me that the entrants tend to win these types of paradigm shifts. They win through a vast expansion of consumption and the recruitment of non-consumers. Markets tend to experience vast shifts in composition. If we believe this to be true then the bottom-up approach focused on entrants is likely to be more effective vis-a-vis the top-down approach of projecting steady state markets and the implicit assumption of incumbent share preservation.
Apple's share price has increased rapidly in the last few weeks. The rise to $600 was swift and broke the pattern of slow growth the the stock was able to obtain over the past few years. The level, however, shouldn't have been a complete surprise.
I think Apple is going to $600...It's really not that complicated. Apple has a number of key drivers in its business model which have yet to be properly priced into the stock because I think it's very cheap at this level.
-Stephen Coleman, chief investment officer at Daedalus Capital
This prediction was made October 26, 2007. On that date Apple's share price closed at $184.7. It may have seemed like a bold bet, but as Coleman noted, the reason why it would reach $600 was easy to spot.
The real story on how I get to that valuation doesn't even involve the sale of (the Leopard operating system) or the growth in the Mac business. How I get there is through the iPhone itself.
What was not easy to tell was when it would reach $600. Back in October 2007 the stock had a P/E ratio of 48. It's PEG(trailing) was 0.65, and cash per share was $17. Sales were $6.6 billion for the quarter and earnings were 98c/share. If an analyst were to take those ratios and apply a forecast of sales five years hence, the $600 price would have been reached much sooner: Sales had tripled by 2010 and earnings had tripled by 2009. In contrast, the stock took until 2012 to triple.
The delay of one or two years is perhaps reflecting the risk involved in investing. Namely, you can predict outcomes but not their timing.
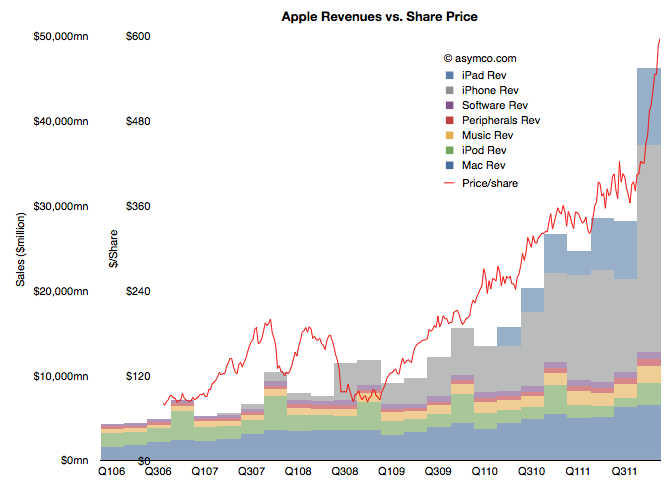
But still, we have to return to the question of why the stock has rallied in the past few weeks. There has been no new information about the company since it reported earnings and any product launches (e.g. new iPad) or increased distribution (China) are completely predictable. Curiously, the market did not react until late in the quarter. The following chart shows the phenomenon.
(Note the two scales on the left: inner is share price, outer is net sales)
It shows the share price as a line superimposed on the sales chart with stacked product revenues. The recent rise can be attributed to the rise in revenues/earnings from the fourth quarter. But why would a stock react in March to data from six months earlier (and published two months earlier).
Classical market theory suggests that markets anticipate and "discount" the future. Efficient markets supposedly react to all available information and do so instantly. If that was the case, the chart above would show the red line shifted significantly to the left.
What we are observing is market inefficiency.
Inefficiency implies that perception of reality is not the same as reality. It happens when people are reluctant to believe the truth. It's also implies that with $15 billion being "bet" on the share price every day, each one of those bets is misinformed!
The cause of this divergence between reality and perception is that disruptions are divergent from perceptions. A disruptive company always "leads" its valuation. There is cognitive delay for the vast bulk of observers. You can then argue that for those, like Mr. Coleman, that don't suffer this delay, there will be profit.
With the launch of the Wii console, Nintendo averted disaster. When the Wii launched in late 2006 Nintendo had been facing the simultaneous attack from the "seventh generation" Xbox 360 which launched a year earlier as well as the PlayStation 3, both of which set as their bases of competition 3D graphics at HD resolutions. Many wrote off the company and called the console market a two horse race.
Then, in what seemed a desperate downward leap, the Wii was launched into a different trajectory. It addressed non-consumers with a new, more intuitive controller and standard resolution rather than competing for hardcore gamers with more power and richer graphics.
Because the Wii was asymmetric and addressed non-consumption rather than trying to be a "better" console in what was becoming a horsepower race, Nintendo expanded the console market. Its innovation was interesting enough that many hard core gamers used the console in addition to a PS3 or Xbox and many non-gamers bought it as their first console.
The result is that 95 million Wii's have been sold vs. 66 million Xbox 360's and 62 million PS3's.
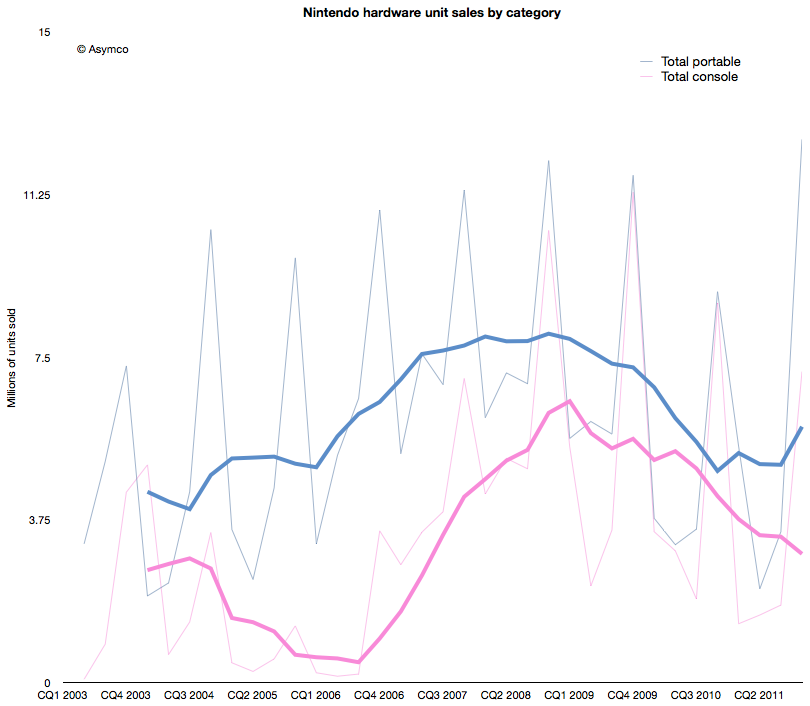
The effect of the Wii introduction on Nintendo's console unit sales is shown below (pink line).
The graph above shows that the growth from Wii has stopped. In fact, the console has been in decline since early 2009. Fortunately for Nintendo, the company also developed a mobile strategy. Learning from its Game Boy device, its DS series of portable game consoles allowed the company to diversify its portfolio. The graph also shows the total portable units sold in blue.
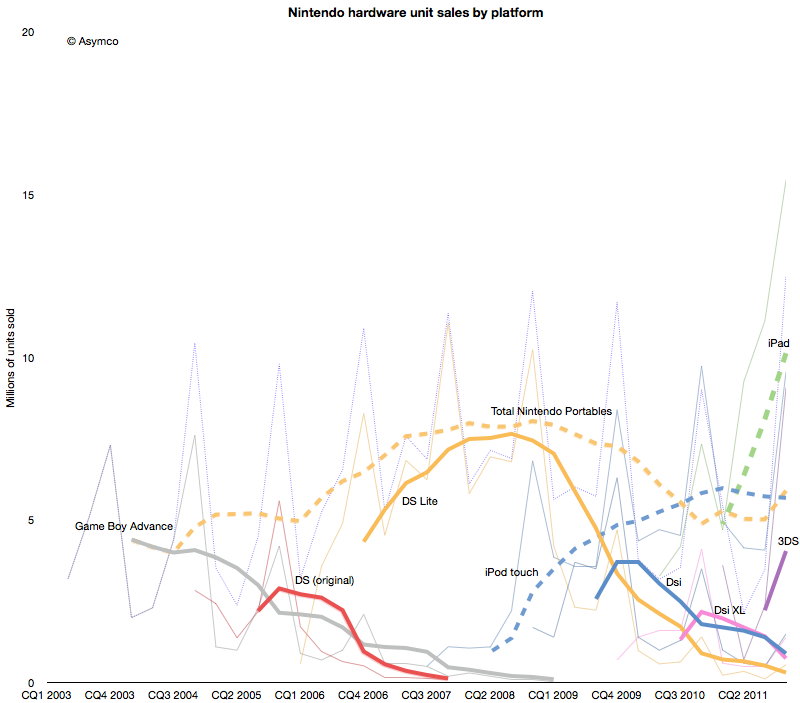
However, this strategy has not been enough to protect the company from the disruptive effect of mobile computing. As the following chart shows, each new generation of portable from Nintendo has failed to break out of a general pattern of overall decline.
Contrast the DS product patterns with the iPod touch and iPad--multi-purpose products whose game functionality is "good enough" but whose communications and general-purpose app catalogs are re-defining the basis of competition yet again.
Nintendo bet on the 3DS to reboot the franchise. The 3DS product does show the characteristic initial spike in adoption but the level it launched at is far lower than the level of the iPad. Nintendo has a big hill to climb to even recover the volumes it held in 2009. In contrast, the usurper Apple's volumes are doubling each year.
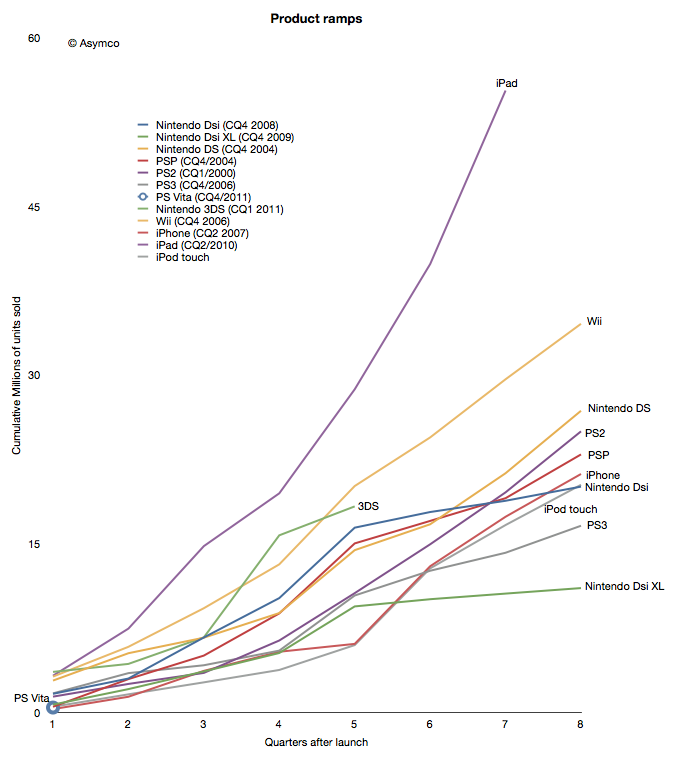
When products are compared as "ramps" in terms of growth post-launch the story becomes even clearer.
Although the iPhone and iPod touch ramped in similar ways[1] to the gaming platforms, iPad took an entirely different path. The 3DS benefited temporarily from a price cut but it seems to be returning to a well-worn trajectory.
The data points a bleak picture for Nintendo. The Wii was a success due to its competitiveness vs. non-consumption of gaming. But another low end disruption took hold in 2007. Good enough games on phones and mobile computers are taking consumption away from dedicated consoles, both fixed and mobile.
In addition, the rate at which game experiences are improving on iOS imply that they will overtake the "quality" of consoles in the not too distant future. Differences in distribution models also guarantee lower pricing for software for end users and enabling a far larger catalog of titles.[2]
This may sound like another story of fortune gained and fortune lost. The inevitable "what goes up must come down" aphorism. We become used to this pattern and assume it to be axiomatic. But there are causes for each success and causes for each failure.
The lesson here is that a company that disrupts does not necessarily survive. Long term survival depends on the ability for serial disruption. Serial disruption is an uncomfortable state for an organization to exist in. As the story above shows, disruptions are usually enabled by "desperate" necessity. Desperation is not something management is trained to aspire for.
What management strives for is steady state satisfaction and predictability from intelligent planning.
---
Notes:
Though the iPhone ramp matched the consoles, the growth for the iPhone is persisting at 100% y/y five years into the product. This means it is outstripping all console installed bases by at least a factor of 2.
The catalog is not only broad but deep in the sense that there are many new game concepts and experiments being tried. The app store is a vast testbed for game and entertainment ideas.
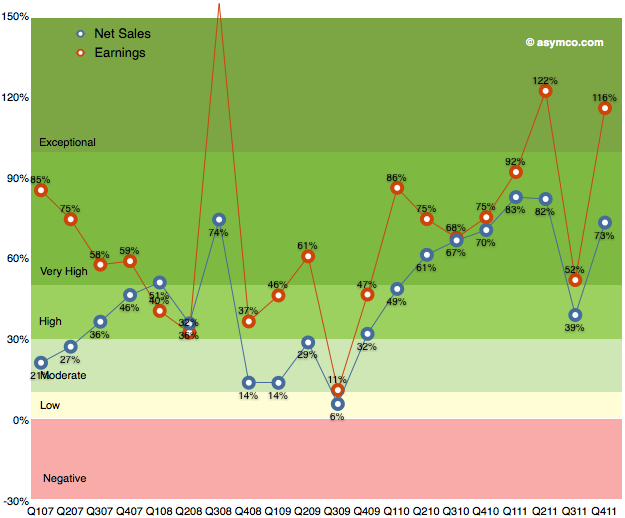
As the chart below shows, the last quarter (fourth calendar 2011, first fiscal 2012) was robust with 116% earnings growth and 73% net sales growth. I've heard many superlatives used to describe it. It is certainly exceptional but it was not as good as the second calendar quarter of 2011.
Sales grew faster both in CQ1 and CQ2 of 2011 and earnings grew faster in CQ2. It was in many ways a return to normality due to the iPhone returning to 133% revenue growth after the lull of the transitional third quarter.
Now it's time to consider the current quarter. It's already quite late in the quarter to make predictions, but I waited to hear some data about the iPad. The iPad remains a difficult product to forecast. Mainly because it is a new category and the pattern of growth takes a long time to establish. We've only had three quarters where y/y growth could be measured. Sales growth has been 180%, 146% and 99%. Unit growth has been 183%, 166% and 110%.
These rates have been higher than the average iPhone growth rates (average of which was 100% in units and 108% in revenues over the calendar 2011). Indeed, the average iPad growth rate so far seems to be 150%.
Is it sustainable?
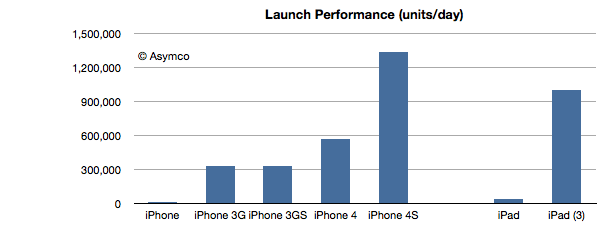
The answer from this latest launch seems to be yes. The following chart shows the launch performance of the various iOS devices whose launch performance has been announced.
The growth in launch performance between iPad 1 and iPad 3 is a factor of 28. iPad third generation had broader distribution but the volume boost from first generation is enormous. This implies a vastly improved production ramp. As the product remains supply constrained, the most important indicator of performance is production throughput.
So given this data on the iPad and the ongoing broadening of the iPhone distribution network, here are my first quarter estimates (with y/y growth in parentheses):
iPhone units: 37.3 million (100%)
Macs: 4.7 million (25%)
iPads: 12.2 million (160%)
iPods: 7 million (-22%)
Music (incl. app) rev. growth: 40%
Peripherals rev. growth: 25%
Software rev. growth: 10%
Total revenues: $42.7 billion (growth: 73%)
GM: 44.7%
EPS: $12.0 (88%)
This earnings value would imply a trailing twelve months’ EPS of about $40.7. At $600/share the P/E would be 14.7. Cash and equivalents will probably increase to $108 billion.
In the recent event discussing Apple's cash plans, Tim Cook stated that the primary objective of the stock repurchase program is to reduce dilution from the ongoing distribution of shares to Apple's employees and executives as part of their future compensation.
The amount allocated to this is $10 billion over a three year period.
This sets up an interesting analysis. The company is saying that they will continue to pay employees with newly issued shares (in addition to wages) but that a portion of those shares will be purchased back from the market to reduce dilution.
To understand the impact, it would make sense to look back and observe how many shares were issued in this way historically and consider how much $10 billion buys.
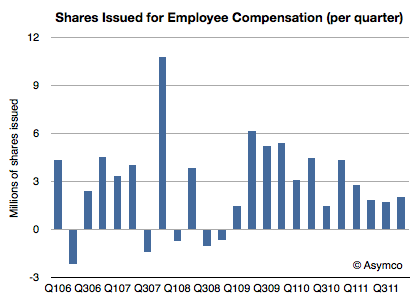
The following chart shows the quarterly change in shares outstanding.
The absolute number of shares outstanding grew from 874.2 million in Q4 2005 to 941.6 million last quarter. That's a net increase of 67 million shares over a six year period. The rate of growth has been accelerating. Over the last three years 40 million shares were issued.
These issuances have an effect for shareholders. They "dilute" the total shares outstanding and thus spread the earnings more thinly. You can get an instant feel for this as the EPS figure must be re-computed each quarter with a different denominator. This is a real cost.
Here is how to compute it. Last quarter there were two million shares issued at a "cost" of about $400/share. That means that shareholders lost the equivalent of $800 million (2 million x $400/share average price in Q4) of value.
Now what Apple has just promised is that they would buy back the equivalent of $833 million per quarter ($10 billion/(3 years x 4 quarters/yr)) for the next three years. Note how close this figure is to the one calculated above.
What we can also obtain is a ratio between stock-based compensation and wage-based compensation. Since we can estimate the total Apple employee wages at $3.2 billion per quarter (average R&D and SG&A over the last year), the stock compensation of $800 million amounts to a 25% bonus.
In other words, on average an employee is likely to get compensation of $X in wages and 0.25X in stock grants.
Therefore Apple's $10 billion dollar pledge is not only a commitment to shareholders that the dilution will be eliminated. It's also a signal to employees: for at least three years, Apple will continue to offer shares as compensation and will do so in a ratio of 1:4 of wages.
Today Apple announced both a dividend and a share re-purchase plan which, when combined, will consume 45% of Apple's current US cash reserves.
The dividend will be $2.65/share/quarter and the buyback will cost $10 billion over three years. The dividend will therefore cost about $2.5 billion per quarter (starting next quarter) and the re-purchase will cost about $833 million per quarter (starting next fiscal year).
However, note that Apple's cash has been growing far more quickly. It increased by $16 billion last quarter or $37 billion over the last year. This rate of increase is itself increasing.
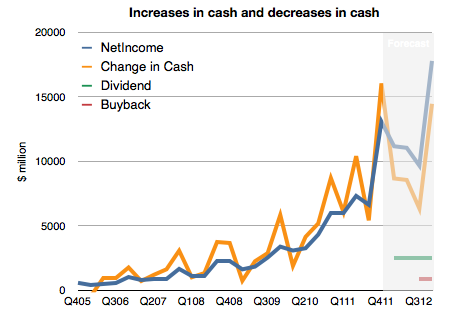
To illustrate, I prepared the following chart. It shows historic net income, change in cash and a forecast of the costs of the new uses of cash and future net income (based on my estimates).
I made an assumption that future cash growth will equal net earnings minus costs for the new dividend and share re-purchase. What we should see is that the previously tight coupling between increase in cash and earnings will remain but that there will be a negative offset by $3.333 billion each quarter. In other words, cash will increase but at a slower rate.
This means Apple's total cash should still grow by more than $35 billion this year.
That would result in the following, more subdued, total cash trajectory (for simplicity, I assumed all added cash would be in cash and cash equivalent accounts)