Asymco

Asymmetric Intelligence

Research

  1. A comparison of P/E compressions

    Research · 15 comments

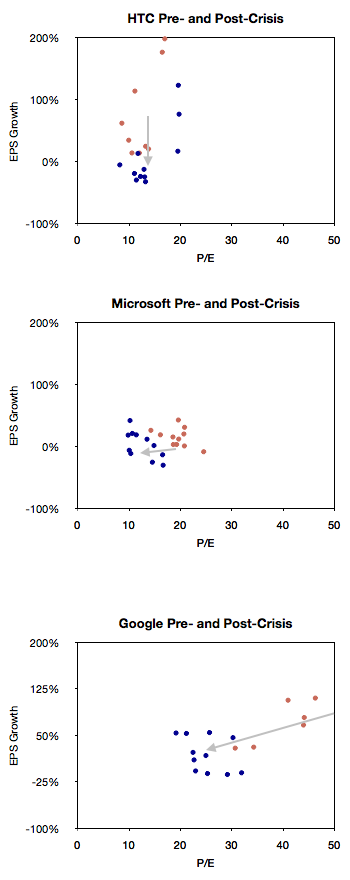
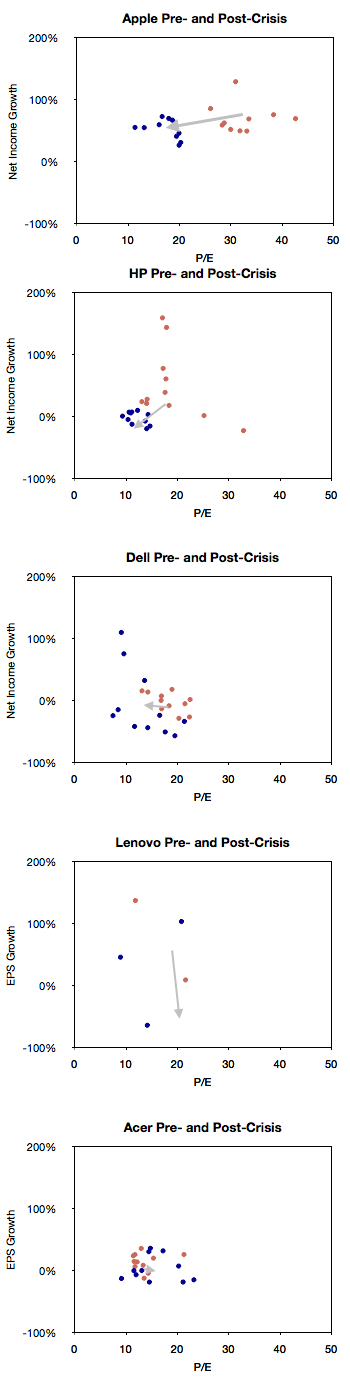
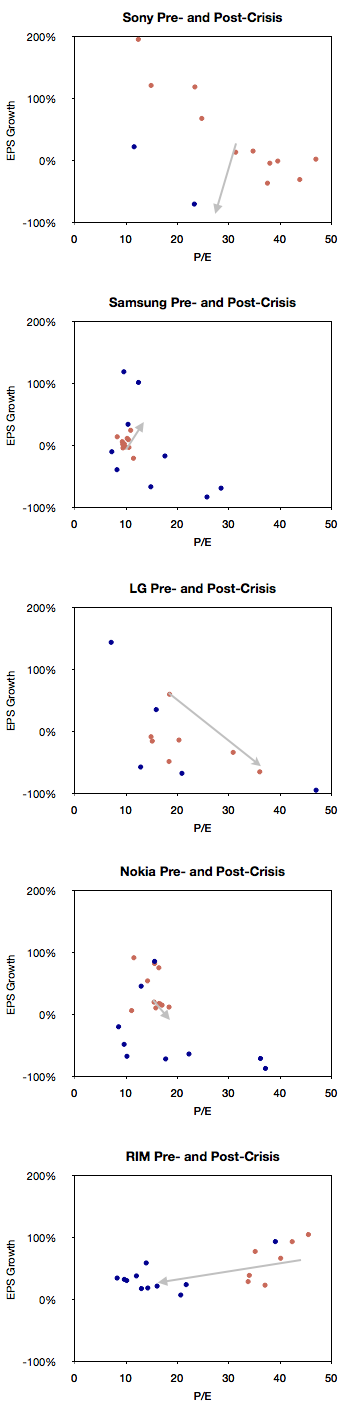
    Following the presentation of growth/PE of comparable companies in the previous post, here are charts showing the Growth vs. P/E as a scatter plot. I highlighted the quarters pre-crisis as red dots and the quarters post-crisis as blue dots. I also added a vector line showing the migration of the average (centroid) of the pre-crisis values to post-crisis values (11 points averaged in each case).

    Note the relatively strong separation of data (pre- and post-crisis) for the following companies: Apple, HP, RIM, HTC, Microsoft and Google. Of these the sharpest separation was that of Apple.

  2. Growth profiles of 13 companies

    Research · 13 comments

    The previous article showing the profile of Apple's growth vs. its P/E prompted a similar review of a set of comparable companies. The cohort is composed of:

    Apple
    HP
    Dell
    Lenovo
    Acer
    Sony
    Samsung
    LG
    Nokia
    RIM
    HTC
    Microsoft
    Google

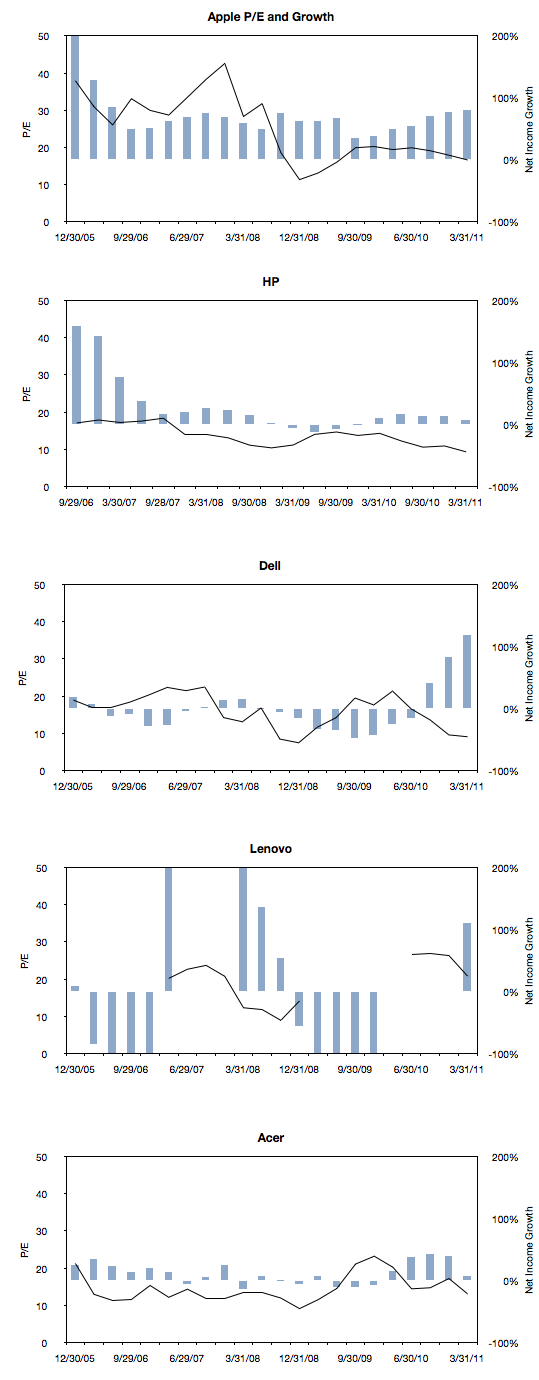
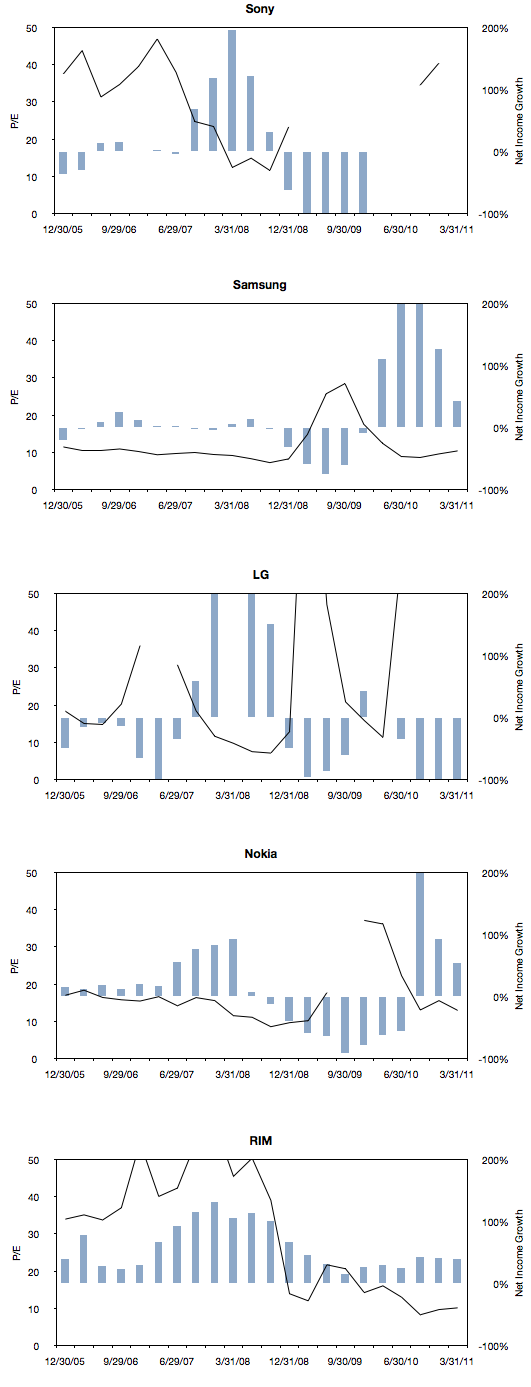
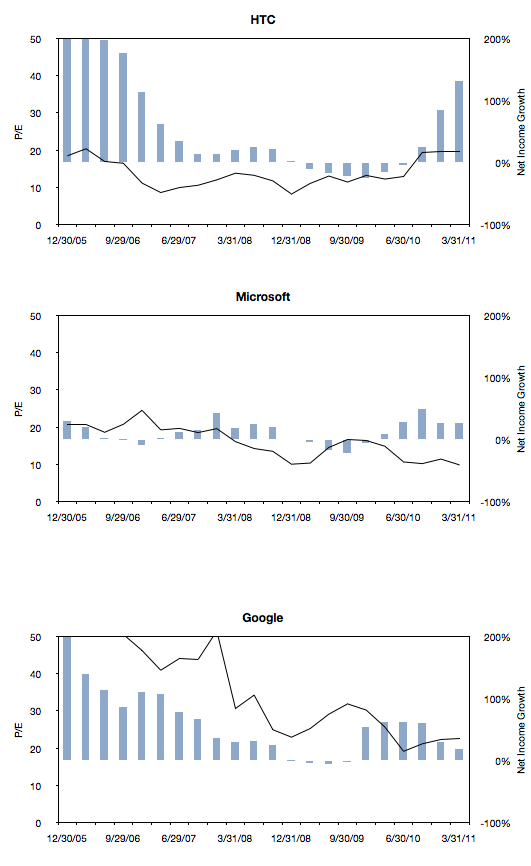
    The following charts are a simple representation of P/E (line chart with left scale) with Net Income growth super-imposed (bar chart with right scale.) The time period is 22 quarters; 11 quarters after the crisis (i.e. quarters after the one ending in Sept. 2008) and 11 quarters before the crisis (quarter ending 12/20/05 through the one ending 6/30/08).

    We made one change to the growth data from the previous post where the Net Income growth is not quarterly year-on-year but average of four quarters year-on-year. This reflects the fact that P/E is also a trailing twelve months' earnings. It also has the benefit of smoothing the growth data making it easier to discern.

    Here are the charts:

    Note that all charts are to the same scale (P/E from zero to 50 and Net Income growth from -100% to 200%). Some clipping of the values is possible. Growth from unprofitable periods are undefined (i.e. when measuring growth from a to b, if a is negative, the data is omitted.)  Growth from a positive period to a negative period is defined as -100% (i.e. when measuring growth from a to b, if b is negative, the value is defined as -1).

    There are some anomalies, for example growth due to an acquisition or loss of profitability due to re-organizations, however the patterns are probably what matter most.

    Next post will discuss the relationship between P/E and growth in the pre- and post-crisis time windows for all these companies.

  3. Apple's P/E compression illustrated

    Research · 105 comments

    The reason we look at valuation is that it offers insight into how innovation is perceived. If a company is a successful innovator it usually creates vast wealth for its owners. However, the timing of that wealth creation depends greatly on its recognition by others. In other words, valuation lets you determine how recognizable innovation is. If your analysis tells you that a company is supremely innovative but nobody else recognizes this then you have an investable opportunity.

    So with that in mind we like to compare industry and innovation analysis with what "the market" thinks about Apple.

    The latest method we had in mind was to compare P/E (a measure of valuation) and Growth. We've shown before that they seem to be moving in different directions. That's not been news for over a year. What we will try to do now is to see if there is discernible change in the relationship before and after the financial crisis.

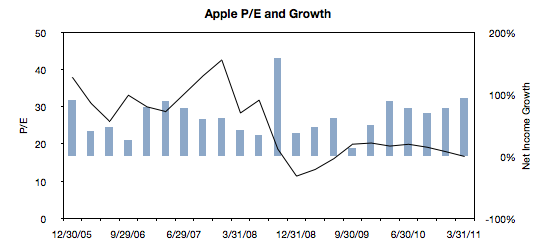
    The following chart is a simple representation of P/E (line chart with left scale) with Net Income growth super-imposed (bar chart with right scale.) We chose a time period of 22 quarters. 11 quarters after the crisis (i.e. quarters after the one ending in Sept. 2008) and 11 quarters before the crisis (quarter ending 12/20/05 through the one ending 6/30/08).

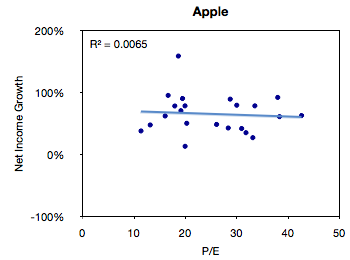
    We then plotted a scatter of all these pairs (P/E vs. Net Income Growth).


    The R-squared value simply shows that there is no correlation between these two variables, but this is not a surprise.

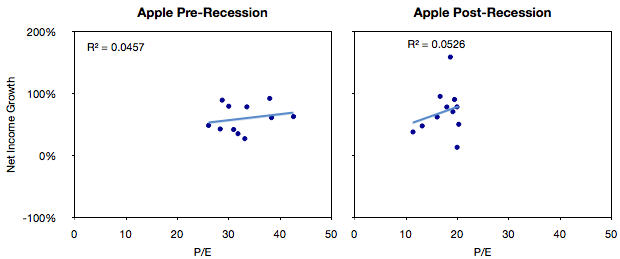
    The next step would be to compare the pre-and post-crisis data sets. The idea being to see if, and to what degree, there was influence from conditions beyond the control of the company.


    What seems to be happening is that the cluster of values did indeed move from the right (high P/E) to the left (low P/E) without much change in the growth.

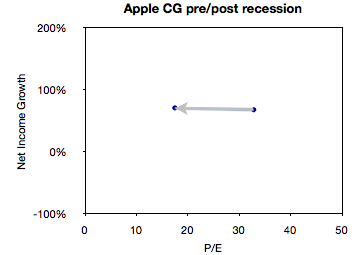
    We can get an even better feel for this by measuring the "center of gravity" of the clusters and plotting how they shifted.

    This chart illustrates succinctly the phenomenon of "P/E compression" where P/E drops while growth continues.

    In the case of Apple, average growth actually increased slightly between the two sampling periods (from 68% to 71%) while the average P/E dropped from 32.8 to 17.5.

    What will follow over the next few weeks will be pair-wise comparisons of Apple and comparable companies along these metrics of P/E and Growth.

  4. Why Apple's shares rose after Steve Jobs resigned

    Research · 35 comments

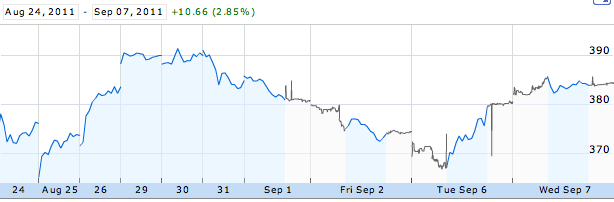
    CEO resignations often cause share prices to rise. Witness the effect of the latest CEO departure on Yahoo!. This typically happens because CEO replacements are not necessary when companies are successful. In times of crisis, the market sees management change as a hopeful sign. But Apple is doing well. So it was commonly believed that if Steve Jobs were to leave the helm at Apple the stock would fall. However, as the chart below shows, the stock price has since risen.

    Apple's share price rise of 3% even out-performed the Dow Jones index, and this phenomenon is not for the short term only. The Jobs resignation sent Apple puts to one-year lows.

    So how do we reconcile this? How can such a valuable person be priced as a liability?

    First, I should mention that not everyone shared the opinion that the departure of Steve Jobs would cause a decline in the price. Over a year ago, in August 2010 Horace wrote in a comment:

    Since I've shown repeatedly that Apple is trading at a discount to its growth and to its historic value and to its peer group, and since the health of their CEO is an uncertainty which must be discounted, the possibility exists that the depressed value assigned to Apple is due to Steve Jobs's continuing presence in the company. If that is true then his departure should increase the stock price.

    His argument of why the departure of Steve Jobs would cause an increase in the stock price was based on the fact that the market would have discounted it and the only question would be when it would happen. Since that uncertainty of when was unresolved, it would weigh on the shares until the uncertainty would be lifted and the price would resume its value based on other factors.

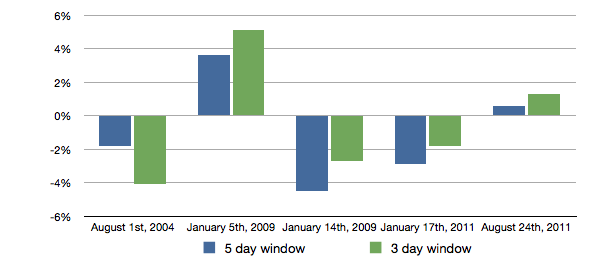
    To demonstrate that effect, we can turn to data. The discounting was visible in the reactions of the stock in previous events when the tenure of the CEO came into question. Those reactions are shown in the following chart:

    Each of the bars above shows the cumulative abnormal returns after all the events when tenure issues cropped up in the news.

    If we excluded the first time we learned about Steve Jobs’ health issues, we can see that the stock market likes certainty (January 5th, 2009: health issue but remains CEO; August 24th, 2011: definite resignation as CEO) and rejects uncertainty manifested in medical leave announcements on January 14th, 2009 and on January 17th, 2011 leaving the top organization in a temporary form. We can also see that Apple investors are becoming more comfortable with Tim Cook running the company as the negative cumulative abnormal returns diminish and turn into positives ones when he is appointed CEO.

    We can conclude that Steve Jobs’ resignation as CEO, as sad as it may be, has reduced unsystematic risk from the stock and therefore “boosted” the share price performance.


  5. Why Carol Bartz was fired

    Research · 34 comments

    Occasionally I write articles titled "Why CEO X was fired." You can read one here, and here and here.

    These are allegorical stories. I don't base the opinion on evidence but on perception of what's wrong with a particular company's strategy and then try to trace the point of strategic failure which should have triggered management change. Of course, the reasons are often something else, probably mundane or "political" in nature.

    The objective therefore is to analyze strategy and more precisely strategy failure.

    So, Yahoo! What went wrong?

    Before we answer that, we should know what went right. Yahoo, like Google, depends on advertiser revenues. For that, it sells the behavior of its users. It processes over 25 billion events every day and builds a database (estimated to be in 10s of petabytes) to mine for information that is, hopefully, worth something to advertisers.

    But in order to get user behavior it needs to provide compelling reasons for user participation. For that, Yahoo licenses content and offers communication services (among other things.)

    This sounds like a reasonable business model. So what could go wrong? As always, we begin by measuring performance along a prevailing basis or axis of competition. Has Yahoo's product been improving in ways meaningful to its customers? Is that improvement beyond what buyers value or can absorb? To answer, we need to be careful in recognizing that the customer is the advertiser, not the user. Like in all advertising business models, the user is the product.

    So when seen in this context, the problem becomes clearer. We have to determine whether the product (user behavior) is good enough or too good. We have to compare it to alternatives which might offer better price/performance for a given customer need.

    There is little data we can draw upon, but my initial hypothesis is that the behavioral product that Yahoo has been delivering is over-serving while search and social data is what customers are increasingly looking for.

    Part of the reason is that Yahoo's raw material is licensed content. The value of that material has decreased as users turn to either social media or seek out filtered, niche information sources which are outside the generic feeds Yahoo provides. Therefore, as Yahoo's traditional raw material has commoditized, so has its user behavior data. The patterns that are emerging from the data are "unactionable" by advertisers. There is little insight that can be gained from data on patterns of reading generic news. People are differentiated through their reading of niche sites and that data does not reside with Yahoo!

    Thus customers (advertisers) have felt that the product (user behavior from reading licensed content) is commoditized. There is much more value in looking at patterns in Facebook or search. But those rich fields of data are under the control of competitors.

    This is the core problem with Yahoo's business and it's been a problem for a long time. The question for a CEO should be how to fix this. The remedy is not better administration but either a change in the core business or innovation in terms of content sourcing (away from big media and toward blogs and niche media.)

    Sadly, the steps required to get there should have been taken years ago. And perhaps the required changes imply so much displacement and disruption in the operating and financial structure of the company that it would just not survive the operation.

    Which is why Bartz was fired. There is no evidence that she tried to engage in surgery or that there was any therapy process under way during her tenure. The patient, I'm afraid, is still dying.
  6. The proliferation of mobile platforms

    Research · 92 comments

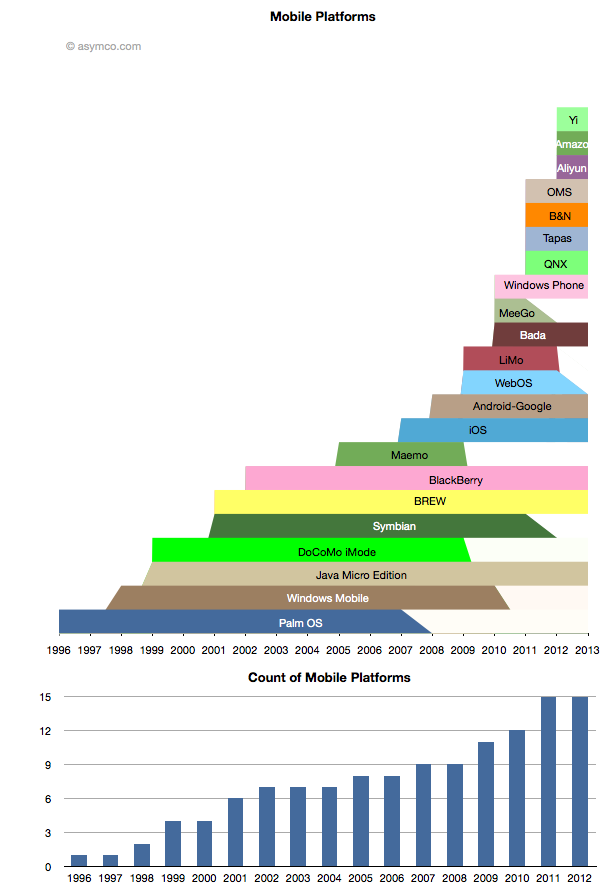
    While some mobile platforms are being withdrawn from the market, others are being introduced. The net is that there are more mobile platforms announced for 2012 than ever before. The following chart shows the lifespan of the platforms that I can recall.[1]

    Amazon's entry is only rumored but I think the description of it is detailed enough to be credible. The day after the scoop with Amazon, Baidu announced the Yi platform. Baidu is the sixth most visited site in the world, so it's not a bit player and it makes as much sense for Baidu to have a mobile platform as it does for Google.

    Aliyun is Alibaba's latest and it, like Amazon's, is positioned on commerce and shopping. I also included the platform underlying Barnes & Noble's Nook for consistency.

    Many of the newcomers are Android-like or Android-derived platforms but cannot be rightly called Android as they are not licensing the Android trademark nor any of the proprietary part of Android. They may run some subset of Android apps but that is not guaranteed to continue.

    It's also worth noting that many of the newer Android-derived platforms are being launched by Google's competitors and indeed seem to be designed to take value away from Google.

    The epic struggle Android vs. Google is sure to continue.

    ---

    Notes:

    1. The lifespan is bounded by the dates of public announcements of start and end of development efforts by the platform owner. It does not include times when products are still in the market or the platform is still supported.
  7. Quantifying the phobia of owning Apple shares

    Research · 46 comments

    As the market continues to exhibit signs of instability, an interesting paper[1] identified a correlation between the U.S. stock market and an index of the U.S. Financial Conditions. This index measures the assessment of the probability of a crisis.

    The conclusion is that an imminent crisis mentality pervades equities markets today and implies that pricing is largely disconnected from fundamentals. On this blog we've discussed the topic of fundamentals and marveled at how pricing seems to be largely exclusive of it.

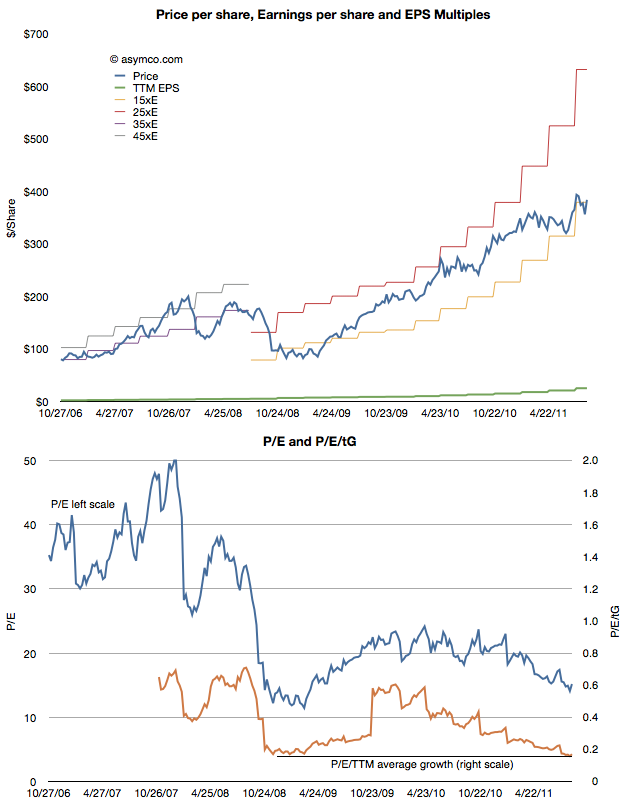
    The case is made by the following chart:


    The first chart shows the share price (blue) and the earnings per share (EPS in green) as well as several multiples of EPS. During the period of 2006 through 2008 the stock ranged between a P/E of 35 and 45. beginning with the collapse in confidence due to the banking crisis, the share price fell to within a range of 15 and 25. Now, with Apple's growth accelerating above 100%, the stock price seems to be sliding below the 15 P/E bottom.

    In the second chart I show the P/E in blue and the P/E/trailing Growth. Adjusted for earnings growth the equity is cheaper now than at the bottom of the last recession. You can also observe the trend or slope of the decline in the P/E/tG. It might be alarming to see the decline but it also might be comforting to know that the P/E/tG cannot go to zero. Either Price has to go to zero or earnings or growth have to go to infinity. The closer P/E/tG goes to zero however (it's at 0.17) the more undervalued Apple appears to be.

    Naturally these metrics of P/E are arbitrary and the price is simply what the buyers are willing to pay for the equity. But the value of any metric is the trend. The value can be compared to a different time or to a different equity. The trend here is that Apple, at least, is being discounted at a time when it's growing more robustly than ever.

    Which is why finding an explanation is so important. This is where the paper sheds some potential clues. The author concludes that there is a pervasive crisis phobia which affects multiples. Paulsen writes:

    If cultural mentalities were less crisis-phobic today, what would the PE multiple be on the stock market coming off a 12.8 percent profit quarter with a 2.2 percent Treasury yield and only about a 1.6 percent core consumer price inflation rate? Certainly, much higher than 12 times earnings! 16 times earnings? 17 times? This simply illustrates just how much the crisis-centric mindset is depressing investment potential and it also suggest how much opportunity there is to increase stock valuations just by improving the cultural mindset. Long term, the real investment opportunity is not a dramatic improvement in economic or profit growth (although either or both could occur), but rather is just a slow but steady decay in “crisis-fears” similar to what we experienced during the last recovery.

    ----

    Reference:

    1. A Crisis Phobic Investment Culture, James W. Paulsen, Ph.D. Wells Capital Management.
  8. The third ecosystem. What are the odds?

    Research · 146 comments

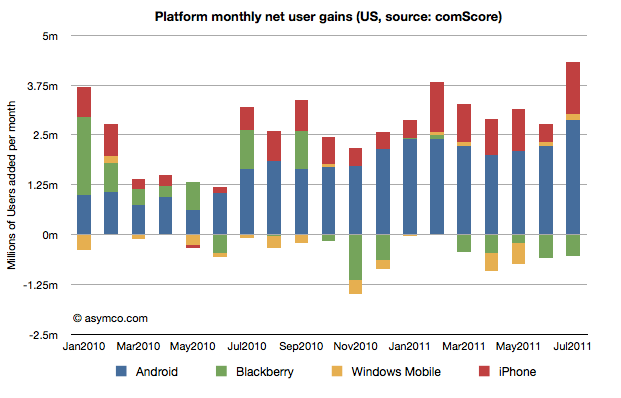
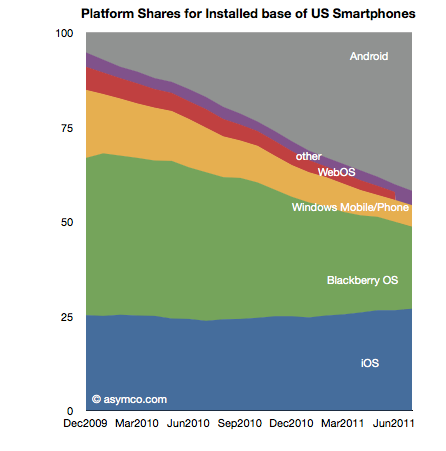
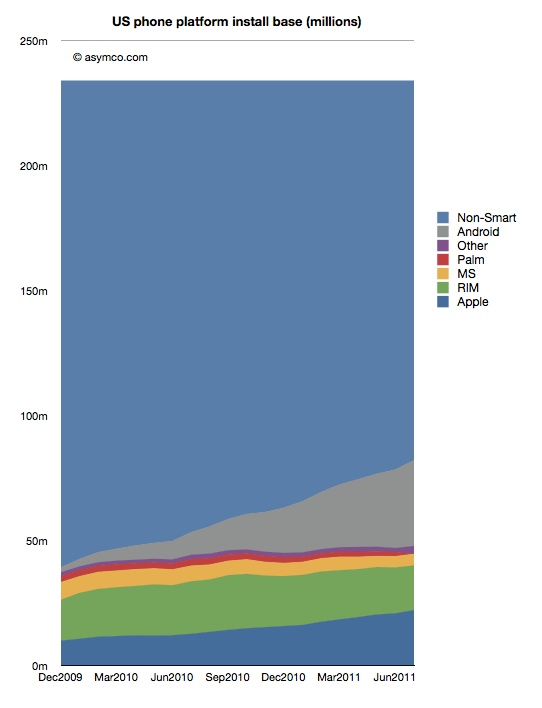
    The latest survey from ComScore breaks down the installed base of specific mobile platforms in the US. Tracing the data over time shows the following charts:

    In the last month Android gained about 2.9 million users, iPhone 1.3 million, Blackberry lost 530k users and Windows held on with a gain of 132k. Other platforms had a net loss of 95k users.

    In the last 12 months, Android gained 25 million users in the US. iPhone gained 9.5 million while Blackberry lost 3.2 million and Microsoft lost 1.6 million. Other platforms had a net loss of 1.2 million.

    The total net gain of smartphones was about 29 million new users.

    RIM switched from being a consistent net gainer of users to a consistent net loser of users in October 2010. Windows Phone is showing signs of holding the line on user base erosion but share remains below 5% (now at 4.7% vs. 4.6% last month). To put the mountain-sized hurdle in perspective, Android now has 7 times more users in the US while iPhone has about 5 times more. To become the largest mobile platform in the US, as some analysts are predicting, Microsoft has a 12:1 disadvantage that looks to continue to grow.

    Those are some pretty tough odds.

  9. The case for the iPad's future

    Research · 156 comments

    The question of low end disruption should be a concern to any manager. It's one of the most important sources of growth and has led to a vast amount of wealth creation.

    Apple was an early low end disruptor by selling personal computers at a fraction of mini-computer prices. Toyota also offered "cheap" cars as an entrant in the market. Pixar made blockbusters for a lot less than live action studios. Google offers good enough office software without a license. Finally Microsoft built its whole business on low-end business software at knock-down prices.[1]

    All these entrants made fortunes often at the expense of entrenched incumbents. Disruption grows the pie but also transfers a lot of value away from existing competitors.

    So it should not be surprising that new products like the iPad should be scrutinized for their vulnerability to low end disruption. Brian Caufield asks the question if Apple has any future with the iPad given the potential for $99 tablets.

    The question is indeed why not introduce an ultra-cheap tablet, for example from Amazon, which makes up for the low price with an innovative business model like selling content or user behavior data. After all, game consoles are sold this way. This is the classic razor/razor-blade business model.

    The answer to why not is actually not simply that the economics don't work. They might work some day even if they really don't today.

    The answer to why not is that the iPad is not good enough.

    Disruption (low-end or otherwise) happens when a product over-shoots the market. It makes sense to compete on a new basis, be it low price or convenience or customization, if the prevailing basis of competition has led the prevailing products to be more than good enough. If you look through all the examples of low-end disruption, you'll find that the incumbents were motivated to flee up-market and to continue to improve their products even though they exceeded the demands and expectations of mainstream buyers.

    For the iPad to be vulnerable, it has to be way better than the mainstream users' needs. Which asks the question of what needs are being served. If it's book reading, it probably is more than good enough. But if it's replacing a laptop computer, certainly not. Being too feeble is the most common complaint about the iPad. Being a bloated over-functioned and overly complex solution looking for a problem is definitely not on buyer's list of concerns.

    So on this basis, the iPad and other tablets pass vulnerability tests with flying colors. The product is woefully inadequate for mainstream computing.

    The consequence is that people will yearn and beg for more functionality and will drop the last generation for the next without hesitation. This pattern of breathless upgrades is symptomatic of a product racing up a trajectory of improvements which are relevant to buyers.

    So until buyers find the n+1 version of the iPad to be superfluous and over-specced, having too much battery life, too big a screen, too much storage and with more speed and bandwidth than needed, the iPad need not fear the low end.

    ----

    Notes:

    1. Other classic low-end disruptors are: Wal-Mart, GE Capital, Toys 'r Us, Sun Microsystems, Dell, Hyundai, MySQL, Amazon, Visa, Embraer, E-trade, Macy's, Japan Steel, Circuit City, Home Depot, Yahoo Travel.
  10. US smartphone penetration growth rate update

    Research · 19 comments

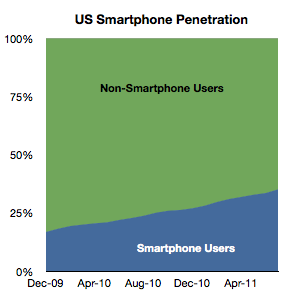
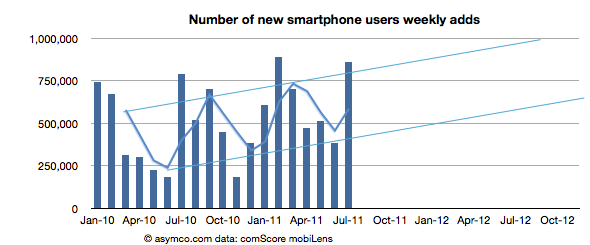
    The survey data from comScore is in and it suggests that smartphone penetration increased by a significant 1.58%. It is now 35.1% with 82.2 million users.

    The weekly new user rate was about 863k/wk during July or about 586k/wk average over the last three months. I plotted the weekly add rates for the last 18 surveys and overlaid the three month moving average.

    The chart shows that there is an upward slope to the upper and lower bounds of the moving average. Extrapolating trend forward gives me confidence in projecting 50% penetration by July 2012.

  11. Samsung's Polyplatform Paradox

    Research · 57 comments

    Samsung has, over the years, shipped phones using almost every operating system it could get a hold of. That includes Symbian, Windows Mobile, Windows Phone, LiMo, Android, PalmOS and OPhone.

    As far as I know, today its portfolio includes Android, Windows Phone and its own Bada OS. The relaxed attitude to platform exclusivity at Samsung is in stark contrast with almost all other competitors who either for the sake of encouraging their own platforms or minimizing development costs maintained either one or two smartphone platforms.

    Samsung justified their polyplatform strategy a few years ago by saying that different platforms are popular in different regions and as they did not want to be excluded from any market, they felt that being agnostic is the best policy.

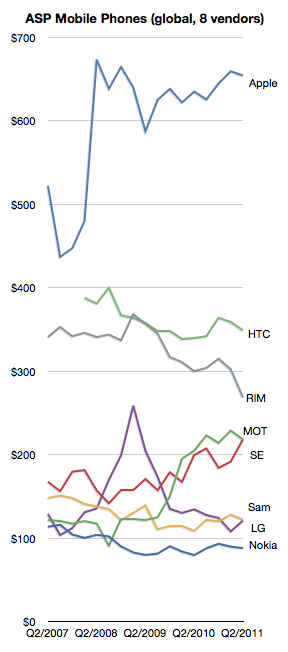
    The idea that platforms are not universal, but the result of provincial preferences is interesting. It's a concession that "politics" plays a large part in mobile markets. However, for all the volume growth the strategy has produced, the strategy has not paid off in terms of higher margins or pricing power as the following chart shows.

     So perhaps polyplatform thinking is coming to an end.

    Exhibit A is Bada itself. The idea that Samsung would build its own OS came as a surprise to anyone following their history. Why did Samsung buy a book when there's a library in town?

    Exhibit B is the repeated statements of Samsung's Chairman saying that the company should invest in software. Software!

    Exhibit C is the statement today that Samsung intends to spend some of its $9.3 billion R&D budget on Software.

    The money is expected to be used to strengthen the company technology prowess in such areas as mobile phones, semiconductors, displays and electronics products. Funds will also be allocated to software development.

    Samsung investing in software development does indicate that perhaps the company does see value in that component and would prefer not to be dependent on suppliers for it.

    In theory, as the market power of inputs (supplier power) increases due to concentration and forward integration it makes sense to backward integrate.

    As a supplier itself, however, Samsung has to ask itself if its component customers are thinking the same thing.