This is a data set that shows Apple's product-level performance according to Units sold, Average Selling Prices, Cost of Sales, Gross Margin, Unit Growth, Revenues, Revenue Growth and Gross Margin contribution. It, along with all the other data sets are available under the Products menu at the top of this page.
There are several methods I turn to when estimating device sales.
Top-Down Demand analysis
The first is to look at so-called top-down views of the demand. This method takes a view of the overall phone market and assumes share for smart devices and, further, shares for individual platforms. There are several estimates out there. The most recent is Ericsson's Traffic and Market Data Report, released November 7 2011.
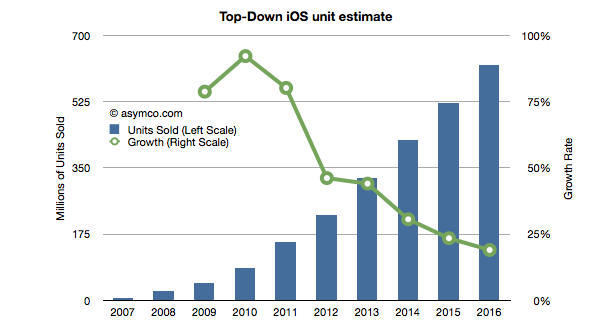
It concludes that in five years' time mobile subscriptions will reach 8.4 billion of which smart devices (incl. tablets) will total 6.2 billion. As iOS has approximately a 250 million install base at end of 2011 and as the total base from Ericsson's estimate for 2011 is 1.44 billion then Apple's share is approximately 17%. If we assume that Apple will be able to increase smart device share to 20% (3 percentage points in five years) then by 2016 Apple will need to have 1.24 billion iOS subscribers.
Assuming that half the installed base upgrades every year and Apple adds devices required to reach the install base necessary (1.24b or 20% share) leads to the following unit sales projection (I've added 2008 through 2010 actuals and 2011 estimates based on my own current Q4 projections).
This Approach yields an estimate of 225 million iOS devices to be sold in 2012. Note that the growth is linear which is not usually the case. Typically this growth is in the form of an S-curve which front-loads the volume in the more recent periods.
Production Estimates
The second approach is to look at supply. I use this method for Apple as I consider their devices to be supply constrained and thus look at historic performance to forecast their production ramps. Put another way, I try to answer the question of how quickly Apple can sustain growth in production given their yearly product cycles. I can also use capital expenditures (which the company releases in advance) to forecast device production as the two have been closely correlated in the past.
Using this method I currently estimate 260 million iOS units for 2012.
Customer behavior estimates
The third approach is to attempt to measure customers' loyalties and competitiveness of vendors. If we know the probability of upgrades and the historic split between "new" and "existing" users then we can roll the forecast forward.
To start, we need a probability of upgrade which can be obtained from surveys which measure "loyalty" by asking the intention of sticking with the brand on the next purchase or a measure "satisfaction". iOS product score in the high 80% to 90% range.
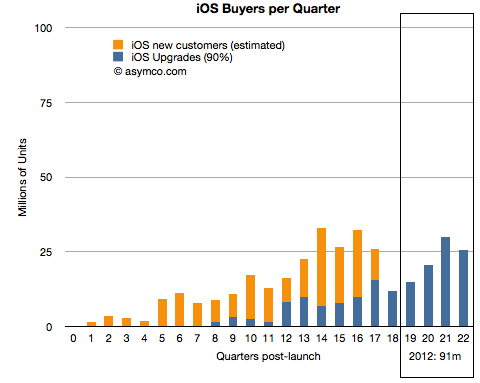
The following chart shows total iOS units sold and the ratio of upgrades (assuming 90% upgrades for 2 year old purchases). It also forecasts upgrades based on current installed base.
If 90% of iOS users upgrade two years after their device purchase then next year will result in 90 million iOS devices sold to existing users.
Given the ratio of new users to upgrades in the past, and if we assume some reduction in that ratio over time, we can obtain a measure of "new users" on top of the upgrades. (In other words we forecast forward the ratio between the dark blue and orange lines above).
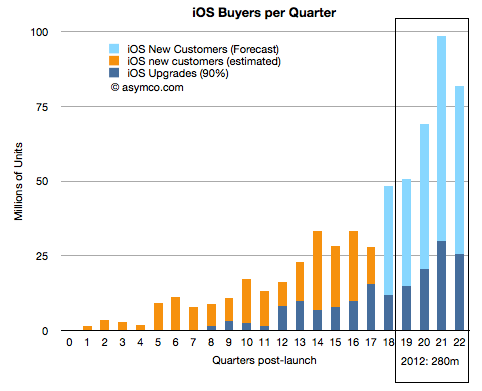
The ratio of new to upgrades has varied significantly from 30x to 0.8x upgrades. I created a schedule where the next quarter will be 2.1x, then 1.44x, 1.36x, 1.28, 1.2x for the quarters of next year. The result is shown below:
This yields a forecast of 280 million iOS devices to be sold in 2012. The forecast is very sensitive to the ratios shown above so obviously this is not going to be very accurate but it's interesting to note that the three methods yield growth rates of 46%, 69% and 82%. All three are far above the growth forecast for Apple (about 25%).
The idea is that rather than just telling stories and interpreting the world from my point of view, I should also ask others to teach from their experience.
In this case I discuss the disruptive potential of cloud computing with Randy Bias. Randy is the CTO of Cloudscaling, a designer of infrastructure cloud systems and a vast knowledge of the challenges and value of what we now call cloud systems. I've consulted for Randy in the past and I thought he could add a lot to the understanding of super-platforms. Super-platforms, you may recall, is a term I used to describe the coupling of Web Services and Devices in a mutually inter-dependent business model. I introduced the concept as a way to think about Siri and iCloud and potentially the Kindle and Amazon in general.
In this show I ask Randy to comment on the thesis that devices and cloud systems as a coupled system are a potential disruption to both the device-only model of computing and the cloud-only model of services. In other words, is the new ecosystem the coupling of devices with backend cloud APIs? We also touch on the scope of Apple's data centers and the way we can calibrate the investment.
I think this is a ripe area of research and thinking about the future of computing. It will require learning a new way of measuring "performance" of solutions and the businesses built around it. It will take a multi-disciplinary approach to ferret out the key value propositions.
Here is a discussion of the changes since the last analysis:
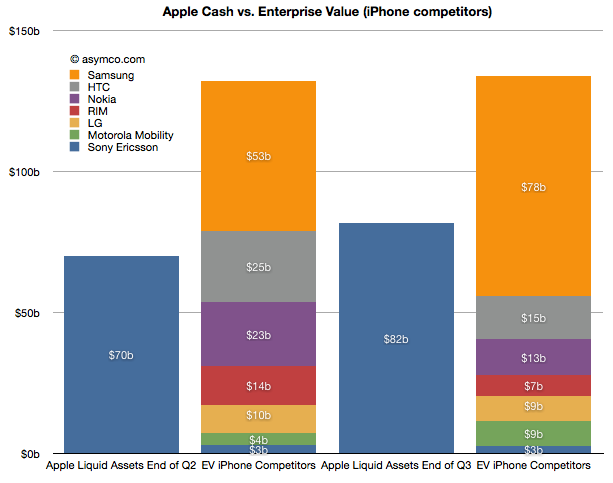
Sony Ericsson was valued through its acquisition by Sony. We did not have a way to value the enterprise before as it was not traded independently. Last June I estimated a 14x multiple on its trailing twelve months' profits and got $3.0 billion. Since then half the company changed hands for about €1.05 thus yielding a total company value of $2.8 billion. The enterprise value should be therefore slightly lower but I'll stick with the current transaction value as the EV.
Motorola Mobility has entered into an agreement to be acquired by Google for $12.5 billion by Google. The company's enterprise value jumped as a result to about $8.6 billion.
RIM's share price collapsed and it's now also trading at an EV of about 7.3 billion (Yahoo finance).
Nokia's price has also dropped and it now has an EV of about $13 billion (Yahoo finance).
HTC recently dropped significantly in price and is now worth about $15 billion EV. (Note that pricing of its equities is subject to suspended trading due to drop limits).
LG's phone business is still losing money and it's still difficult to value. In November it was revealed that the company was seeking to raise $890 million in capital to fund new initiatives including smartphones. The share price fell by 14%. In June I suggested a nominal value for the phone business of $10 billion. I think that's very generous and with recent events I would place that value at $9 billion today.
Samsung's fortunes have increased. In June I applied a 14x multiple to their trailing 12 months' operating earnings. Given overall discounting of the sector I applied a multiple of 13 today. That yields a business value of $78 billion. Interestingly, that is larger than the value of all other competitors apart from Apple. That also makes it six times more valuable than Nokia.
Apple's cash and cash equivalents and investments grew by about $12 billion and were worth about $82 billion as of October.
In summary, in June Apple's cash was about 53% of the sum of competing phone vendor enterprise values. Today it's about 61%. Excluding Samsung, Apple could buy the industry and still have $25 billion left over. This makes the claim that "Apple could buy the industry" even more believable.
This analysis is mainly academic. It does not imply that any such transaction will take place. As the purchase of Motorola shows, control has a premium and individual buyers may be less "rational" than markets. What it does show however is that the entire industry is in a state of crisis. Valuations for phone companies are collapsing and two major brands (Motorola and Sony Ericsson) are being absorbed and could disappear.
At the same time entrants are arriving with completely different business models. Amazon, Facebook, Baidu, Alibaba are intent on selling phones or platforms to be valued as enablers for asymmetric business models rather than as phones. One could argue that what Apple itself sells is more than hardware and that its value-add "on top" of hardware is increasing. This is a sign of commoditization. Certainly the voice business is well beyond that point but it now appears that even the smartphone business is already in an advanced state of value compression.
All the while the overall market is growing. I had separately looked at the profit pool and concluded that the brands are suffering. Summing up the votes from stock markets, the sentiment is even worse. 2012 is looking more and more as a year of inevitable and dramatic industry change.
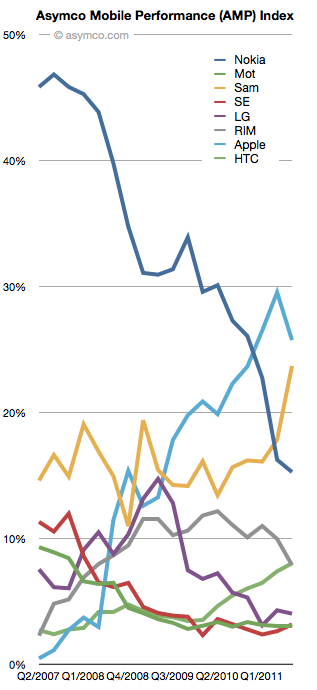
The Asymco Mobile Performance (AMP) index is an unweighted average of:
Share of all handset units sold (global)
Share of smartphones
Share of value (revenues)
Share of profits
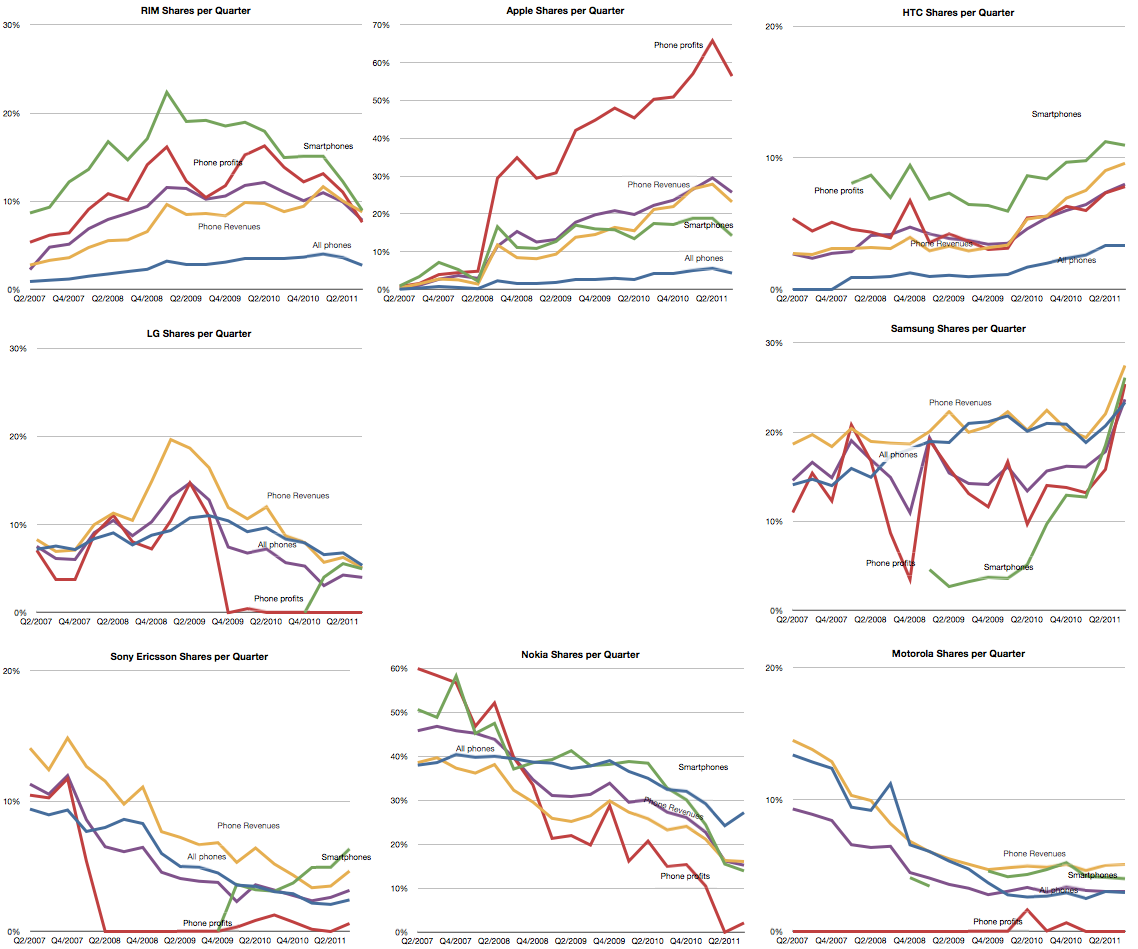
For major phone vendors. The raw data for each share is shown in the following charts (note change of vertical scale: each gridline represents 10%).
Note that the vendors are arranged in a particular way: top row are entrants, bottom row are incumbents with late incumbents from Korea arranged in the middle.
Taking the average of each of the lines above, the unweighted share index (Units, Smartphones, Value and Profit) is shown below:
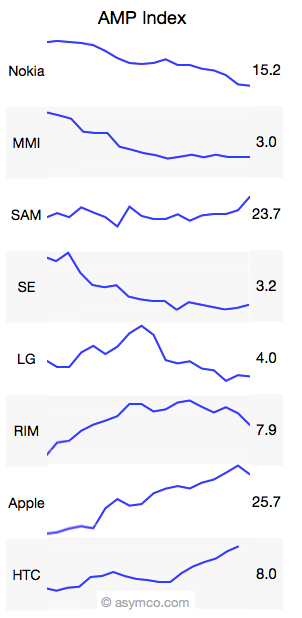
And here it is in sparklines:
Like many indices, this is a generalization that measures a section of reality. The value is in its use as a benchmark and trend analysis.
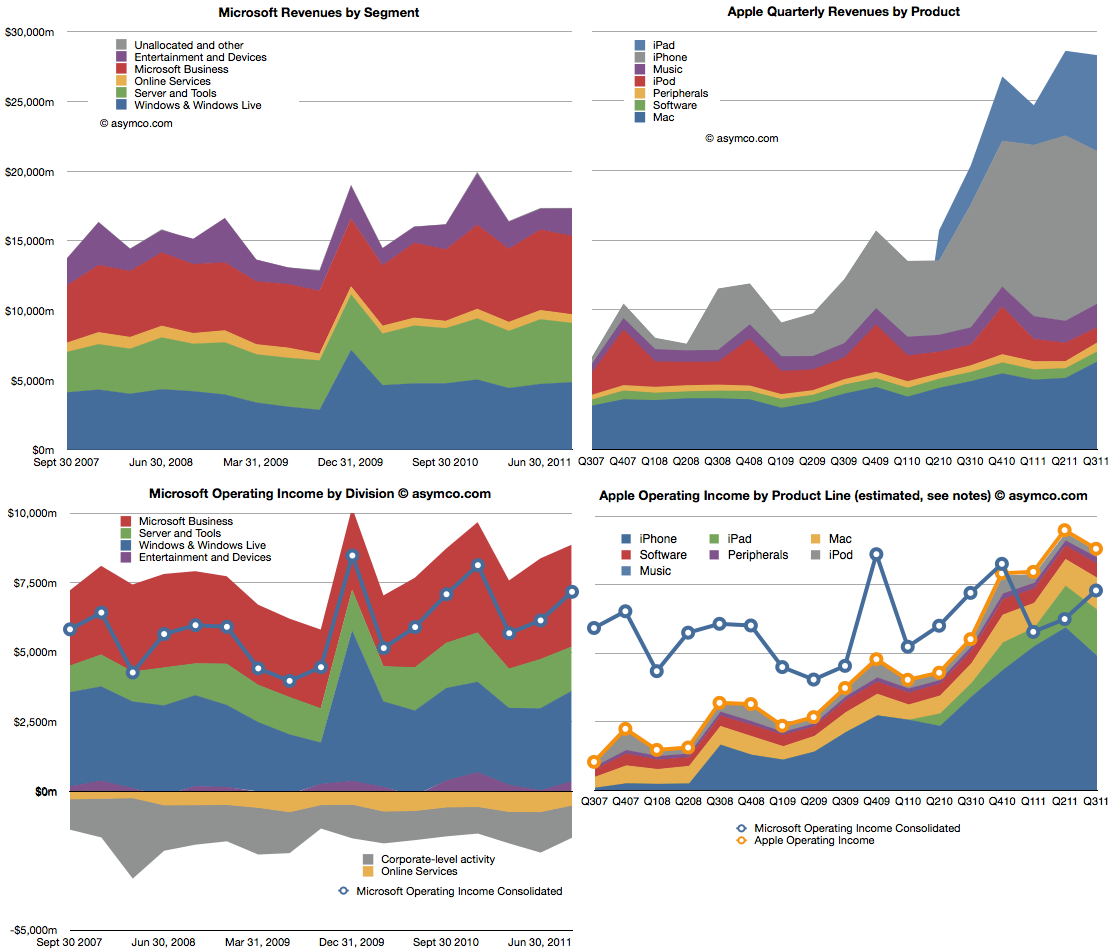
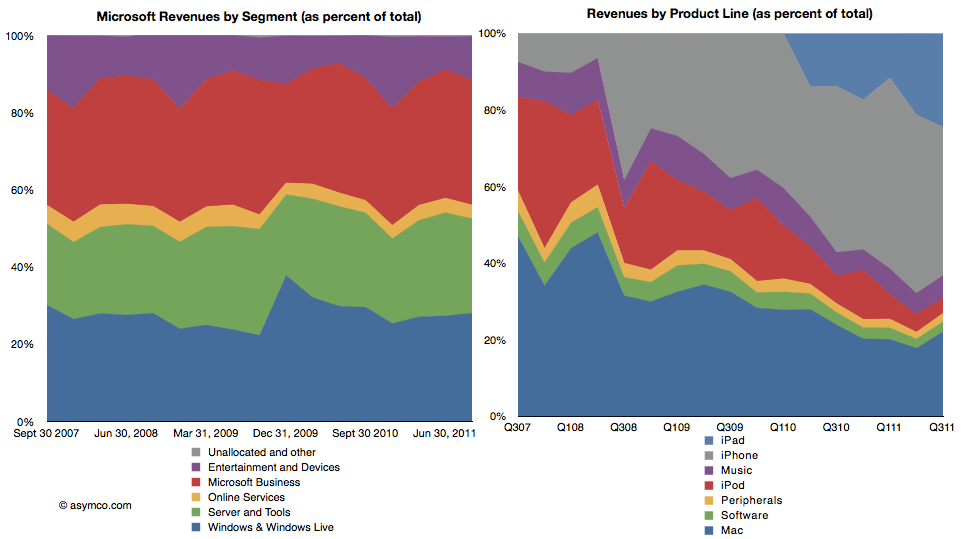
Microsoft is a stable business. Apple isn't. The following charts compare the two. The two charts on top show revenues, subdivided into product lines. Microsoft is on the left and Apple on the right. Note that the vertical scales are the same (zero to $30 billion/quarter).
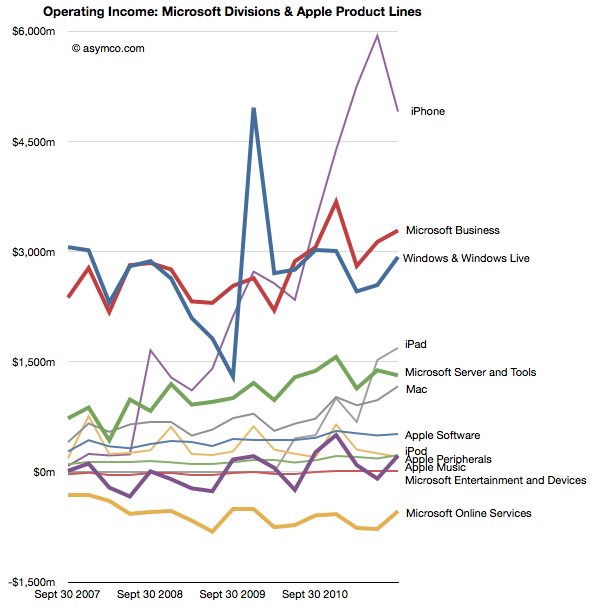
The lower two charts show operating income by division/product line. The left is again Microsoft with the line showing the consolidated income (net of losses). The right chart shows the stacked areas of profit from Apple's product lines with the yellow line shooing consolidated income. I copied the blue line from the Microsoft chart for a more direct comparison.
Apple continues for the third quarter to have higher operating income and for the fifth quarter maintaining higher revenues.
The following two charts are also another way to view the two companies. As percent of total, how do the product/divisions stack up? The first is Microsoft revenues as percent of total and the second shows the equivalent for Apple.
This comparison I think is most evocative. The stability of Microsoft is contrasted with the dramatic change that Apple is experiencing in the same time frame.
There is a dramatic shift of focus from traditional computers (Mac) to devices. If profit is an indicator of where resources are being allocated, then there is no clearer visualization of the difference between the two companies' strategies.
The following is a mix of all products/divisions operating income in one dense line chart (thicker lines are Microsoft divisions, thin lines are Apple products).
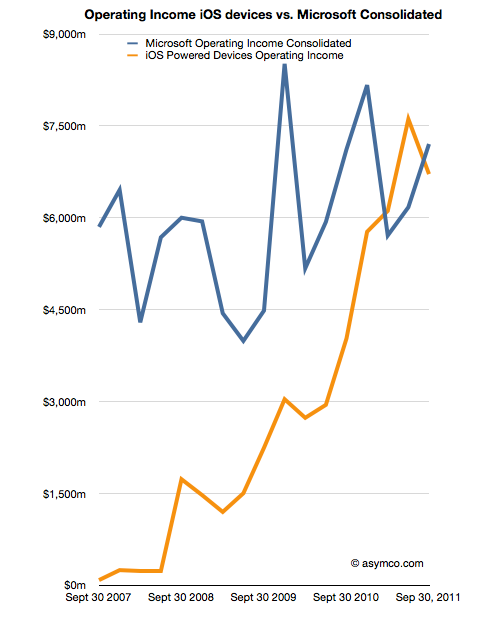
Finally, the comparison of operating income of iOS devices vs. consolidated operating income from all of Microsoft's businesses.
As iOS shifts into its fifth iteration my guess is that Apple will continue its growth trajectory. As Microsoft continues to adapt or protect its businesses from tablets and mobiles, will they grow? If so, how? Microsoft has shown consistency, but that is becoming less and less desirable.
I began thinking carefully about Apple in 2005 when the stock was priced at around $55/share. I remember that the events which made me consider Apple in a different light were the launch of the iPod shuffle and the launch of the Mac mini. Both moves signaled to me that the company was serious about competing with non-consumption. At that point I thought that the company was a potential opportunity as an investment.
But I also remember that many people at the time thought that the stock price was too expensive. At $50, the company was much more expensive than the year before. The stock started 2004 at about $11/share. The reason it had climbed so much was that the iPod began to be a real world-wide growth phenomenon. Buying Apple was buying into the iPod and many said the price was unsustainable given such a strong dependency on fickle consumer tastes. It was a much riskier proposition than that of competitors like Dell and HP which made product for reliable buyers like enterprises.
Indeed, by 2006, the shine was off. In the first half of 2006 the stock collapsed from $85 a share to $50, a fall of 40%. It was becoming clear that with mobile phones taking on more music playing features, the iPod was not going to be a big story for long. What's more, Apple had just announced that they were switching to Intel for the Mac product line. Investors saw just how vulnerable the company still was and considered that the Mac brand was in jeopardy as it transitioned to becoming a Windows-friendly machine.
However, in 2007 the company's value recovered with the introduction of the iPhone. Suddenly there was a new product to drive sales. Nobody knew by how much or how but there was a sense that the iPhone was enough to keep Apple from oblivion.
Yet, again, in early 2008 the company lost 40% of its valuation. In a rather inexplicable period following the launch of the MacBook Air, the company's shares went into free fall. Inexplicable because the company continued to deliver solid growth with 2008 calendar quarters showing between 32% and 155% EPS growth.
Then the recession came. It caused another 40% share price collapse. Growth slowed to a range of 11% to 61% during 2009. As the marco "headwinds" blew over, by the end of 2009, with the help of a lukewarm response to the iPad, the company's value recovered to its 2007 level. In the mean-time its earnings more than doubled.
It may not appear to be the case, but throughout this volatile period, the investment thesis remained fairly constant: Apple is a rather small collection of product bets. Owning Apple meant riding the iPod or the iPhone or the iPad as waves of growth. As soon as one growth wave was seen to start to fade, investors would say the same thing: Apple is done.
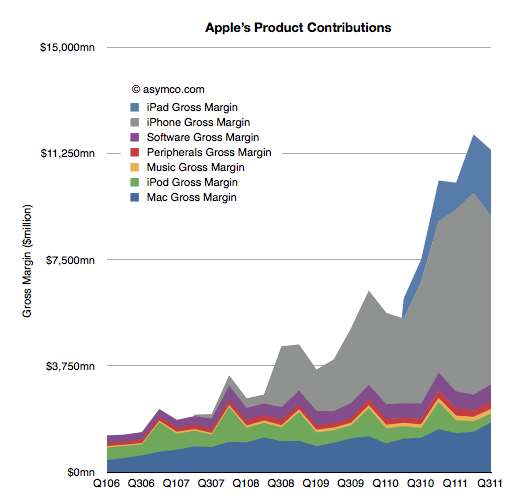
The chart below shows just what that looks like in terms of product contribution to gross margin.
The investment thesis is the same today. I've had dozens of conversations with fund managers and if anything, it's even more about betting on products. The iPhone and the iPad make up such a large part of profits that the company seems to be nothing but those two things. So if there is any hint that those products might slow down, the stock is sold off.
What intrigues me about this investment thesis is not whether the signals of growth are interpreted correctly or not, but rather that an investor in Apple in 2006 was considered perfectly rational valuing Apple as an iPod company as much as an investor today is perfectly rational valuing Apple as an iPhone company. Why would anyone buy Apple for any other reason? There is no evidence that Apple can be anything more. Any fund manager positing a different point of view would surely be limiting her credibility.
The consensus is that the value of future, unknown products is zero. Not only that but the probability that there will be any products at all is equally zero. Not only that but whatever Apple does to create new products is not perceptibly valuable. The company is simply the sum-of-the-product-parts and nothing more. Cash flows from current products can easily be shown to be more than the current valuation so even these products are deeply discounted. If and when a new product shows up, it will be considered and maybe if it shows promise, the stock will reflect that, briefly.
A corollary to this investment thesis therefore is that the process of product development at Apple is worth nothing. It does not matter if the company has shown an ability to disrupt and to create new categories. The past is not a predictor. The value of the company is a discounted cash flow of current products--discounted for the odds of commoditization, which are seen to be quite high. A new hit product is a windfall, a winning lottery ticket. Something that you cannot count on.
Think about that in a different context. That's like valuing Pixar on the box office revenues of its current movie. If Cars 2 is not beating records, Pixar is suddenly nearly worthless. The fact that Pixar repeatably creates blockbusters would be seen as meaningless. The way they built a reliable pipeline with predictable cost structures for movie-making is not interesting.
However, the fact is that Pixar did not get acquired on the basis of the last hit it made. It was acquired for its system of production. This can be confirmed not only by the price paid but by the fact that the organization was not folded into the Disney machine. It stands alone and is given autonomy. So at least in the movie making industry, predictability is seen as valuable.
So why is Apple not valued as a process company?
I think the answer lies in the lack of understanding or belief in a theory that predictable success in product development is possible. Until and unless an explanation is available that persuades a majority that Apple is as much a hit factory as Pixar then Apple without the products will intrinsically be valued at zero.
The premise of the stock market today is therefore that being innovative in technology is meaningless. Innovations are valuable but there is no such thing as an innovation process. If there was such a thing then we could measure it and put a number of its value. Until then innovation is nothing more than a spin of the roulette wheel.
There is finally enough information to try to give an estimate of the smartphone market as a subset of the overall phone market.
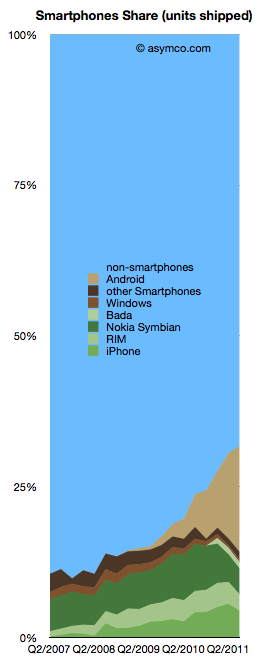
The chart to the left shows the overall picture.
To sum up: The smartphone market has now reached over 30% of shipments. Non-smart devices are at 69% of total. The individual phone platform shares are as follows:
Android (and Android-like): 17.6%
iOS (iPhone only) 4.4%
Nokia Symbian: 4.3%
BlackBerry: 2.76%
Bada: 1%
Windows Phone 0.5%
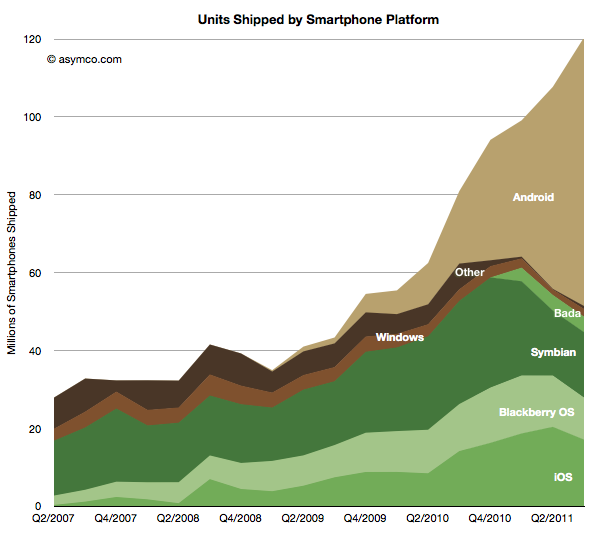
The past quarter was the first where there is evidence of significant non-seasonal decline in incumbent platforms. Both RIM and Symbian saw two sequential drops in volume. The iPhone had a seasonal (or, more accurately, transitional) decline. Windows Phone had a very modest increase in share from 1.3% to 1.7% share though this is well below a margin of error in the estimate.
Android (and Android-like) shipments ballooned to nearly 70 million but sell-through could be about 10 million less. Nearly one in five phones sold is now powered by an Android variant. A remarkable story since the share was zero less than three years ago
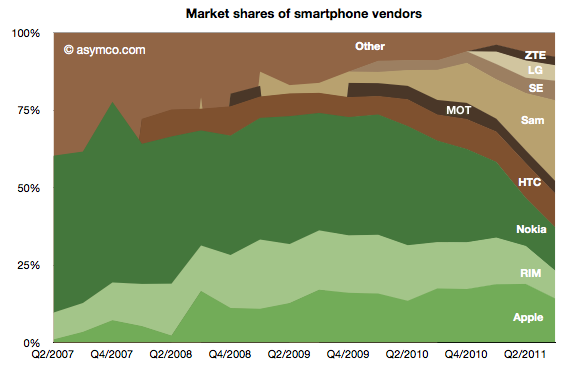
Of the vendors involved, here is the division of share:
Samsung achieved 26% share, nearly swapping share with Nokia over a single year. Nokia reached below 14% while Apple maintained above 14% but down from 19% the quarter prior. HTC overtook RIM with 11% vs. 9%. Sony Ericsson is around 6% and Motorola probably slipped below LG with 4% vs perhaps 5% respectively.
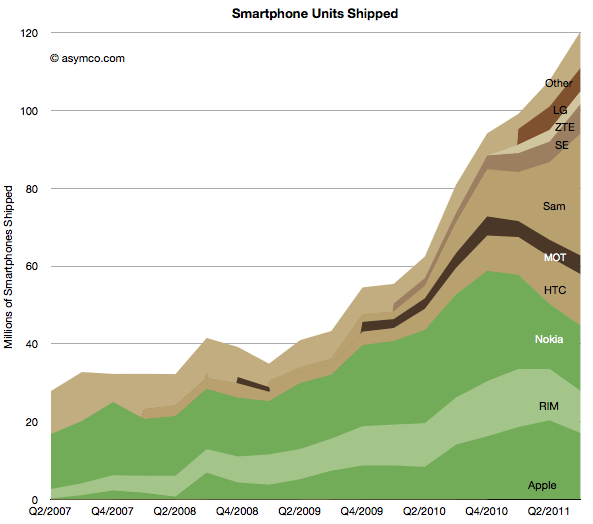
The absolute performance of shipments by vendor and platform follows:
I maintained the historic distinction between integrated (green) and modular (brown) OS strategies to show how the value chain evolved. As Nokia swaps its share to a licensed Windows Phone the share held by integrated vendors is likely to shrink even further.
Does this mean it's the end of integration? Or even more importantly, as I have previously suggested the link, is this the end of innovation in the mobile phone market?
It would appear that with 30% smartphone share, the vast majority of phone vendors are ready to abandon any ambition to obtaining extraordinary profits from mobile devices.[1] Apart from Apple, there seems to be complete capitulation to being manipulated by platform orchestrators with unpredictable or opaque intentions.
The thesis of perpetual innovation rules this out. While new input methods offer a clue that visual interaction and the platforms that depend on it are not permanent, the fact remains that cloud computing and the coupling of additional intelligence that comes with it will enable new points of integration and the positioning of these points on new jobs to be done.
Stay tuned as we discuss the future of mobile computing. The best is yet to come.
Notes:
By extraordinary I mean margins above what a component assembler and distributor would be able to obtain--see the PC industry.