Asymco

Asymmetric Intelligence

Latest from Asymco

  1. Global smartphone penetration nearing 10%

    Research · 43 comments

    Tomi Ahonen has compiled a fascinating data set on 42 major countries' smartphone penetration rates. The compilation is based on Netsize Guide, Informa, Google and Ipsos data. It is a complex sample with multiple possible sources of error (read the post for the caveats.) However, this is a breakthrough. It's the first time I've seen this level of detail at a country level in the public domain.

    I maintain visualizations of ITU data which shows overall mobile consumption and broadband consumption and penetration. In order to maintain a consistent basis of comparison, I prefer to use ITU's measure of consumption which is "subscriptions" rather than "population". The ITU derives this measure because mobile operators think of points of connection (subs) rather than people as the measure of consumption. This makes some sense because connections are what are monetized--not people.

    So the first piece of analysis is to show this measure of penetration (smartphones as a percent of subscriptions) for the 42 sampled countries.
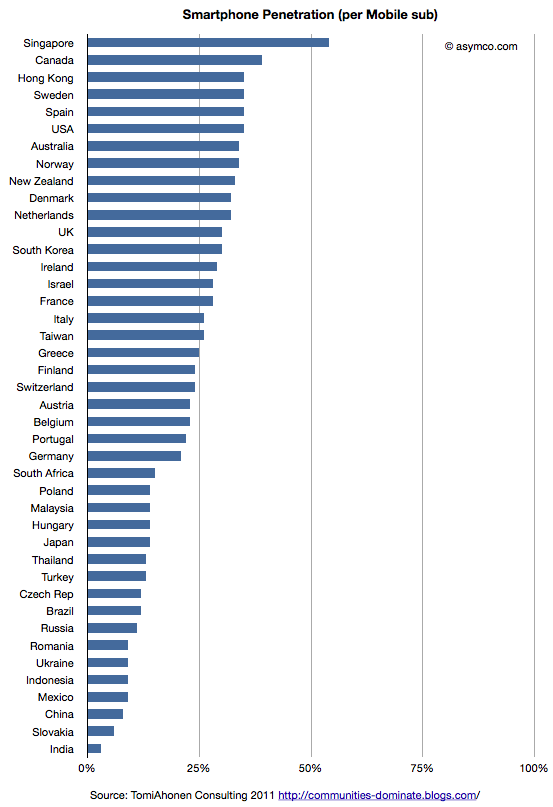
    This view shows which countries "lead" adoption in terms of penetration. It shows that the US is quite high in the ranking and the most penetrated "large" country.

    This is highlighted by the following chart which shows penetration of smartphones vs. total subscriptions with bubble size representing population size.
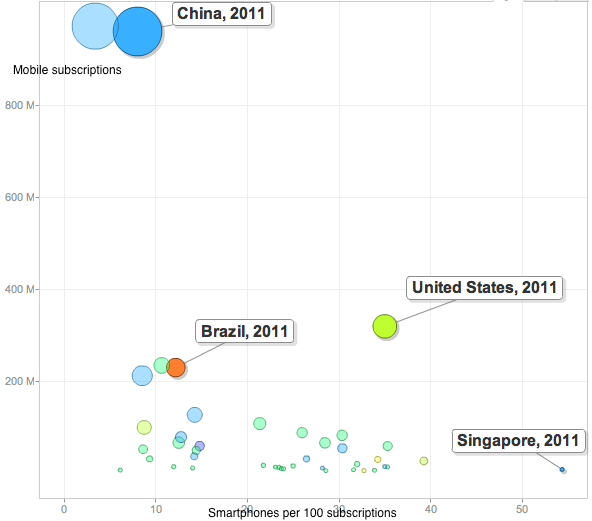
    The US stands out from the inverse relationship between size of mobile population and smartphone penetration.

    Part of this is due to the US having relatively low mobile penetration in general. It's below the median because multiple mobile phone use is uncommon.
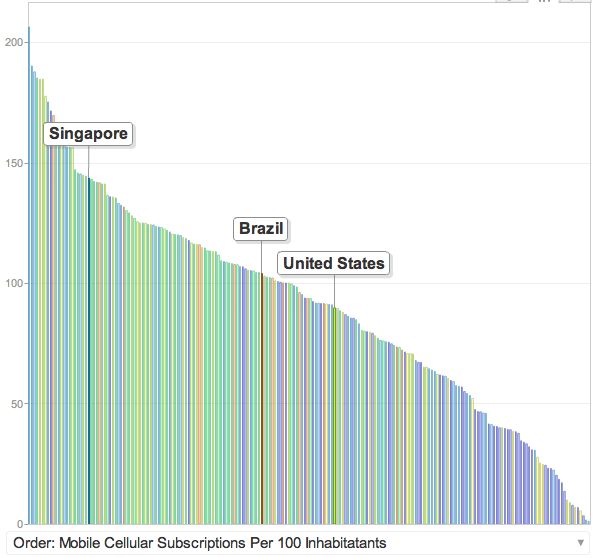
    But these bits of data are not the most interesting. In my opinion the following is:
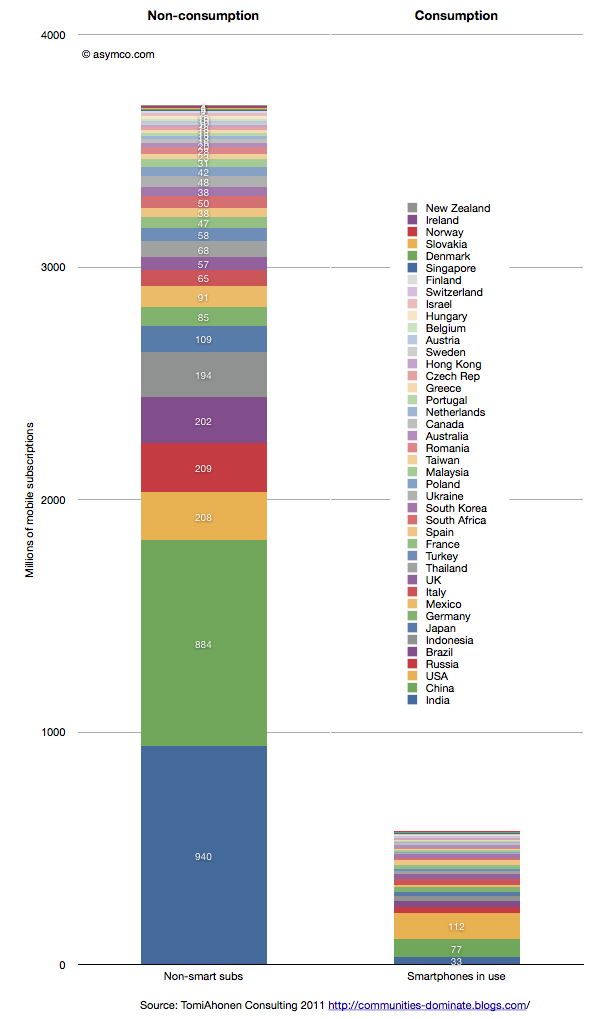
    This last chart shows the total size of non-smart subscriptions vs. the total size of smartphones in use for the 42 countries listed in the legend.

    There are 3.7 billion non-smart connections and 0.6 billion smartphones in use. Although not all of these 3.7 billion connections need to be enabled with a smartphone, the fact remains that there are six times as many non-consuming network connections that can still be addressed.

    How and when this ocean of non-consumption will be converted to computing devices are the most obvious questions the data raises. Of the selected countries only 13.5% of the connections are "smart".

    ITU data shows that at the end of 2010 there were 5.4 billion global subs. This survey was conducted more recently so the total is likely much higher (perhaps around 6 billion). The survey thus covers about 72% of the world. That implies that at least 90% of the market remains unserved.
  2. Subscribe to Asymco One for full access to our research.

  3. 5by5 | The Critical Path #15: The Theater of Disruption

    Podcast · 14 comments

    With this interview, we begin a journey into the world of entertainment and the forces that are re-shaping what most of the world hires daily for recreation. We will talk to actors, writers, producers, distributors, and media execs. We'll get perspective on what I expect will be a big year for television in 2012 and prepare for the new era to follow.

    In this episode I talk to actor Hoon Lee[1] about the challenges of disruption in the creative arts, and theater in particular.

    5by5 | The Critical Path #15: The Theater of Disruption.

    1. Soon to be the voice of Master Splinter on the to-be-re-released Teenage Mutant Ninja Turtles TV series. More about Hoon here: IMDb.
    2. Read more here: Building identity - Hoon Lee: a black sheep because he was artistically inclined
  4. Subscribe to Asymco One for full access to our podcasts.

  5. Hiding in plain sight

    Research · 67 comments

    Guessing the next Apple product has become the parlor game of choice for a whole generation of technology journalists and analysts. The premise of the game is that given a track record of breakthrough products, there is always another one just around the corner. Being the one to predict this next breakthrough product creates credibility and demonstrates the domain knowledge of the predictor. If the prediction fails to materialize there is consolation in dismissing the actual announced product as disappointing, unsophisticated or, worst of all, uninteresting.

    Most often, these guesses are as much a reflection of the analyst as they are an analysis of the company. Too many predictions are designed to impress or demonstrate the imagination or knowledge of the predictor. They typically anticipate a giant leap of functionality, power or market re-structuring. They envision revolution not evolution; a cutting of the Gordian knot not a polishing of ugly rocks.

    Yet nearly all of Apple's launches have been sustaining improvements in existing products, technologies or platforms. To name just a few:

    • The iPad is an evolution of the iPod touch
    • The iPod touch is an evolution of the iPhone
    • The iPhone uses OS X and Objective C from the Mac
    • OS X came from NeXT
    • The app store market model came out of the iTunes store
    • The iTunes store came from iTunes which came first to the Mac as a media sync tool for the iPod
    • etc.

    John Gruber explained the process last spring as it relates to many of Apple's launches. Although the iPhone did introduce a new user input method and experience that takes consumption in a new direction, its building blocks were there for all to see for many years. The iPhone is a natural evolution of the computer with a handy little "Phone" app.

    Likewise, the iPod came seemingly out of nowhere but by watching the original launch you see it as part of a "media hub" strategy that envisions the Mac as a personal server. The very products which ended up disrupting the Mac/PC began as extensions of their victims.

    You can trace the DNA of almost all of Apple's products to previous products. If Apple did not have these foundations, the slow-motion revolutions would not have happened. Rather than a deliberate big bang, Apple's disruptions are the result of a discovery process. A test, iterate and improve loop. This is why they seem obvious after the launch but also why they seem to be such an anti-climax.

    Therefore, the challenge of predicting Apple's next product should be tackled not only through an act of imagination but by carefully projecting the current products and understanding where they can evolve.

    So it is that I approach the question of Apple's TV disruption. My working assumption about the next Apple TV is that it already exists. It's none other than the existing Apple TV, improved.

    Here are the clues or hints I noted:

    • It uses iOS and the hardware from the devices that run it. It originally ran a PC architecture and shared a kernel with Macs.
    • It has been integrated with iTunes media stores (with the notable exception of the iTunes app store)
    • It has begun to introduce channels other than downloads (ESPN, Wall Street Journal) thus establishing its own distribution for traditional content
    • It is a global product, depending only on the Internet protocols and independent of the balkanized cable standards
    • Through AirPlay it is integrated with Macs and Apple devices.
    • Through display mirroring, iOS devices can use the TV as an external monitor and can even change their own behavior when doing so

    This last point is intriguing. I have not seen discussion of this feature, but if using an iPad 2 or iPhone 4S with iOS 5 and an Apple TV with the latest software updates it's possible to have an iOS device become a controller for TV-based game experiences. Developers are already using the API. When using a pinball game with screen mirroring, the device becomes a controller while the action takes place on the big screen. Switching display mirroring off bring the action and control back onto the small screen. There are still problems with lag and the processors are over-taxed on high frame rates, but the APIs are already there for developers. (I could also mention the potential of new a Bluetooth standard for better wireless response).

    What these signals point to is Apple defining the TV as an iOS portfolio product. This means integration with iTunes, including an app store. This, in turn, means unleashing developer/creative talent through new monetization opportunities. This means new user experiences in discovery. This means FaceTime-like communication through the TV. This means many other things but mostly it means that the TV will be a platform product.

    The only challenge is a (currently lacking) smooth interface. Perhaps that's where voice comes into the picture. But whether that is built-in at the next rev of the product or not is not the story. The story is going to be the sustaining improvement in the original Apple TV. A wonderfully asymmetric product begging to be ignored. A product that because of its apparent lack of success, effectively hides all its secrets in plain sight.

  6. Subscribe to Asymco One for full access to our research.

  7. Estimates for Apple's first fiscal 2012 quarter

    Research · 60 comments

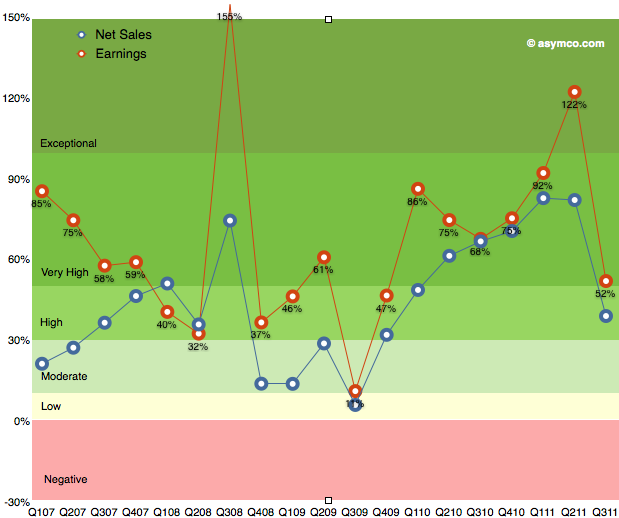
    As the chart below shows, the last quarter (third calendar, fourth fiscal 2011) was slow with only 52% earnings growth. The discussion centered on the (surprisingly) disruptive effect of the iPhone transition. Surprising since most analysts, myself included, were lulled into thinking that the portfolio of iPhones and their wider distribution would create a smoother sales pattern vis-a-vis the more cyclical pattern seen in the first three years of production.

    The second quarter was surprisingly strong and the third was surprisingly weak. So how do we estimate the fourth?

    We have the pent-up demand for the new iPhone, we have the dynamics of holiday spending and we have a question mark on pattern of growth for the iPad. I'll discuss each assumption in turn:

    The first assumption remains that iPhone growth is approximately 100% for the full year. Last calendar year there were 47.5 million iPhones sold. A 100% growth would imply about 95 million for this year. So far 56 million were sold. To reach a doubling then 39 million would need to ship in Q4.

    Another approach is to look at quarterly growth rates. Thus far, we've had 113%, 142% and 21% for the first three quarters. To reach an average of 100% for the year then the fourth quarter would need about 120% or 36 million units.

    36 to 39 million would be a good bounding range if there were no other mitigating factors. The information published so far shows no particular problems with either production or access to markets so I'm going to go with 35.7 million.

    The second major assumption relates to the iPad. The iPad has been a challenge to predict since launch. Not only is it a new category but it comes with a different launch cycle than the iPhone and has significant constraints on production. There have been only two quarters where we could measure y/y growth: 182.8% in Q2 and 165.6% in Q3. I was initially tempted to dial in 150% for Q4 but the question of transition comes up. The first iPad model grew well into the holiday quarter but dropped dramatically into the first as it went through the transition to the iPad 2.

    Are we going to see the transition effect earlier this year? I'm being cautious and suggesting only 100% iPad growth or 14.6 million units this quarter. This is still a very challenging product to forecast.

    So here are my fourth calendar quarter forecasts (with y/y growth in parentheses):

    • iPhone units: 35.7 million (120%)
    • Macs: 5.2 million (27%)
    • iPads: 14.7 million (100%)
    • iPods: 13.6 million (-30%)
    • Music (incl. app) rev. growth: 22%
    • Peripherals rev. growth: 25%
    • Software rev. growth: 25%
    • Total revenues: $44.6 billion (growth: 67%)
    • GM: 42.0%
    • EPS: $12.3 (91%)

    This earnings value would imply a trailing twelve months' EPS of about 33.5. At $390/share the P/E would be 11.6. Cash and equivalents may increase to $90 billion.

  8. Subscribe to Asymco One for full access to our research.

  9. How productive is an Apple store employee?

    Research · 75 comments

    Apple publishes data about its "retail segment" which ifoAppleStore.com catalogs. Here are some statistics I was able to compute from the data:

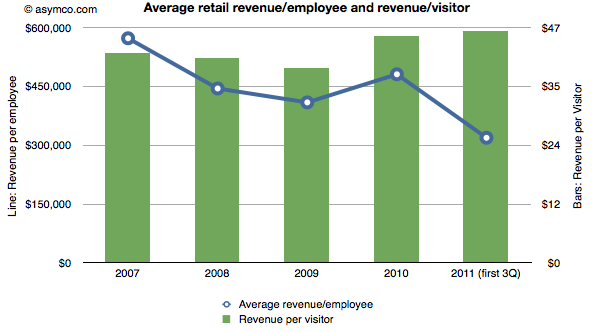
    • The stores generate over $100k per employee per quarter. In 2010, revenue was $481,000 per employee. This year the average is around $320k excluding the fourth quarter. In 2009 the average revenue for the technology sector was $388k/yr. A retailer like JC Penney generates about $124k of revenue per year per employee.
    • The revenue per visit is around $45. There are well over 250 million visits per year (222 million for first three quarters of 2011).

    The combination of these two metrics are shown in the following chart:

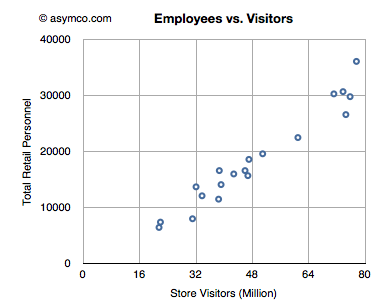
    • The number of employees has grown in proportion to the number of visits. There is one employee for every 2,500 visits/quarter. The following chart shows the relationship between retail personnel and store visitors on a quarterly basis.
    • Assuming an employee works for 360 hours per quarter, the average employee sees 6 visitors per hour or one every 10 minutes.
    • As that visitor generates more than $45 of revenue, an Apple store employee creates sales at the rate of about $278/hour.


  10. Subscribe to Asymco One for full access to our research.

  11. Will Windows Phone get to compete with non-consumption?

    Research · 45 comments

    Before diving into the answer to the question in the title, there is some new data to digest.

    The latest from comScore shows consistency with the previous months of smartphone growth in the US.

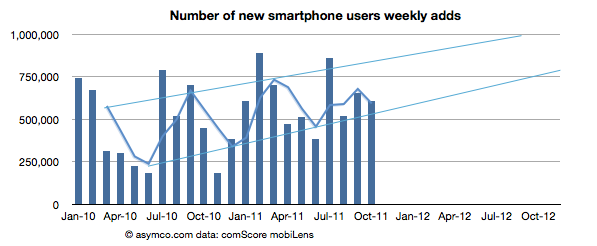
    • The growth rate was 607k/wk new-to-smartphone users. This is slightly down from 654k/wk for the previous month but up significantly from 450k/wk the year before.
    • The penetration of smartphones reached 38.5% (non-smartphones are at 62%)
    • The penetration should reach 50% before September 2012 with about 1.2% being converted every month.

    The following chart shows the weekly add rate with a three-period moving average:

    This chart is important in that it should first show signs of inflection in growth. That does not seem to be happening yet.

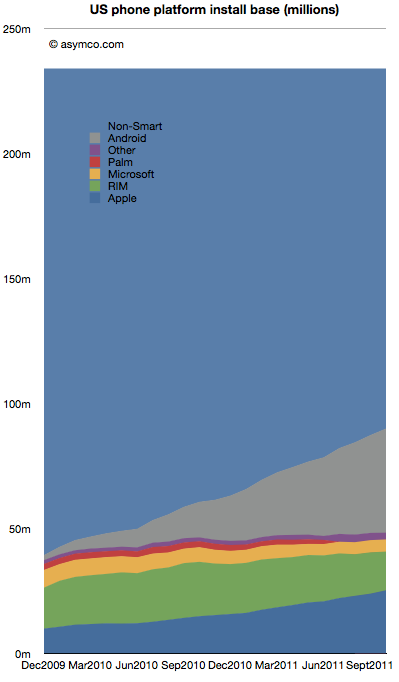
    The installed base by platforms is shown below:

    Android is estimated to have grown to 41.7 million users in the US, adding 2.5 million users in the last month. Android is adding half of Microsoft's entire US mobile base every month.

    RIM BlackBerry lost one million users in October. RIM's slide has accelerated again with over 3.7 million leaving the platform in the last six month. With 15.5 million subscribers, RIM has fewer users in the US today than it did in late 2009.

    iPhone gained 1.34 million. Installed share increased slightly to 28% from 27.4% the previous month. There are now over 25 million iPhone users (above age 13) in the US.

    Windows Mobile/Phone had no perceptible change (-34k) indicating perhaps that the losses in Windows Mobile are being erased by gains in Windows Phone. Microsoft's platform stopped losing significant users six months ago. Whereas the bleeding has been stopped, overall number of users remains at a rather poor 5 million or 5.4% share.

    "Other" which includes Symbian and WebOS lost another 184k users to reach only 2.7 million users.

    There are still 144 million smartphone non-consumers.

    Android and iPhone now make up nearly three quarters of all smartphone ownership in the US. That's a total of 67 million users. With no sign of slowing, the chances are that there are at least 100 million users still remaining to convert. Sounds like an attractive target. But that target is shrinking fast. The rates of adoption signal saturation of most likely buyers will happen toward the end of next year.

    At least 25 million new Android users will be gained and at least 10 million new iPhone users will be created in the next 12 months. That's 35% of remaining non-consumption. Assuming some acceleration, it's not hard to see 50% being claimed by the two entrenched incumbents.

    This leads to an interesting positioning question. Is Windows Phone destined to compete with consumption or non-consumption? If traction is not forthcoming in the next 12 months, that leaves a very difficult last 50 million available as non-consumers. They are more difficult as they will be late adopters and perhaps more price sensitive and less motivated by features.

    Windows Phone still has quite a bit of opportunity outside the US, but in the US (and in Europe which is not much different) the competition will increasingly be with rival incumbencies not with non-consumption. As the custodians of the Windows franchise, Microsoft should be well aware of the inherent difficulties with competing with installed platforms.

  12. Subscribe to Asymco One for full access to our research.

  13. Android vs. iPhone

    Research · 40 comments

    It has no price and hence there are no ways markets can signal demand or value creation. Furthermore, Android is not being offered to users like the iPhone. Android's "customers" are phone vendors who package the software with additional value-added hardware and sell the combination to operators or distributors who then package it further with services and offer the total to end users.

    So obviously, comparisons between Android and iPhone center on instances of Android used in real products and the "market performance" of Android therefore relies on these proxies for Android — the aggregate sum of products that have some form of Android in use.

    I wrote this in response to a very short brief: "We're looking for an editorial piece that comes down on either side of the debate of iPhone vs. Android". The challenge I saw was on the approach to the question of "iPhone vs. Android". I chose to measure value creation by the means available to shareholders.

    Read more here: Horace Dediu Android Vs. iPhone on BusinessInsider.com

    [I am posting this here in the hope that comments will accrue to this forum as well.]

  14. Subscribe to Asymco One for full access to our research.

  15. Subscribe to Asymco One for full access to our podcasts.

  16. Does Growth Matter?

    Research · 85 comments

    In last week's discussion of Apple's (historically low) valuation, comments arose that perhaps the company's discount is not unique. Can we look at comparable companies and determine whether the relationship between growth, size and valuation are consistent?

    The challenge is in finding "comparable" companies. Apple is characterized by being large in terms of market capitalization, highly profitable, in the technology sector and growing relatively quickly. One can find a cohort of companies with each of these characteristics but not all.

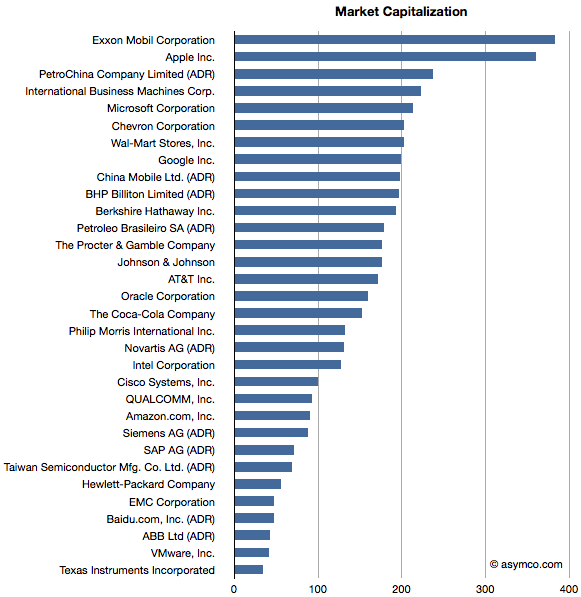
    Here is an attempt at looking at the largest companies by Market Capitalization (the so-called Mega-caps) to spot patterns of valuation. Some of the companies in the top 20 mega-caps were technology companies so I thought I'd highlight them. I then also added a few of the top 20 technology companies by capitalization to create a larger sample.

    The group I settled on is shown in the list below ranked by market cap.

    Companies below $130 Billion in market cap (i.e. below Novartis) are in the top 20 technology list but not in the top 20 overall list.

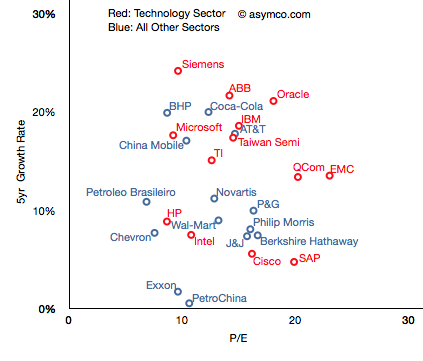
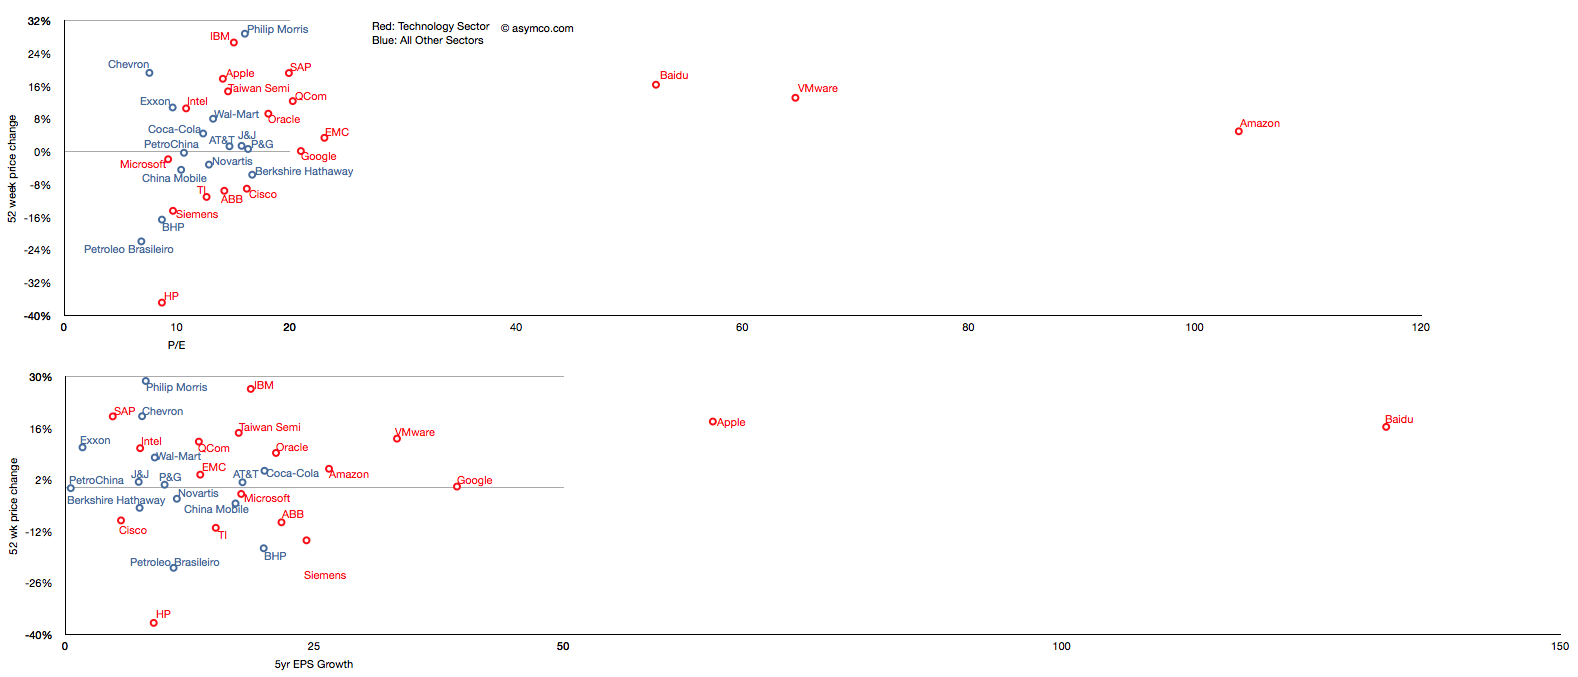
    I then plotted the P/E rate vs. 5 year Growth Rate for these companies, separating the tech sector by color (Red):

    The pattern is not encouraging. It appears that there is no correlation. Perhaps the technology companies are, as a group, further up and to the right, but overall they are equally unobservant of growth.

    For example, SAP has grown less than 5% in five years and yet enjoys a P/E of 20 whereas Microsoft has grown 18% and has a P/E of less than 10. The non-technology sector companies are similarly broken. Berkshire Hathaway, a conglomerate, is rewarded for slow growth and China Mobile is punished for relative high growth.

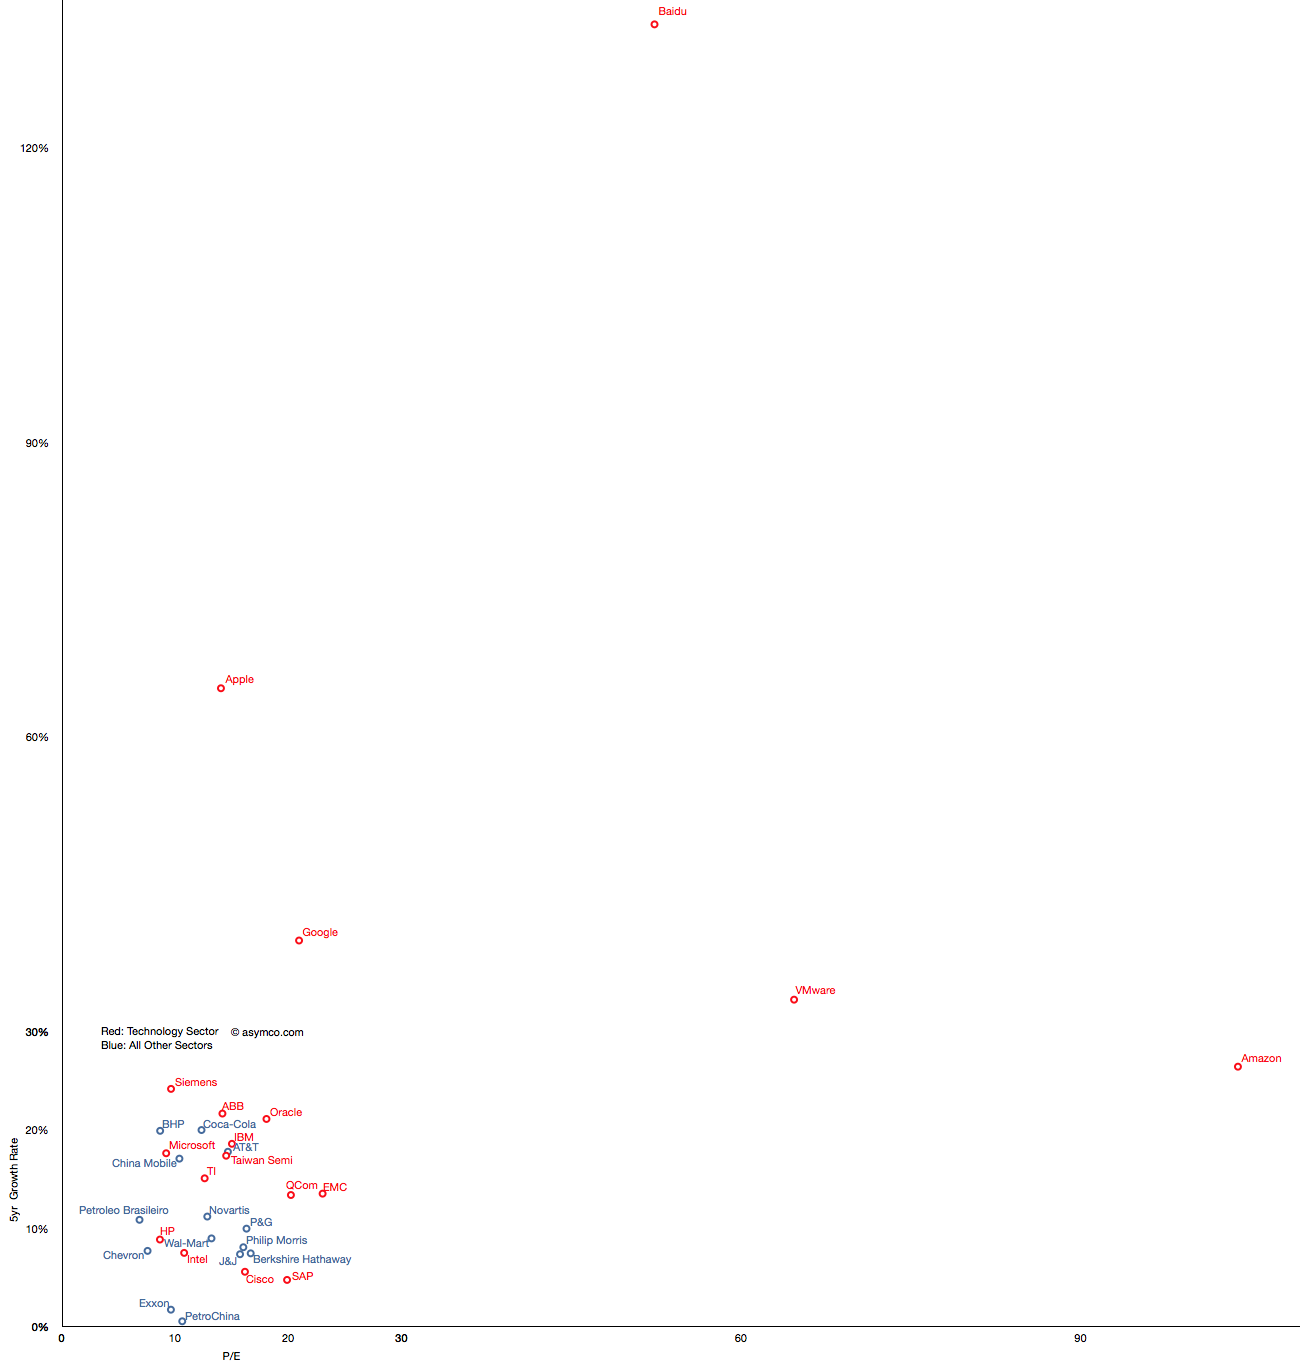
    But you'll notice that some companies are not on this chart. That's because they are outliers. Their growth or P/E are so far out of this cluster that the would make it impossible to discern individual performance. The complete "top 20" picture is shown in the following chart which will require either a large display or a lot of scrolling (1300x1364 pixels):

    With this level of detail, we can see how distinct some companies are. Not only from a correlation point of view but from a cluster of peers. The outliers are Amazon, Baidu, VMware, Google and Apple.

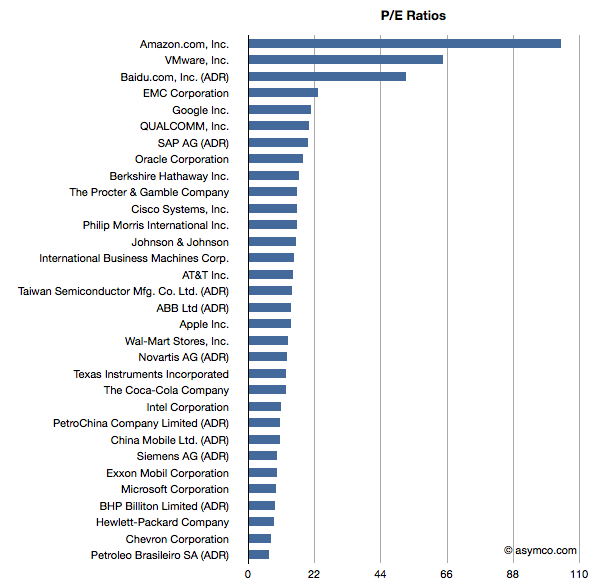
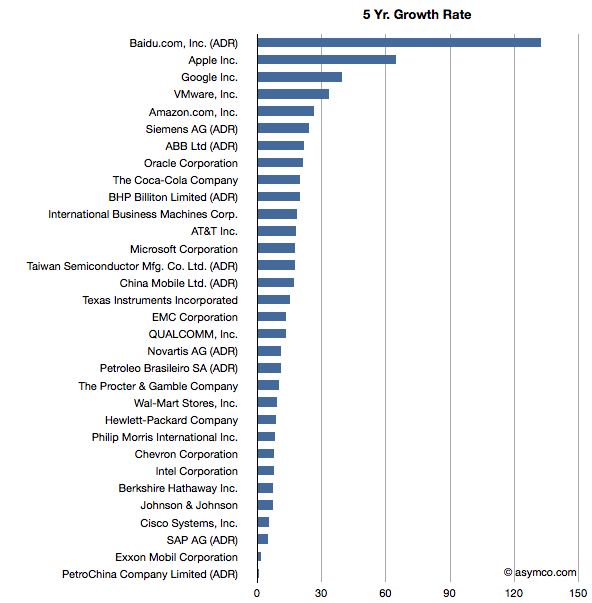
    These outliers can be seen also in ranking of P/E and Growth:

    Baidu has grown earnings by 132 percent while creating a market cap of $47 billion and has a P/E of 52. Amazon has grown by 26% while having a total value of $90 billion and a P/E of 104. VMware is "only" a $40 billion market cap company with a 5yr EPS growth of 33% and a P/E of 64. Finally, Google has returned a 39% growth rate, a market cap of about $200 billion and a P/E of 21 and Apple brings up the rear of P/E with 14 but with the second largest market cap of $360 billion and the second largest growth of 65%.

    What this analysis shows is that the market does not have any "rule" of rewarding growth with a high P/E. If anything, the outlier analysis shows that there are significant anomalous valuations that cannot be explained by growth data.

    ---

    Note: I've also tried to observe correlation between recent share price change and growth and recent price growth and long-term earnings growth.

    Similar anomalies and lack of correlation can be observed.

  17. Subscribe to Asymco One for full access to our research.

  18. The big bang theory of computing

    Research · 63 comments

    HP's CEO Meg Whitman admitted that, when iPads are included, Apple will overtake HP as the world's leader in computer shipments.

    “We need to improve our game and our products to take over the leadership position. Apple could go past HP in 2012. We will try to become the champion in 2013.

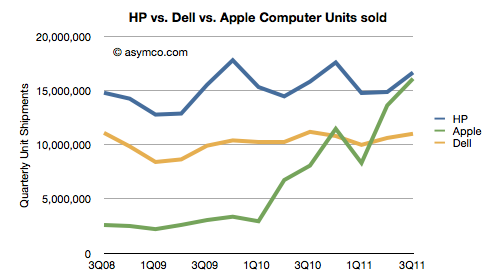
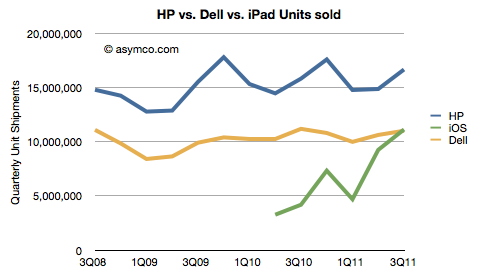
    When the quarterly shipment data is seen as a chart the doubt of this happening disappears:


    Note that the combined iPad+Mac has already overtaken Dell. In fact, the iPad alone overtook Dell in Q3 and might overtake HP in two quarters.


    The iPad is growing at an average of 170% y/y (average of two quarters) while the Windows PC market is growing at an average of 1.9% over the same period (source: Gartner, company reports). The

    Placing the iPad in the "competitor" category is an important admission for a PC company. Categorization choices make all the difference when thinking about strategy. The new tablet product may not appear at first glance to be competitive with the current definition of a PC (though it might very well be a personal computer.) But definitions tend to evolve. Categories are abstractly defined. The original PC was certainly not competitive with Mainframe computers and perhaps it still isn't. But that does not mean that usage (and hence value capture) did not migrate. Most people today would say a PC is a "real computer" and the Mainframe is simply an old computer.

    Whitman notes that the iPad is not the only computer people use and most have a PC as well. That may be true as it was true when the PC was new. Most companies that supplied PCs to workers maintained large computers for "mission critical" applications like accounting and engineering. The two technologies lived side-by-side for many years. In fact, in the beginning there was a thriving market for software and hardware that would allow PCs to be used as terminals to access central computers. It wasn't until PC servers and server software like that from Novell and networking from 3COM became commonplace that mainframes and minis began to fade.

    So in practice, there was no big bang start to the post mainframe era. The evolution of the PC went through stages. It was an isolated local computer, a client-server solution and then finally a web-enabled communication product on its way to ubiquity. But the era did change.

    So if history serves as a guide, the displacement of the PC won't come from a direct substitution but a more sinister and hard-to-predict subversion through new applications and a re-definition of what a PC is. The driving forces are not just volumes but new input methods, new user interfaces, new jobs to be done, new software and many innovative companies working within an ecosystem.

    If there is one difference today it's that things are happening a lot faster. A transition that took a decade is happening in three years today, even though the entire market is orders of magnitude bigger.

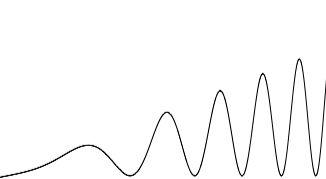
    When I visualize the cycle time of technology change, I see it as the waveform to the left: as cycle time decreases (i.e. frequency increases), the opportunity (amplitude) also increases.

  19. Subscribe to Asymco One for full access to our research.

  20. The thermodynamics of Apple's share price

    Research · 82 comments

    Andy Zaky at Bullish Cross wrote a great post on Apple’s valuation, showing the deep discount of Apple's earnings vs. an average company. It essentially states that Apple's money is not green.

    Felix Salmon took it forward by enumerating a few explanations that might be used for the despondent valuation. None are successful arguments, but that should not be a surprise.

    To understand the phenomenon a bit more precisely, I maintain and think about these charts:

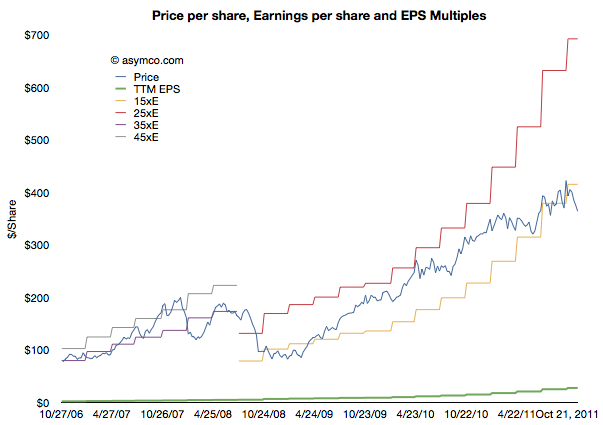
    This shows Apple's share price ("P" in blue) and its earnings per share ("E" in green). In addition there are multiples of the earnings in "bands". The first band is 35xE to 45xE which bounded the price during the period of 2006 through most of 2008. The second band is 15xE to 25xE which bounded the price since then. The data is updated weekly so it is current as of last Friday.

    Illustrating it this way shows how the stock is seen as representing different companies at different times. The 2006 era (iPod) Apple was seen as a high growth, dynamic company with loads of headroom for growth. The current (iOS) Apple is seen as a slow growth, fairly static company with most forecasts showing 20% growth potential.

    Note that the price has dropped outside the current band for the first time since the great recession. It is still below 15xE today. Perhaps a new band is forming.


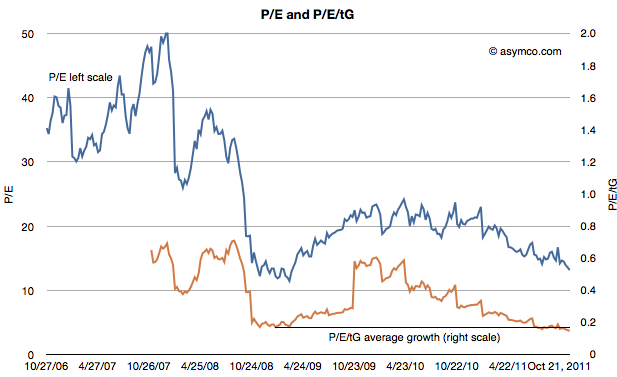
    The second chart shows the P/E on its own (in blue) but with a second measure where the P/E is divided further by the average trailing twelve months' growth (P/E/tG). This is a variation on the P/E/G (aka PEG ratio) where instead of (mostly wrongly) estimated future growth I use actual growth history--hence the t for trailing. The P/E/tG is a way to normalize P/E as a function of growth and hence a more appropriate index of value potential.

    I added a horizontal line to the chart to show the minimum value P/E/tG reached during the recession (0.17 in January 2009). As you can see, the P/E/tG is now lower than at that time (0.15). It implies a deeper discount for the company's earnings growth than during the time when the world faced economic contraction.[1]

    Note also the trend of that line as it shows a steady linear path toward zero.

    Of course, it cannot reach zero unless Apple files for bankruptcy. But until it does file, the line can only reach zero asymptotically as E/tG increases. Which is a relief, I suppose, as it means the rate at which P/E/tG drops will decrease. This implies that as earnings growth persists, the drop in price will have to moderate.

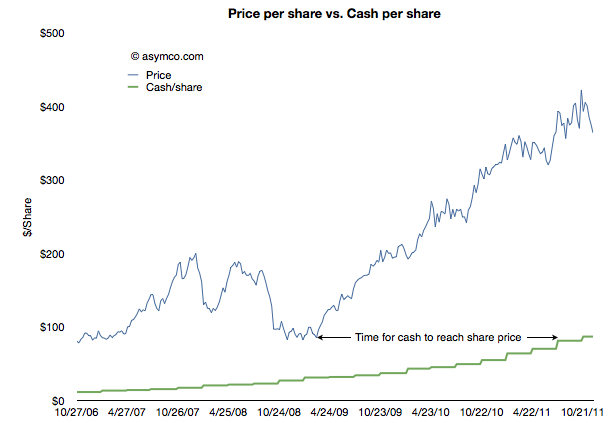
    The other threshold to keep an eye out for is when Apple's share price will reach its cash per share. That's the point when investors will consider the company to be a net value destroyer. If you performed that analysis in January 2009, and you were accurate about earnings forecasting, the answer would be well before today. See the following chart:

    In other words, in January 2009 the stock was trading at a price (<$80/share) below the current cash per share (>$85/share). It took Apple 18 months to grow its cash to reflect the price set on the company. Had the stock not risen then the company would today be trading below book value.

    The amazing thing is that today the valuation structure (P/E/tG) is even worse than in it was January 2009. An interesting exercise would be to project how long it would take for the cash to increase to the current share price.[2]

    I imagine this time interval should have a name. How about the time to boil: the time for growth pressure to become sufficiently high to exceed disbelief that growth can happen.

    ---

    Notes:

    1. Note that the low values were placed on the company after the crisis took hold, not as an anticipation of contraction. See the behavior of the index during the summer of 2008 as the credit crisis was unfolding.
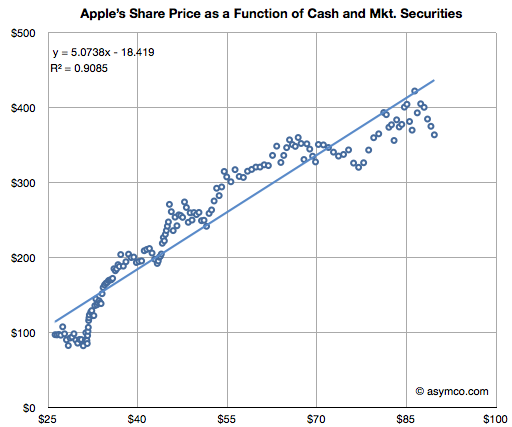
    2. This analysis is consistent with the analysis that Apple is not valued on earnings or earnings growth but on its balance sheet. The ratio of Price/Cash has been fairly constant but if it breaks down (as it has been--see below) then we need to assume a new dynamic is in place.