Asymco

Asymmetric Intelligence

Latest from Asymco

  1. Ascent of the entrants: Taking food from the mouths of giants

    Research · 34 comments

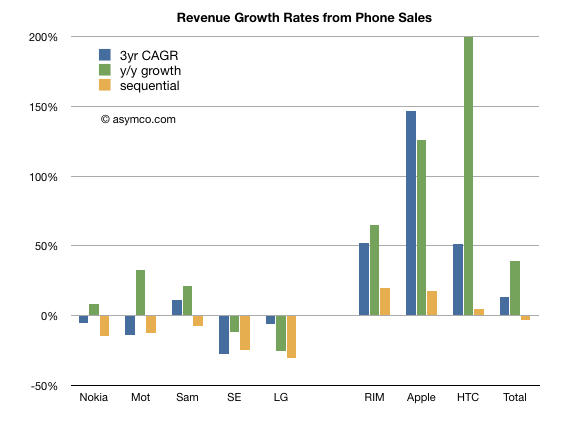
    Revenues for the eight phone vendors I track increased overall during the last three years. The compounded annual growth was about 13%.  However the growth was not evenly distributed. The following chart shows revenue growth across three time frames: Three year compounded, year/year quarterly and sequential quarterly.

    I separated the incumbent companies from the "entrant" smartphone vendors for contrast.

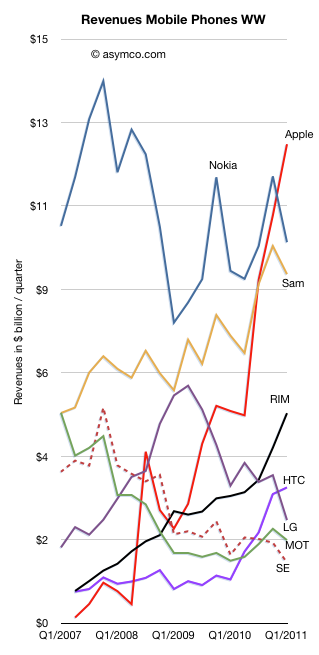
    Looking at individual performance, the following chart shows how each vendor performed over time:

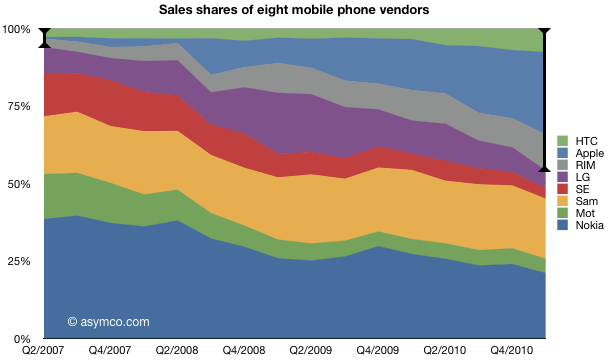
    The share of revenues is shown in the following chart (I highlighted the smartphone cohort):

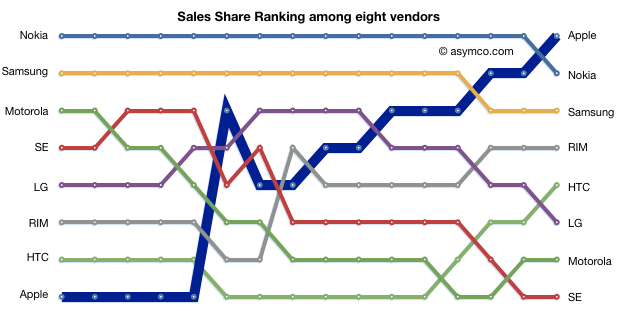
    The ascent of the entrants is shown in the league table below:

    The headline that Apple became the biggest phone vendor in the world by revenue has already flashed across the feeds of the world. It's another straw on the camel's back. But I'd like to take a moment to note that this is not just an Apple story.

    If you look at the league table, RIM, HTC and Apple were at the bottom three years ago and now they are either in the top or the middle. RIM in particular deserves credit for reaching the fourth spot and staying there. HTC also has shown a late surge to fifth passing LG, Motorola and Sony Ericsson in the process.

    Combined, these vendors went from taking in about one dollar in 20 (6%) in Q2 2007 to nearly half the money (46%) in Q1 2011. As the market also grew, the total amount went up an order of magnitude. From $1.8 billion to $21 billion in three years. Not bad for niche players.

  2. Subscribe to Asymco One for full access to our research.

  3. The end of phone vendor tiers

    Research · 25 comments

    It's time to review the mobile phone market at the end of the first quarter of 2011. Before I begin, I'd like to remind that this analysis will span multiple posts and that many details will be published separately due to time and space constraints. Data about platforms, sales, profitability and pricing will be posted separately.

    All data sets and chart data will be available for interaction and download through Asymco Interactive when complete. You can purchase a license to Asymco Interactive anytime and you will have access to any new data sets for next 90 days so don't hesitate to pre-order the report.

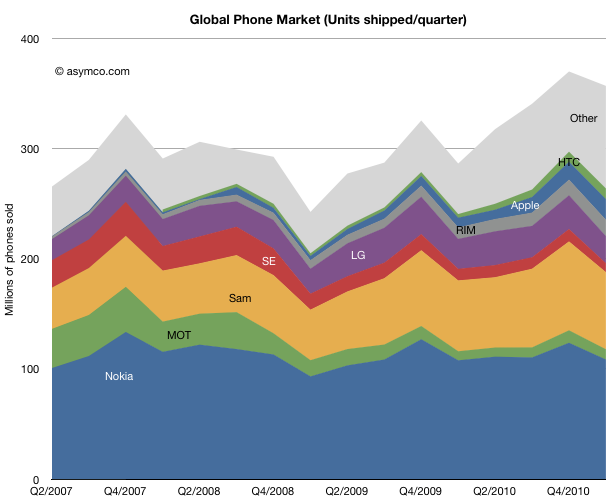
    The overall phone market grew at a compound rate of 9% over three years. The pattern of entrants focused on smartphones and mobile computing growing faster than the incumbents continues. The compound three year unit growth for the tracked vendors in descending order is:

    1. Apple 122%
    2. HTC 55%
    3. RIM 50%
    4. Samsung 15%
    5. Other 14%
    6. LG 0%
    7. Nokia -2%
    8. Sony Ericsson -29%
    9. Motorola -30%

    To give an idea of the split between smart and non smart, Nokia's smart business grew at 18% compounded while its non-smart units contracted at -6% rate.

    In terms of y/y growth the market grew at 26% and the vendor ranking is:

    1. HTC 194%
    2. Apple 113%
    3. Other 103%
    4. ZTE 75%
    5. RIM 42%
    6. Motorola 13%
    7. Samsung 9%
    8. Nokia 1% (smart: 13%, non-smart -2.3%)
    9. LG -10%
    10. Sony Ericsson -23%

    Sequentially, the growth rankings are:

    1. Other 28%
    2. Apple 15%
    3. HTC 7%
    4. RIM 5%
    5. ZTE -10%
    6. Nokia -12%
    7. Samsung -13%
    8. Motorola -18%
    9. LG -20%
    10. Sony Ericsson -28%

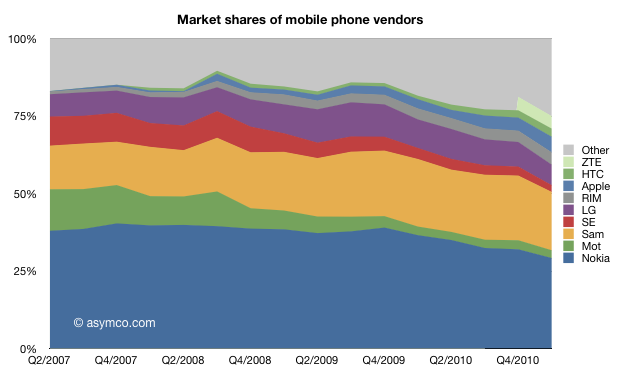
    In terms of market share, the field is becoming more crowded.

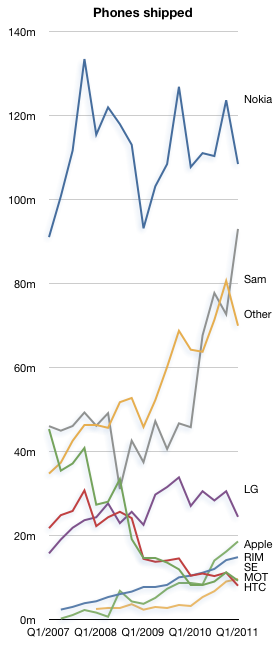
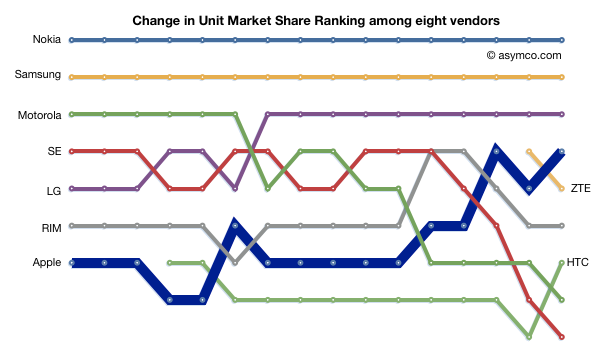
    The ranking of units shows a continuing relegation of Sony Ericsson and the increase of HTC to 7th spot. Apple reclaimed its fourth spot from ZTE.

    As the number of vendors increases and the share of incumbents decreases it becomes harder to identify who is a "top tier" vendor or, in fact, what the tiers are.

    It's pretty clear that on a unit basis there are nine vendors selling significant volumes. The other important observation is that vendors like ZTE are graduating from "other" while "other" is still growing, now at 25% of the market.

  4. Subscribe to Asymco One for full access to our research.

  5. Measuring iPhone progress

    Research · 65 comments

    Speaking of boats, there were recent claims that the iPhone is "dead in the water". As someone who has done some sailing I can say that being dead in the water is dangerous. Not only are you not going anywhere but you also don't have steering control. It's movement through the water that allows a rudder to work so being stationary means that you can't orient the boat when waves or wind might threaten stability.

    This implied inability to gain directional control is what makes the accusation so powerful. How valid is it? That claim certainly was not made because the iPhone did not grow. iPhone grew at 113% year on year. It even grew sequentially in a post-holiday quarter and the growth is not slowing materially.

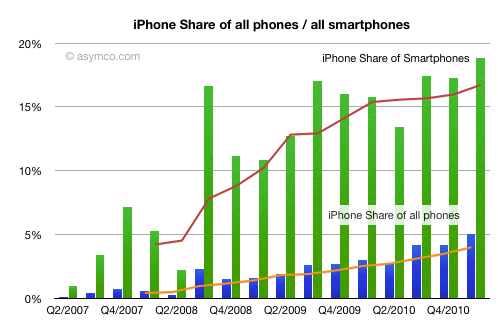
    The claim was made that iPhone was not gaining share. But share of what? If we look at the iPhone share of all phones and share of smartphones, it's still growing. It reached 5% share of all phones sold in the quarter and fourth most popular vendor in the world. Beating RIM, HTC, Motorola, Sony Ericsson and ZTE.

    So what makes the iPhone dead in the water?

    The claim was made relative to the (a) share of (b) mobile platforms (c) installed base (d) in the US. In other words, if one adds all Android phones in use vs. the iPhones in use in the US (while ignoring iOS devices other than iPhone) while the market is growing at nearly triple digit rates, then the iPhone is not gaining (much) share.

    That's the most obtuse way of suggesting a slowing product. If something is dead in the water, it isn't going anywhere or making any progress.

    On a unit basis and one the basis of vendor comparison, iPhone is doing very well. On the basis of value capture and profitability it's doing even better. More about that later.

  6. Subscribe to Asymco One for full access to our research.

  7. A rising tide does not lift leaking ships

    Research · 28 comments

    I've often said that the smartphone rising tide has lifted many boats. If you were selling smartphones during the last three years, your business was growing, no matter what phones you made.

    In fact, measuring success and failure was a matter of deciding what growth rate was "not good enough". Growing at 30% was nearly enough to shame some vendors into re-evaluating their strategies.

    But that sort of tidal growth can't last. At some point  ships with holes begin to sink no matter what the tide brings.

    When we look at the data from the last quarter, we should be asking again whether some ships have developed some leaks.

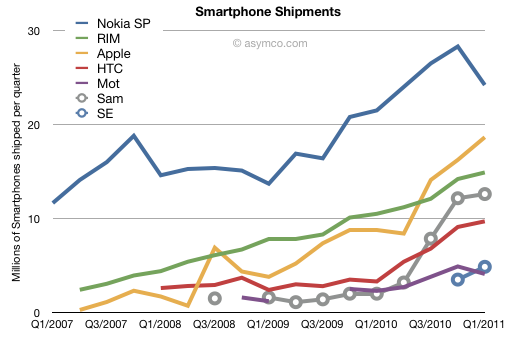
    The challenge is in eliminating seasonal effects. Q1 is usually a sequential drop for many markets. There is an unsettling drop in Nokia and Motorola and a weakening in Samsung and HTC. On a year/year basis the growth rates appear more robust for HTC and Samsung (194% and 530% respectively), but one should note the low bases they started from. Apple maintained triple digit growth (113%) while RIM sustained a respectable 42%. Motorola grew at 78% but looks weak sequentially. Sony Ericsson began to offer smartphone units and they are showing a run rate similar to Motorola but can't gauge their growth rate yet.

    Apple and RIM seem largely unaffected by seasonality but Apple is growing twice as fast.

    But the biggest surprise is the drop in Nokia's volumes. There was a similar drop in Q1 2008 but the phone market was plunging into recession then and the company's smartphones moved in sync to the overall market (one with limited competition). This quarter's drop happened when the overall market is growing. The alarming thing is that Nokia's smartphone performance in Europe seems to be a big part of the problem.

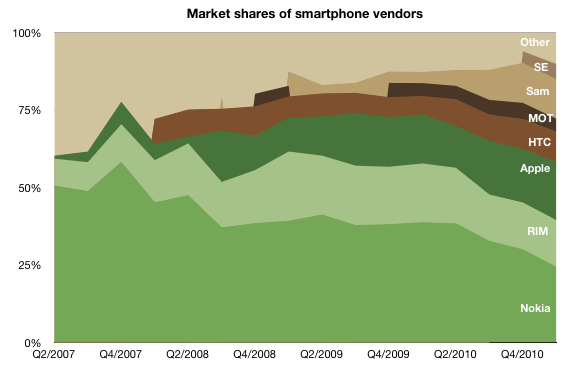
    Data from IDC shows that Nokia's volumes plunged by 15% y/y in Europe while the smartphone market there grew by 76%. Apple ended up with the largest share in a region that had been Nokia's with 70%+ share. That share is now under 20%. Nokia's overall growth was a mere 13% y/y while the market grew 73%. The result is the following picture of Smartphone shares:

    But perhaps the drop should not be a big surprise. Was it due to the public execution of Symbian? Did Europeans stay away from Nokia in droves due to an aging portfolio or because they felt betrayed. Perhaps we'll never know but there is another indicator to mull over. Nokia's brand fell to 81st spot in a recent survey. It used to rank in the top 10.

  8. Subscribe to Asymco One for full access to our research.

  9. Codifying asymmetry: How Apple became Jobsian

    Research · 79 comments

    Any student of organizational theory must struggle with the question of how to assign weight to the influence of the leadership of a company. In the case of Apple, the question is:

    Is Jobs is the embodiment of Apple or is Apple already Jobsian, imbued with his ethos?

    John Gruber summed up (start at 8:00 min) the "Apple is Jobsian" argument by saying that Apple is Steve Jobs' greatest creation and that he has been working on crafting the company as much as he has been crafting products. The result being that it's well designed for sustainable longevity.

    The arguments for "Jobs is Apple" are mostly rooted in anecdotes of a supreme leader that is indispensable to every decision and detail. There are also ample examples from history of companies who foundered after the departure of founders (Apple itself is notably cited.)

    But beside armchair quarterbacking, what evidence is there that Apple is being engineered to operate independent of its founder? Unfortunately there is almost no organizational analysis for Apple. Unlike many of its contemporaries, there aren't org charts or tell-all accounts on life in Cupertino. There are no anonymous "mini-aapl" blogs or tales from the disgruntled.

    For this reason, a recent quote about the mysterious "Apple University" in Fortune caught my eye.

    First a brief review of what was known.

    Apple University was first mentioned in 2008 when Joel Podolny was hired from running Yale Management School to join Apple in creating this new "University". I remember at the time thinking what such a thing might be. To leave the top job in one of the top business schools to join Apple must require some powerful incentives. I envisioned Apple entering into a far more ambitious iTunes project where they could be offering degree programs or teaching resources through the familiar store front.

    But nothing was heard about Apple University again. Until yesterday.

    According to the article in Fortune and some additional details from another source, Joel Podolny has been building an understanding of how Apple is run. He's then been asked to codify this understanding into a curriculum that can be taught to Apple employees.

    The idea that Apple is trying to capture its institutional processes and knowledge is very compelling. Few companies have self-knowledge. Fewer still try to codify it and teach it to new generations of leaders (Disney, McDonalds and Toyota have in-house training programs but they are mostly aimed at new hires).

    For those who don't bother, the consequences are a more rapid descent into disruption. I've experienced the consequences of the failure to remember decision processes. Knowledge about decisions disappears once the decision maker moves on, leaving a new generation to figure out the causes of success (and failure) all over again.

    The evidence of the forgetting of history abounds at companies like Sony and Microsoft which seem to be behaving exactly opposite to how they once did. Sony, once a serial disruptor, turned into a sustainer. Microsoft who pioneered software as a business, cannot find new business models for software.

    Apple's decisions and outcomes are the stuff of legend. They famously act asymmetrically to what is "conventional wisdom". Wisdom imparted supposedly through business schools but systematically contradicted by Apple's principles:

    • Accountability without control
    • Lack of "P&L responsibility" for top management
    • Saying no to "better things"
    • Building products before markets are identified
    • Functional vs. hierarchical or divisional organzation
    • A disregard for polite consensus

    So if this type of decision process is not codified, how is it going to persevere when convention dictates otherwise?

    If the article is correct and there is an effort under way to codify and teach new generations "the Apple way" then the case for Apple being Jobsian grows a lot stronger.

  10. Subscribe to Asymco One for full access to our research.

  11. Staying Hungry

    Research · 47 comments

    During the June 2005 Stanford University commencement speech Steve Jobs famously cited the farewell message placed on the back cover of the 1974 edition of The Whole Earth Catalog: "Stay hungry, stay foolish."

    That's a nice, pithy statement. I interpreted "Being Foolish" in a Quora answer as "being naive about how things should be and thus allowing oneself to see how things could be."

    But what about staying hungry?

    A clue comes from the recent Fortune article "Inside Apple" (currently only available in print or as an app). Even with nearly $70 billion in liquidity Steve Jobs claims "Apple is a company that doesn't have the most resources." A former executive claims "We've always fought for resources...Steve and Tim in general want to be sure you need what you're asking for."

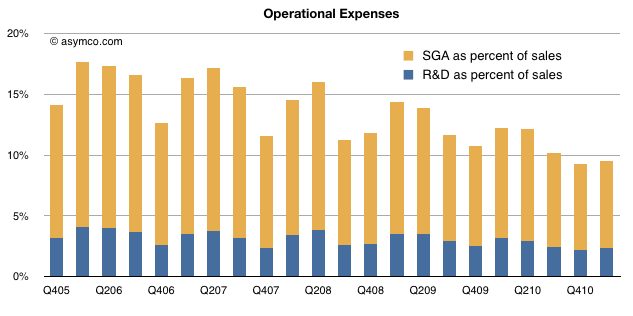
    Note that "resources" here does not mean capital. It means people. Apple is very constrained in the number of people it has available to put on projects. The evidence is in the company's operational expenses. They make up only 9.5% of sales (nearly an all time low). R&D in particular is only 2.4% of sales ($581 million).

    Although R&D doubled in three years sales nearly double every year.

    Looking at the totals over the last full year, the company spent about $2 billion on R&D. A remarkably efficient way to generate $47 billion in sales or $13.3b in operating income. Another way of thinking about it is that every dollar spent in engineering resulted in $23 in sales.

    So the way to interpret the "stay hungry" metaphor is as a low cost structure. It has great advantages beside efficiency. There is a constant demand for focus and justification of spending. There is a certain level of cross-fertilization as people are assigned to varying projects to maximize their utilization. Finally, there are the subtle but powerful influences of hunger: motivation, invention and intense attention to details.

    For Apple this aphorism seems to be more than a motivational poster quote.

  12. Subscribe to Asymco One for full access to our research.

  13. Phone Tipping Point Countdown Reset

    Research · 23 comments

    comScore's latest survey data is in and the news is good.

    In March an additional 3 million Americans became smartphone users. That translates to 700,000 every week or 100,000 every day switching from a non-smart or feature phone to a smartphone.

    The smartphone is now in use by 31% of the phone users in the US. A year ago 80% of Americans did not use a smartphone. Today non-consumption is down to 69%.

    It also means that only 19% more penetration remains before half of the population is using smartphones and that penetration is increasing at an average of 1.3% per month.

    I reset my Phone Tipping Point countdown clock to reflect the new data.

    I call it the Phone Tipping Point because it's the moment when I expect we'll stop using the word "smartphone".

    It's nearly one year away.

  14. Subscribe to Asymco One for full access to our research.

  15. Feature Tablets

    Research · 48 comments

    Andrian Georgiev, a reporter from the Bulgarian business newspaper "Capital weekly" wrote an article for which he asked me some questions. My answers are below. The article is available here (Bulgarian).
    Q: How many tablets will be sold worldwide this year and in 2012?
    A: We can only guess the answer. The total will be constrained by parts shortages for 2011, but my estimate [through the end of 2012] is over 100 million. Perhaps even 120 million is possible.

    Q: Do you think Amazon is working on a tablet? Could it be a game-changer?
    A: If Amazon (or Facebook or Baidu) were to build a tablet the greatest innovation will be in their business models. In other words how they make money. I suspect Amazon's hardware will be free or nearly free but users will be incentivized to buy content or other goods from Amazon. Similarly for other businesses that will take a hardware product and make it an accessory to their core business. In that regard the "game will change" because hardware will conform to "the application" above it. In other words, that the device will be an accessory to the service, not the other way around.

    Q: Why is it so hard for manufacturers to create a tablet that rivals iPad?
    A: The iPad is a collection of components. Some are easy to duplicate or to source. This includes memory, microprocessors, communications components. Other components are harder to find and may be expensive once found. This includes the right kind of batteries and the screen. Yet other components are impossible to find or duplicate. That includes software.

    --

    Some additional thoughts:

    The changing of the game may not happen for some time. "Feature tablets" (analogous to feature phones) will however be viable as niche businesses quite soon. I believe "conforming" operating systems will be more popular with tablet makers than with phone makers.

  16. Subscribe to Asymco One for full access to our research.

  17. The trouble with halos

    Research · 45 comments

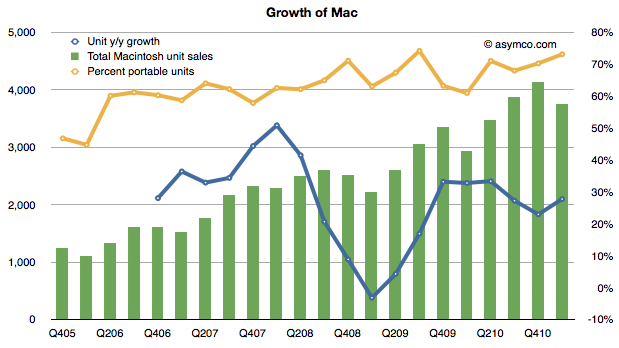
    The Mac grew at 28% while the overall PC market contracted at 3%. The Mac has outperformed the PC market overall for 20 consecutive quarters.

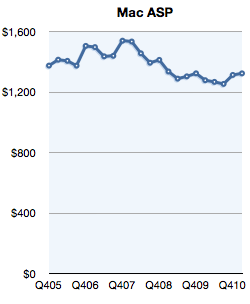
    Prices increased sequentially and year-to-year.

    I've mentioned the increasing shift of Mac mix to portables as a possible reason for the growth of the business. The Mac was one of the first to move to a portable form factor and has been pushing portability over performance for many years.

    The following chart shows the relationship between growth and portable mix:

    The trouble is that mix is not enough to explain the increasing gap with the rest of the PC industry. Windows PCs have also embraced portability and have even run down the path of over-serving portability with the netbook.

    Clearly something else must also be at work. This was even noted by Apple's COO Tim Cook in the last conference call in response to question on the effect of iPhone growth on the Mac:

    [iPhone] clearly seems to be creating a halo effect for the Mac. And I think that's one reason we see the growth that we are seeing on the Mac. It's amazing when you see the 28% year-over-year versus the worldwide market in PCs contracting by 3 points. It's an astonishing delta.

    The delta has been there for a while but it's widening and it's persistent.

    I've never been comfortable with the halo effect. Not because it's not happening but because we don't have a way to measure it. I've never seen reliable data that establishes a causal link. Lots of anecdote but little proof.

    The other problem with halo is that it implies illusion and hence impermanence. The halo effect is a cognitive bias which can mislead. An example would be judging a good-looking person as more intelligent.

    This effect is often exploited in marketing. It's quite common in the automotive industry where halo vehicles (e.g. Ford GT 40 or Dodge Viper) are created which promote sales for the entire brand even though they may lose money. These efforts often fail or have temporary benefits at best.

    When it's deliberate and an attempt to prop up something unworthy it seems deceptive, dangerous and temporary (buyers may be disappointed when they buy a Ford or Dodge and realize that they are not supercars and a reverse halo effect can emerge.)

    A halo effect should be used to boost a product that is under-rated not badly rated. This is when the effect creates benefit over a long period of time like the five years over which the Mac has over-performed.

  18. Subscribe to Asymco One for full access to our research.

  19. Combating superlatives fatigue

    Research · 18 comments

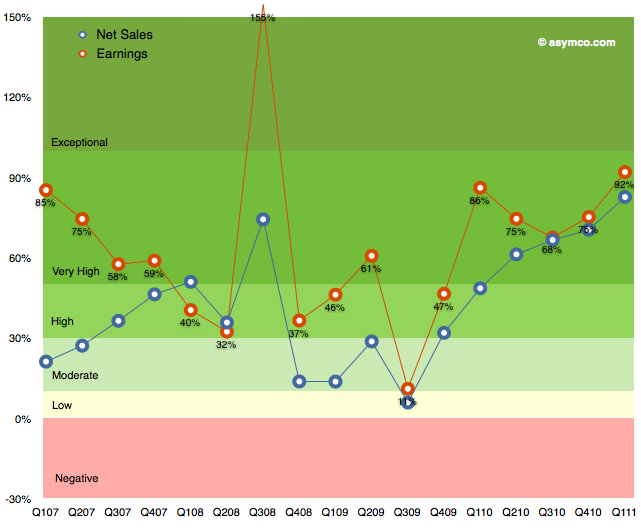
    The following chart shows Apple's growth for net sales and earnings over the last few years. I've used a grading system with color coding to show bands of growth.

    It's easy to become de-sensitized to the scope of these numbers, but it bears repeating: the growth has been steadily increasing since 2009.

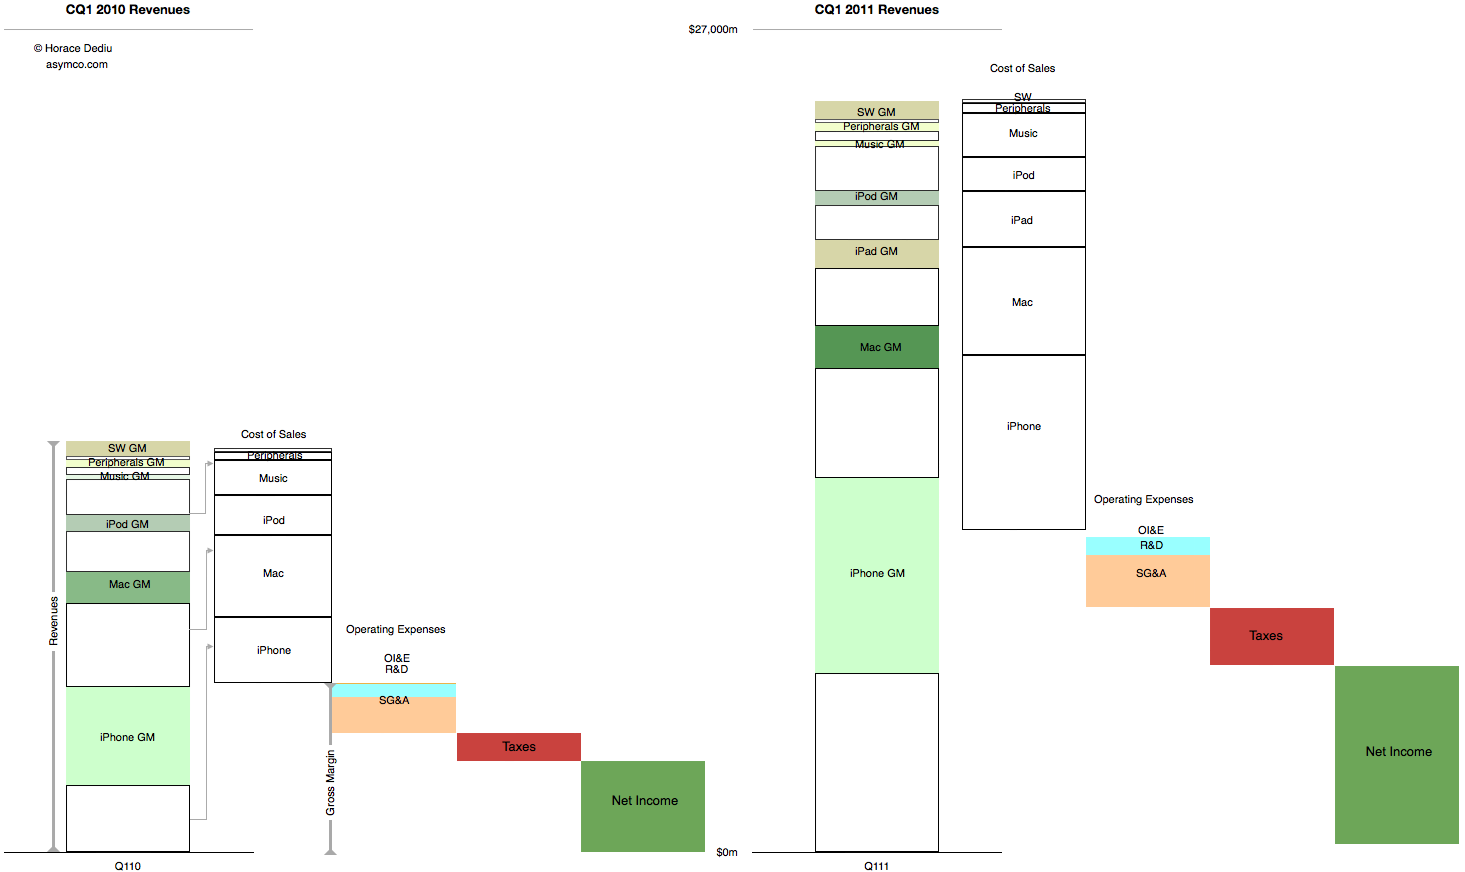
    These abstractions in growth can also be shown in a direct "before-and-after" view of the income statement.

    This latter view gives an idea of how much bigger the company's business is now vs. a year ago. Not just on the revenues but also the cost of these revenues and what is retained.

    This story never gets old.

  20. Subscribe to Asymco One for full access to our research.

  21. Windows generates less than a third the profit of iOS + OS X

    Research · 35 comments

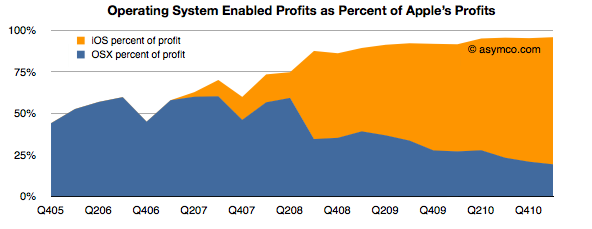
    While a lot of the credit for Apple's success is rightfully assigned to the iOS franchises, the OS X business has more than quadrupled in five years. This has happened without drastic price fluctuations. Neither holds for the overall PC industry which has seen both volume and sales decline while prices have eroded along with profitability. On top of that, growth has nearly evaporated.

    Even with this success, as a percent of total value created, the Mac accounts for a mere 13% of Apple's profit. Including software as part of the OS X franchise implies that OS X is enabling about 20% of Apple's profits.

    iOS, on the other hand, is accounting for more than 75%. These two platforms combined amount to 96% of Apple's profits (up from 50% four years ago).

    That's $9.8 billion from integrated platform-based devices. One can be very confident that this profit would be negligible without the software differentiation only Apple can offer.

    So $10 billion is a lot of profit to obtain from a business enabled by operating system platform software. How can we get a handle on this size? How big is this? We could compare this with another operating system business: Microsoft Windows.

    Microsoft's Windows and Windows Live Division obtained sales of $4.445 billion in the last quarter with an operating income of $2.764 billion.

    So although Windows earned about twice what the Mac earned[1], iOS and OS X together enable 3.5 times the profits of Windows.

    The end of an era is the end of growth in one dominant business model. The PC era was epitomized by the concentration of profits in a dominant operating system vendor. That growth has slowed if not ended. The post-PC era is being kicked off by a new business model where profits are being concentrated in a hardware+software+service integrator.

    --

    1. Or you could read this as: The Mac generates half the profits of Windows while iOS devices generate 2.3x Windows profits.