A review of the Apple Store international roll-out process; a preview of an analysis of Apple's innovation culture as described by Tim Cook; a reflection on the sustainability of growth: personal, institutional and societal.
A short interview for iCon where I'll be presenting tomorrow. The interview originally took place on January 9th, 2013.
Jasna Sykorova: You have focused on mobile devices for some time now. What made you to start to give a special attention to Apple related data?
I began to look at Apple in 2005; long before they were in the phone market. I had an iPod and liked the Mac but I did not have particular reason to think about the company. You might find it strange that it was the launch of two very peculiar products that caused me to change my perception of the company. They were the iPod Shuffle and the Mac mini.
These are not seen as important today nor were they back then. But they signaled to me that something dramatic was happening: the company was shedding its "premium" image. This and the earlier move of iTunes to Windows signaled [to me] that Apple was serious about the mass market and the minimum price that a person would need to pay to become an Apple owner.
This was pivotal to me also from the point of view of disruption theory. If a company takes the fight to the low end it means it protects itself from a low end disruptor and may even enter new markets. So if the thinking is that Apple would disrupt then it would have to get into new categories. I then asked myself what it would target. I told myself (again, in 2005) that Apple will do three things:
build a phone
disrupt the PC market
enter the living room.
1 and 2 are well understood to have happened and 3 is nearly here with Apple TV.
Each of these were tremendous opportunities and it's been fun watching it happen over the last 7 years.
By the way, my expectations were right not because of any insight into the company. I had not studied Apple much at the time. All my expectations came from understanding the psychology of a disruptor. Nor does it mean that what Apple did was deliberately planned. It's possible to predict what people will do even if they don't know what they will do themselves.
Can data tell stories? Can you judge just by data?
Data tells amazing stories but not without an interpreter. Having data without a storyteller is like the tree falling in the forest and nobody being there to hear it. If the data's story is not interpreted then does the story actually exist? Did the data "make a noise"? It's a question for philosophers.
Practically, it's important not to base decision making on data alone. Data only exists about the past. Clay Christensen blames God for making us suffer in this cruel way. The past sometimes reveals patterns that help us predict the future, but it's hard to see some patterns. You may need to look at long time frames and there's never enough data. What is more helpful is to have a theory.
Science works this way. Data helps build a model and the model helps build a theory and that theory is tested over time and adjusted. Unfortunately, we don't have very good theories about how businesses should be run. I used to say that if Business Management was a science it would be like medicine in the Middle Ages: mostly superstition and faith in the powers of individuals. [We need to move forward from this.] That's what I'm doing with my work: trying to build and test management theories. The data is just the first step on that road.
What is the difference between Apple in the time of Steve Jobs and Apple now?
Steve Jobs was a very important influence in the DNA of Apple. I think his influence was so deep that it existed even when he was not there in the 90s and I think it exists to this day. The influence is in the priorities, values and culture of the company. These influences exist in all companies and are very hard to change. They are almost never put in writing or even discussed. They are dogma, constitutions or doctrine by other names.
Processes and assets may change however. I think decision processes will change at Apple. I suspect there will be more discipline in that regard and more rational ways of doing things. That could be good or that could be bad. But the passion to be great will not change. That's what the brand speaks to each employee. They are there because they want to be part of that greatness.
You will speak about Apple's strategy for enterprises at the iCon. Do you consider it a “new wave” of activities of Apple? What chance does it have against the strong corporate players like Dell? And what benefit can iPad have for a company, if any?
If you look at my list from 2005 you don't see Enterprise on there. I think it might have joined the list since then. But it's not obvious yet. The thing is that Apple's approach to Enterprise will not be typical. It will be disruptive. It will be subtle and "easily ignored". This is what I want to discuss. The incumbents are not noticing Apple even as they are losing significant value to Apple in their core markets.
Analysts (and consultants) find all kinds of reasons to downplay Apple's efforts and comfort the organizations who hire them [which is why the approach is generally unfelt]. Also IT is changing in the jobs it's hired to do. These are all good signs that something is happening. Something that will become very quickly a fait accompli.
Yesterday Tim Cook spoke at the the 2013 Goldman Sachs conference:
There's no better place to discover, explore and learn about our products than in retail. It's the retail experience where you walk in and you instantly realize this store is not here for the purpose of selling. It's here for the purpose of serving. I’m not even sure “store” is the right word anymore. They’ve taken on a role much broader than that. They are the face of Apple for almost all of our customers
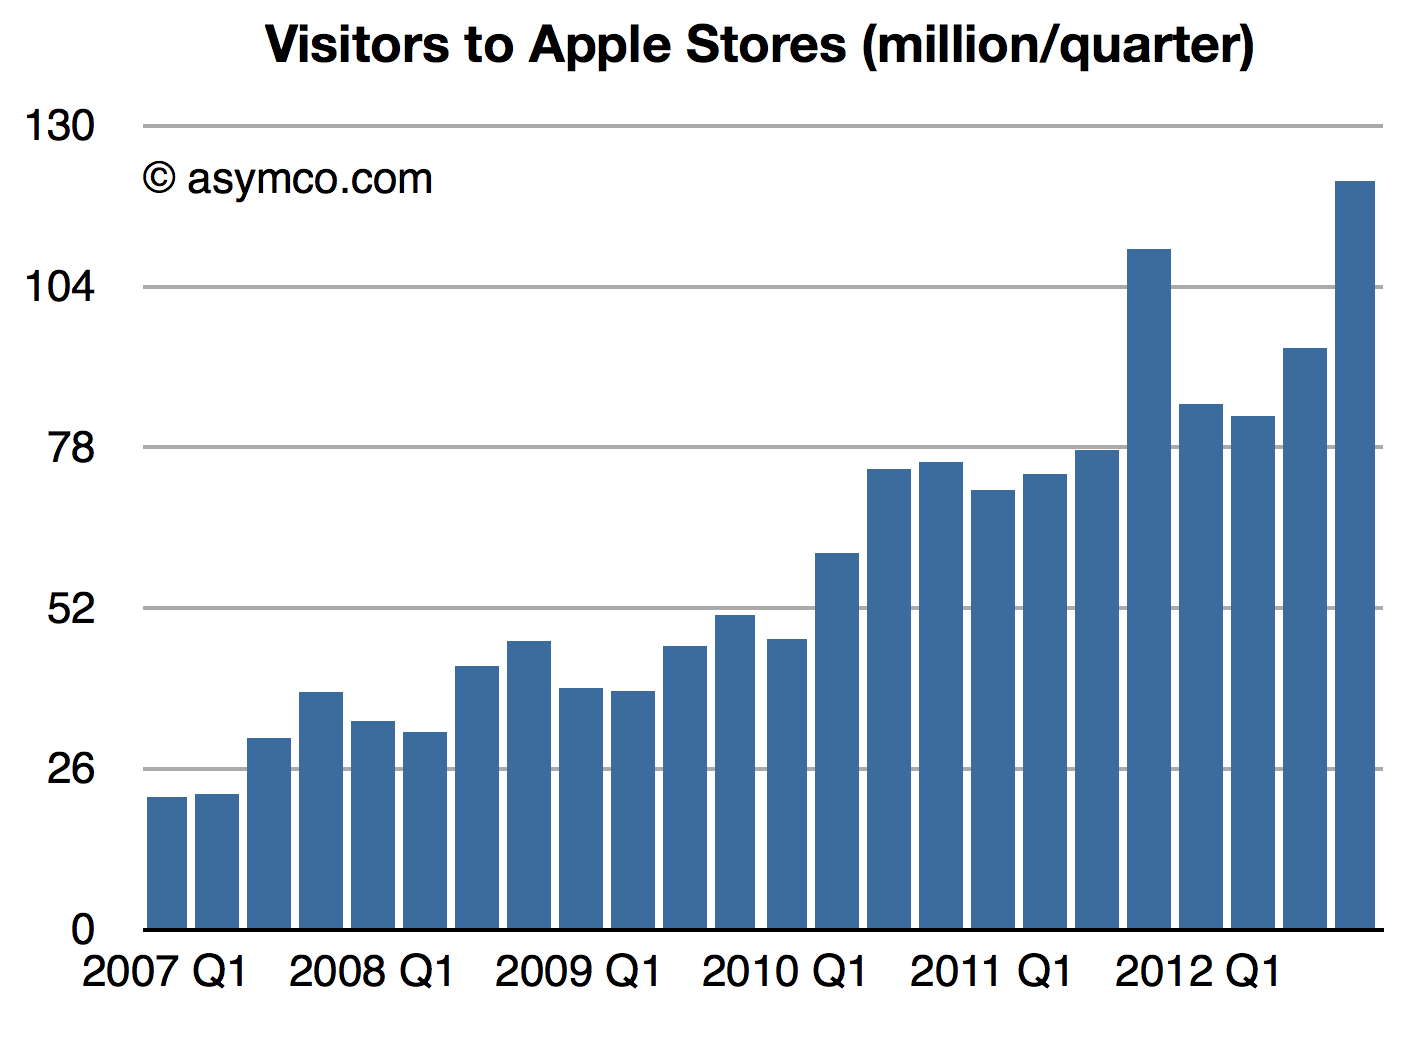
Last quarter, we welcomed 120 million people in our stores.
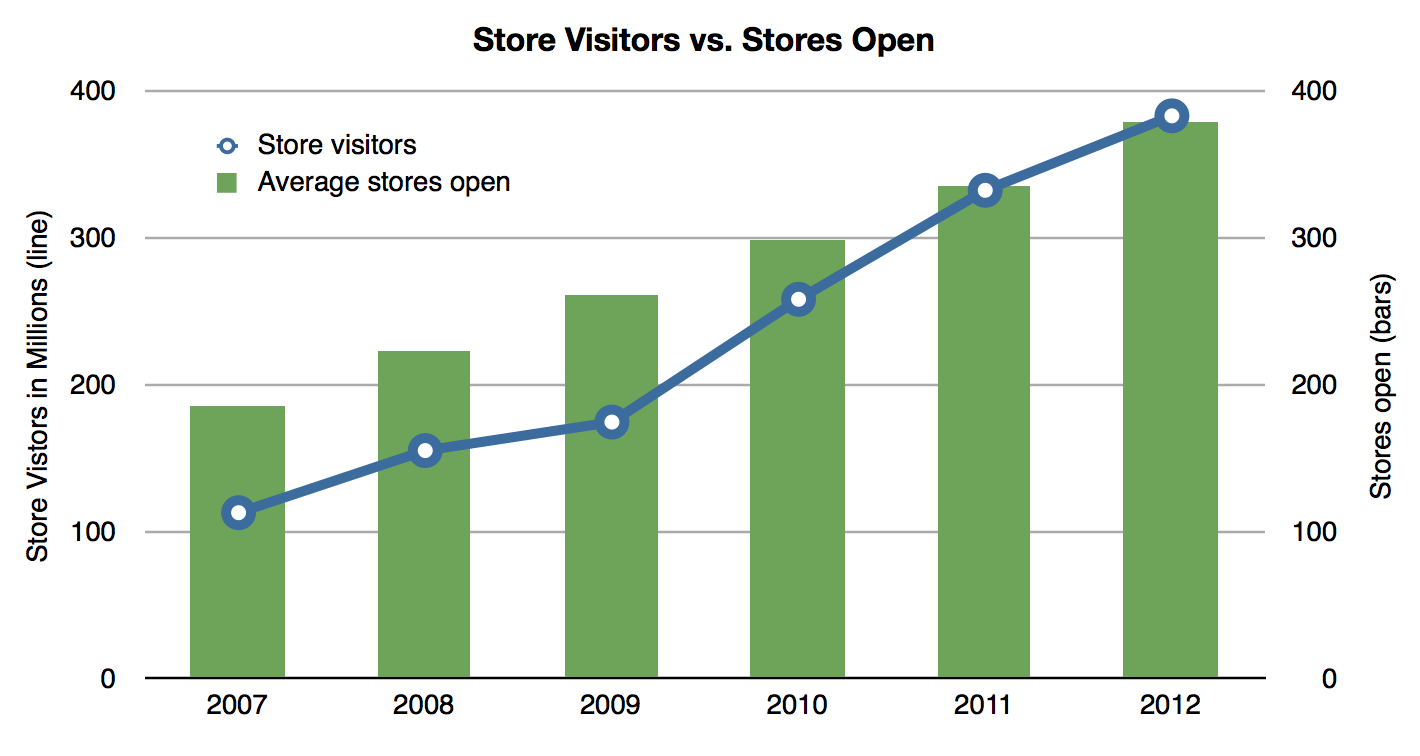
We only have a little over 400 [stores]. Last year, we welcomed 370 million into the stores.
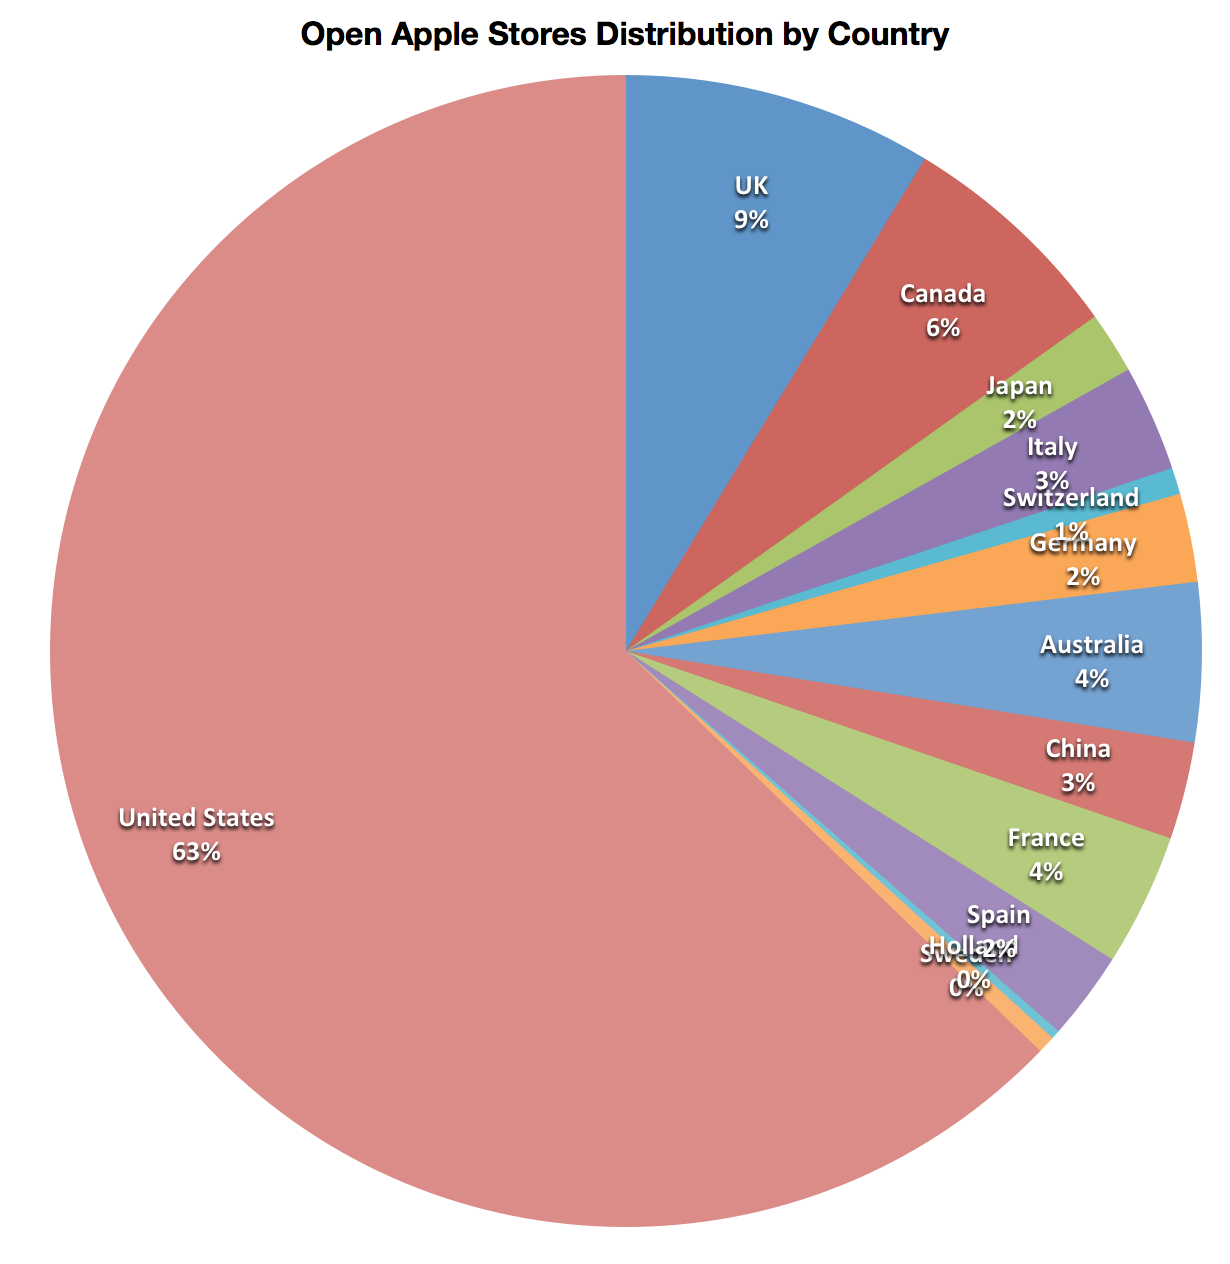
We're closing 20 of our stores and moving them and making them larger this year. And in addition to that 20, we're adding 30 more. Those 30 will be disproportionally outside the U.S. That gets us in 13 countries.
And so I'm incredibly bullish on the stores. We're going to continue to invest like crazy in them.
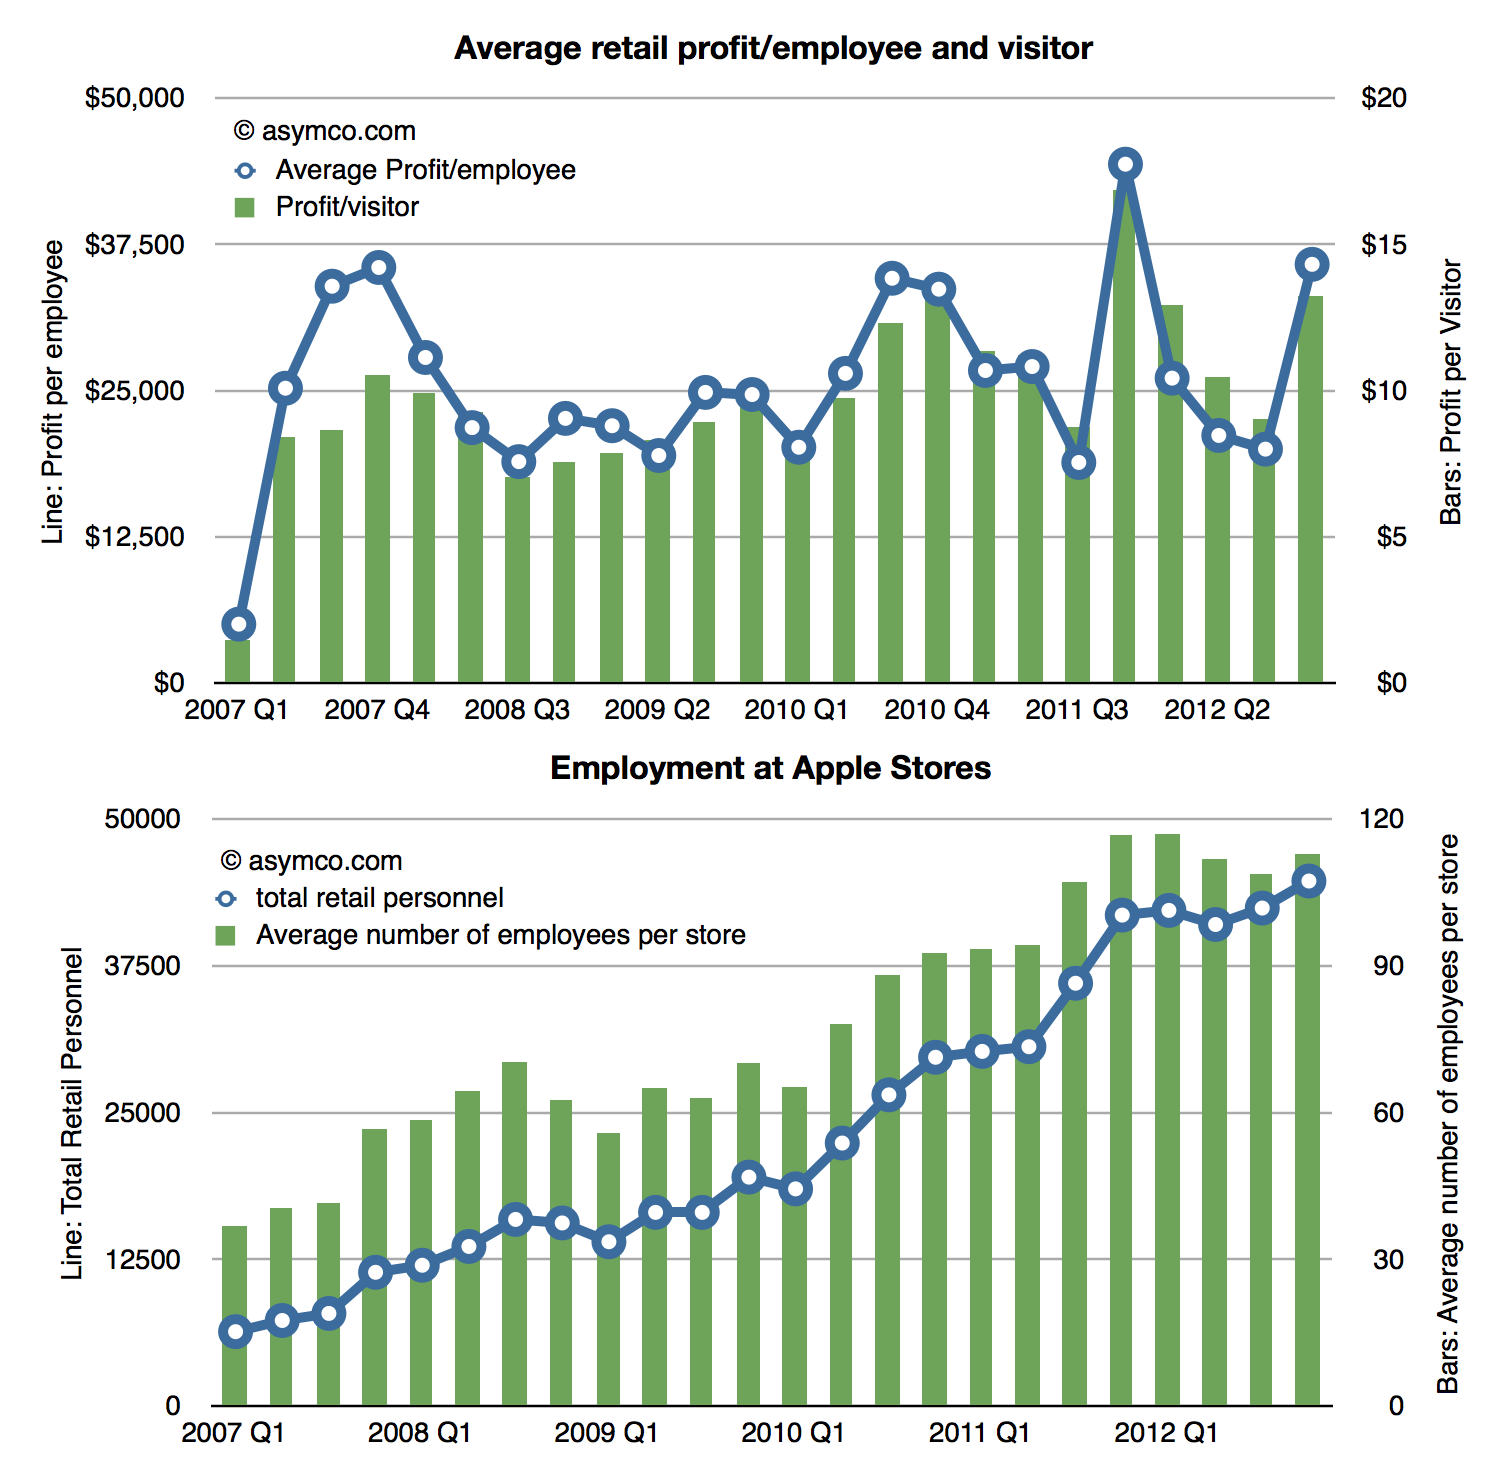
Our team members are the best in the world. And the financial results are great.
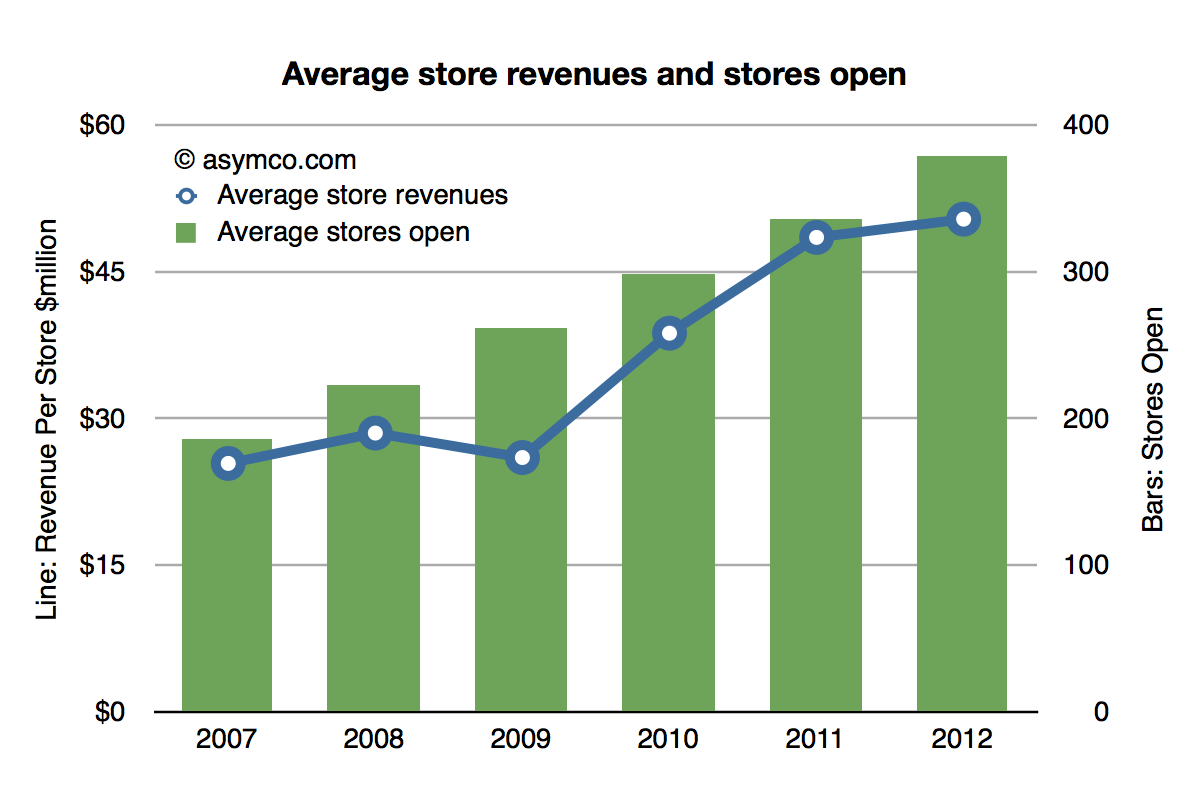
Average store last year was over $50 million in revenue.
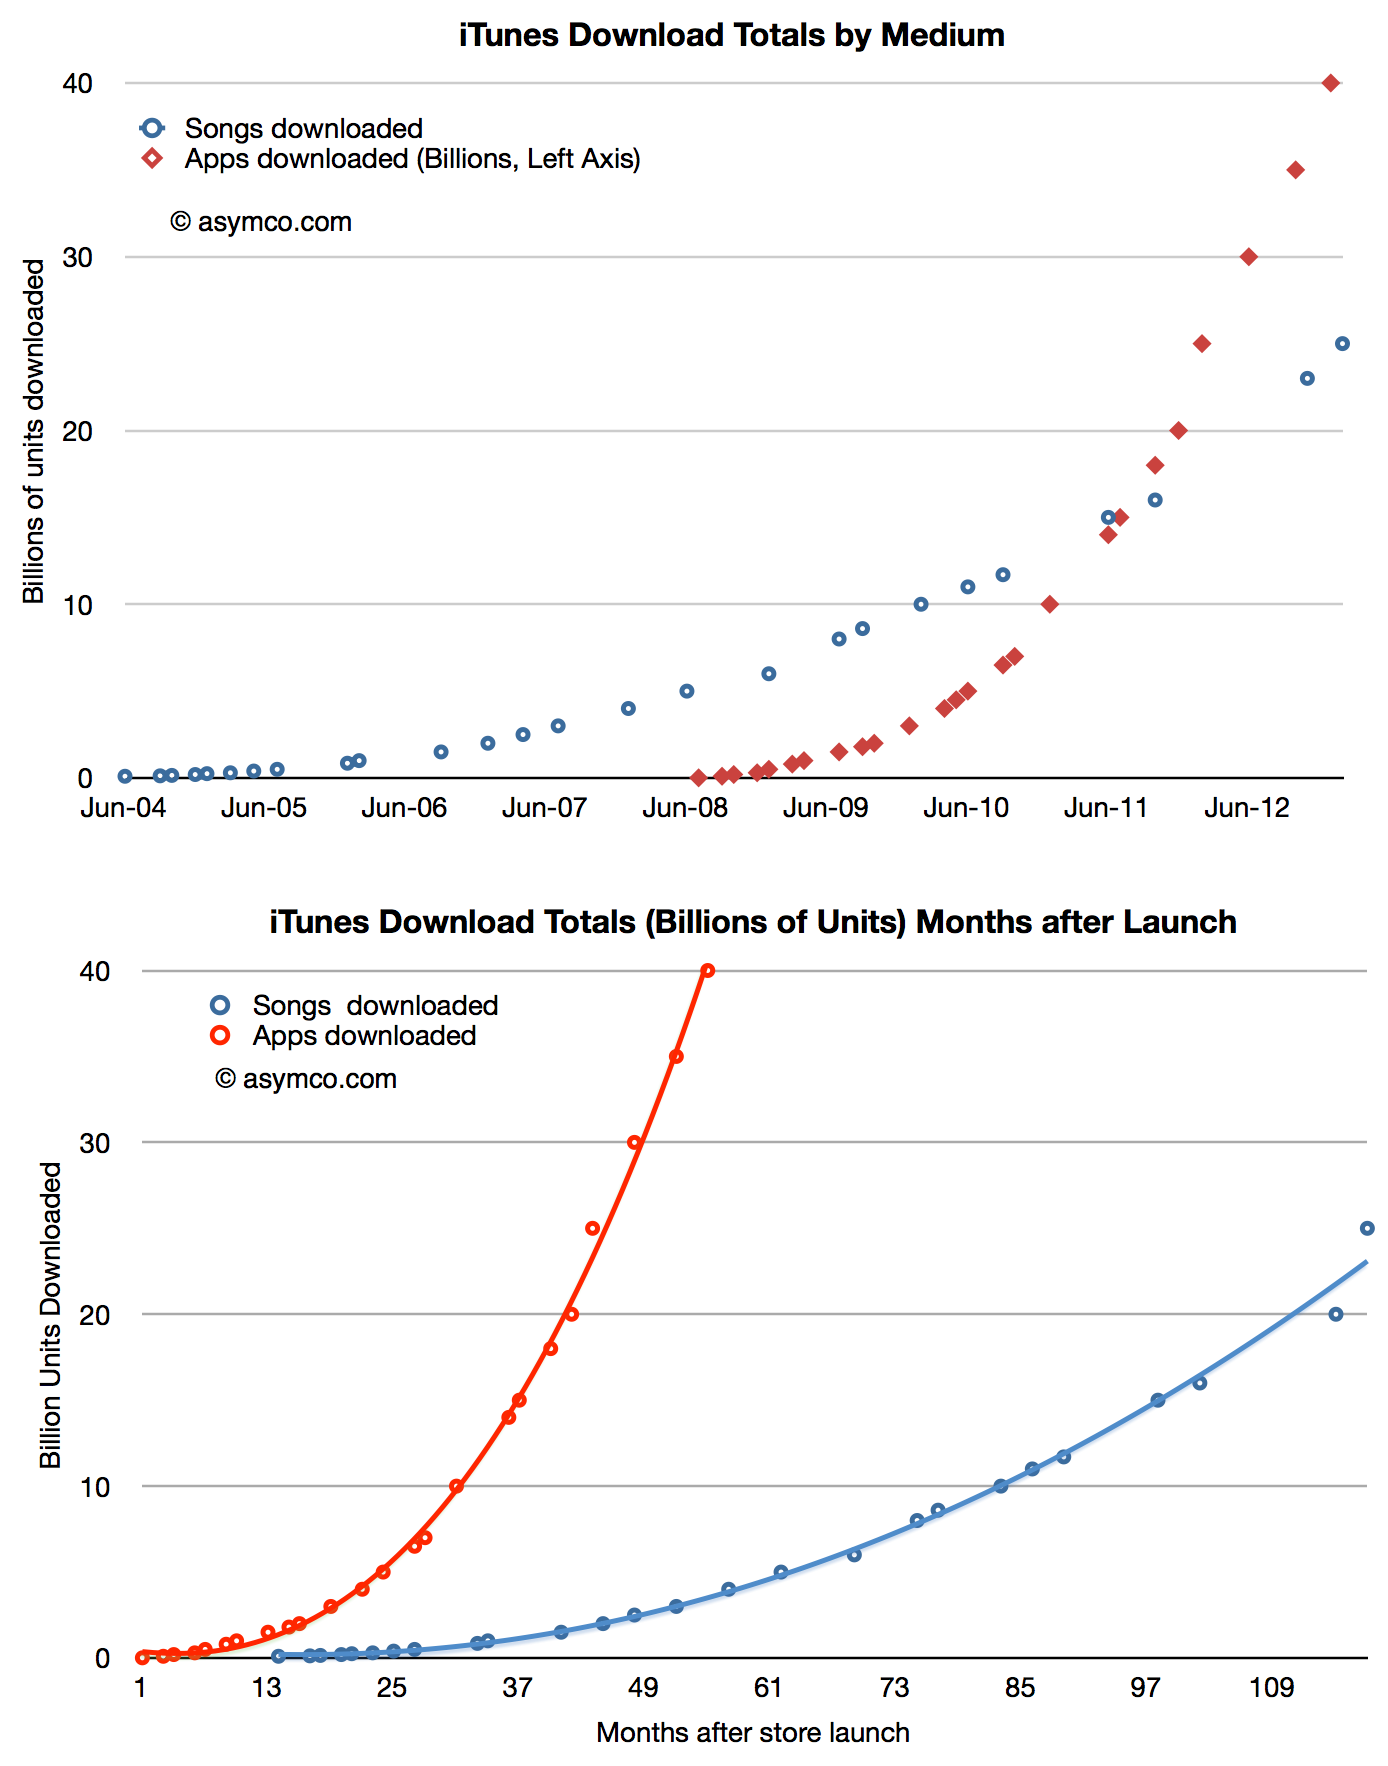
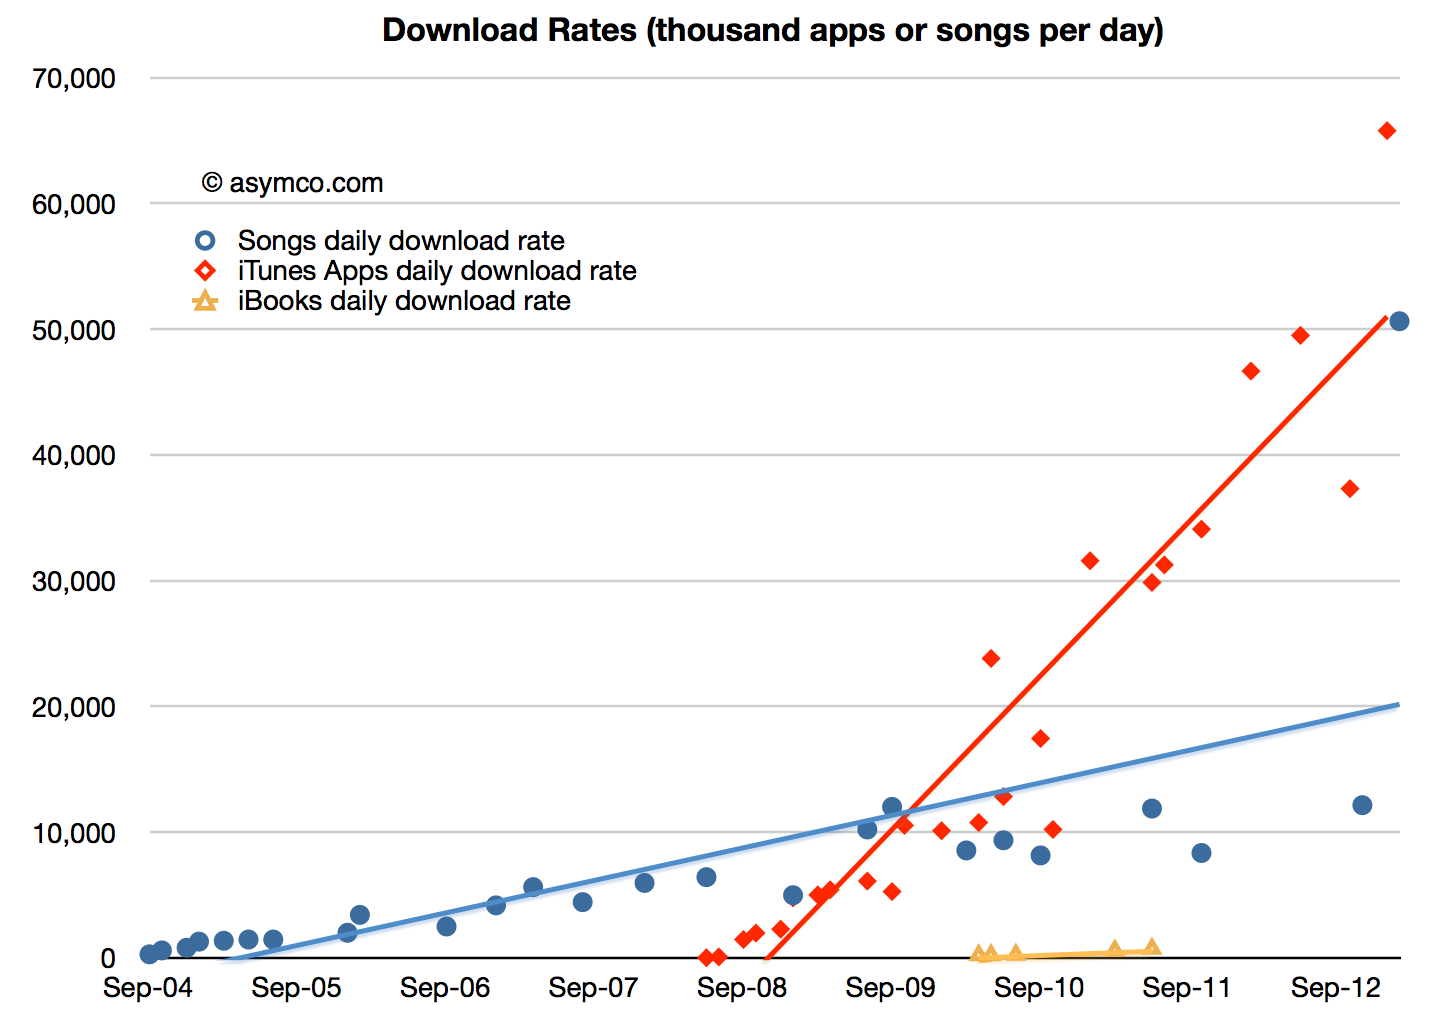
On February 6th, 2013 Apple reported that a total of 25 billion songs had been downloaded from its iTunes music store. The previous definitive value was in October 2011 though there was mention of "more than 20 billion" in November. App download totals have recently been much more frequently updated as the following chart shows:
[I estimated 21 billion for the November total.]
The latest two data points point to a surge in iTunes song download rates. Prior to last fall the download rate seemed to be hovering around 10 million songs per day.
The new data implies that the rate may be now perhaps 20 million per day however I would be cautious about this estimate given the latest point being such an outlier. One reason for the surge might be the opening of new stores in previously unserved countries. Another could be the usual post-holiday surge driven by gift cards.
Given this data, it would be interesting to calculate the share of overall music downloads that iTunes has been able to secure.
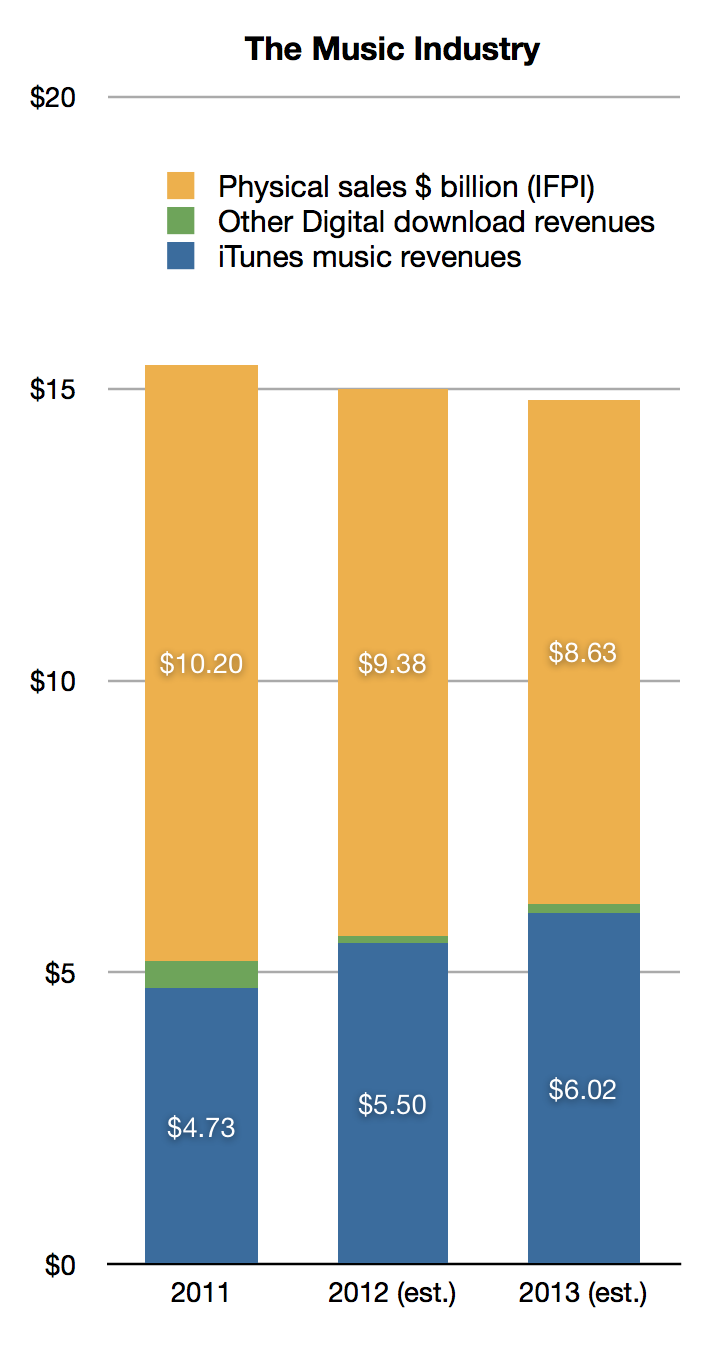
Based on the samples offered by Apple, and the data from International Federation of the Phonographic Industry (IFPI) we can estimate that in 2011 iTunes captured 90% of digital music revenues and 31% of the total music industry. (I estimate iTunes was responsible for about 4.3 billion downloads and I applied a price per download of $1.1).
Looking to 2012, applying a growth rate of 8% to digital sales (same as that of 2011) and an 8% decline in the physical business (vs. 8.7% decline for 2011) we get 98% iTunes share for digital and 37% share for all music. (I estimate that iTunes was responsible for about 5 billion downloads and I applied a price per download of $1.1).
Therefore it seems reasonable to estimate that Apple will reach 97% share for iTunes music in 2013. That assumes a 10% growth in the music download business and translates into 5.5 billion downloads or about 15 million songs per day. That's well within the trajectory seen above.
These data result in the following market overview:
As Apple introduced a new set of revenue categories, the performance of its "minor" businesses has become clearer. The changes include re-statement of what used to be called "Software" revenues as part of iTunes. Apple Software includes sales of OS X, iWork and its pro tools. These products are now sold through the Mac App and since that is a part of iTunes its inclusion makes sense.
However, we have to understand that iTunes now is a blend of many business models. Some, like music, use a wholesale revenue recognition method and have very low to zero margins, others, like eBooks and Apps, are sold using an "agency" revenue model with potentially higher margins and some, like Software, are recognized at full value with very high margins.
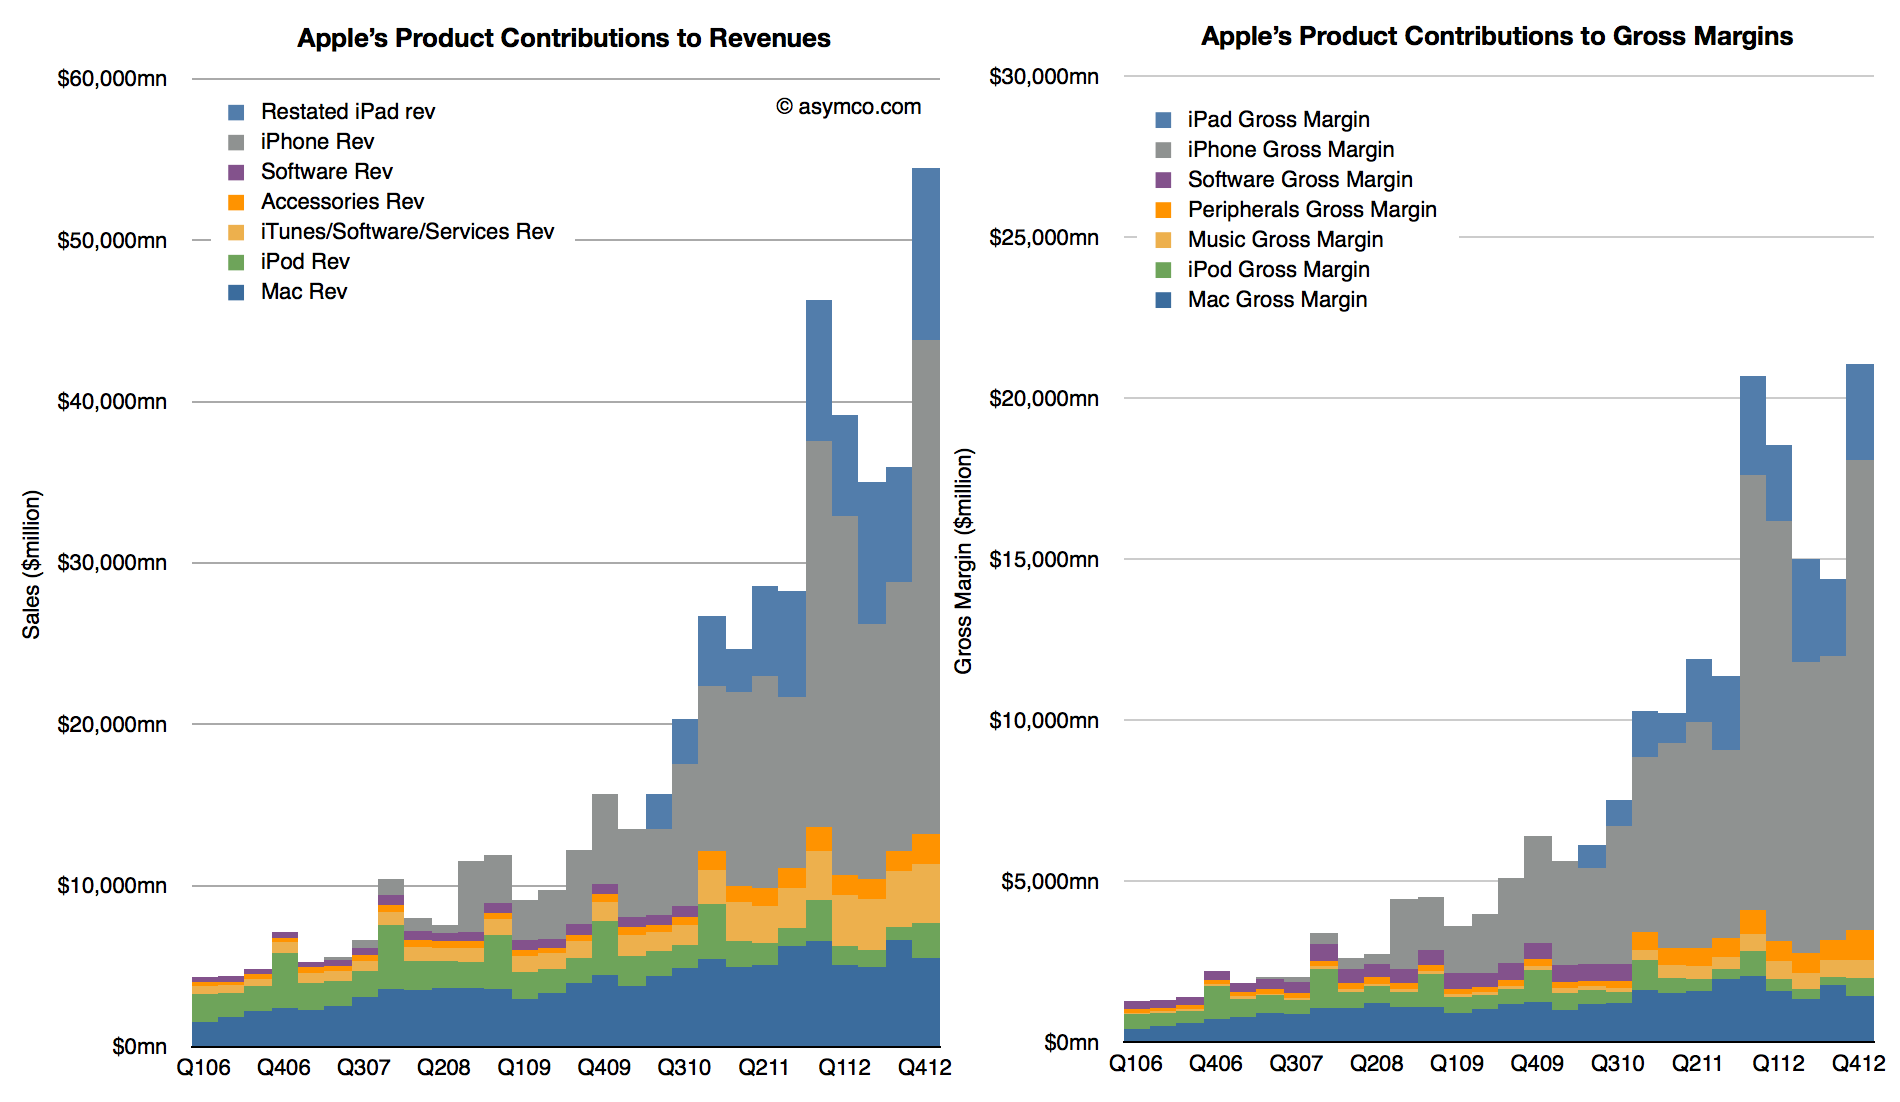
When re-stated this way, iTunes becomes much more than a "break-even" business. My own estimate for its gross margin as currently reported is between 15% and 17% but it could be even higher. This allows the following picture to emerge:
These graphs show contributions to Revenue and Gross Margins of the various reported product categories. Note that restatements for Accessories and iTunes only extend back to Q4 2010 and the older "Software" is still shown for earlier periods.
Note also that Accessories are now including some of the revenue that used to be reported as part of iPad and iPhone revenues. This was discussed in more detail here.
There are several observations we can make:
iTunes now becomes a steadily and rapidly growing business. Growth over the previous two years averages well over 30% and is consistent across seasons.
The absolute revenue number is substantial: $13.5 billion for 2012 (up from $10.2 billion in 2011).
Assuming a gross margin of 15% to 17% yields contribution of $2 billion in margin in 2012 and $1.6 the year before.
iTunes is now Apple's fourth largest business, having overtaken the iPod in revenues two years ago
iTunes growth relative to the Mac means that it could become the third largest business during this year.
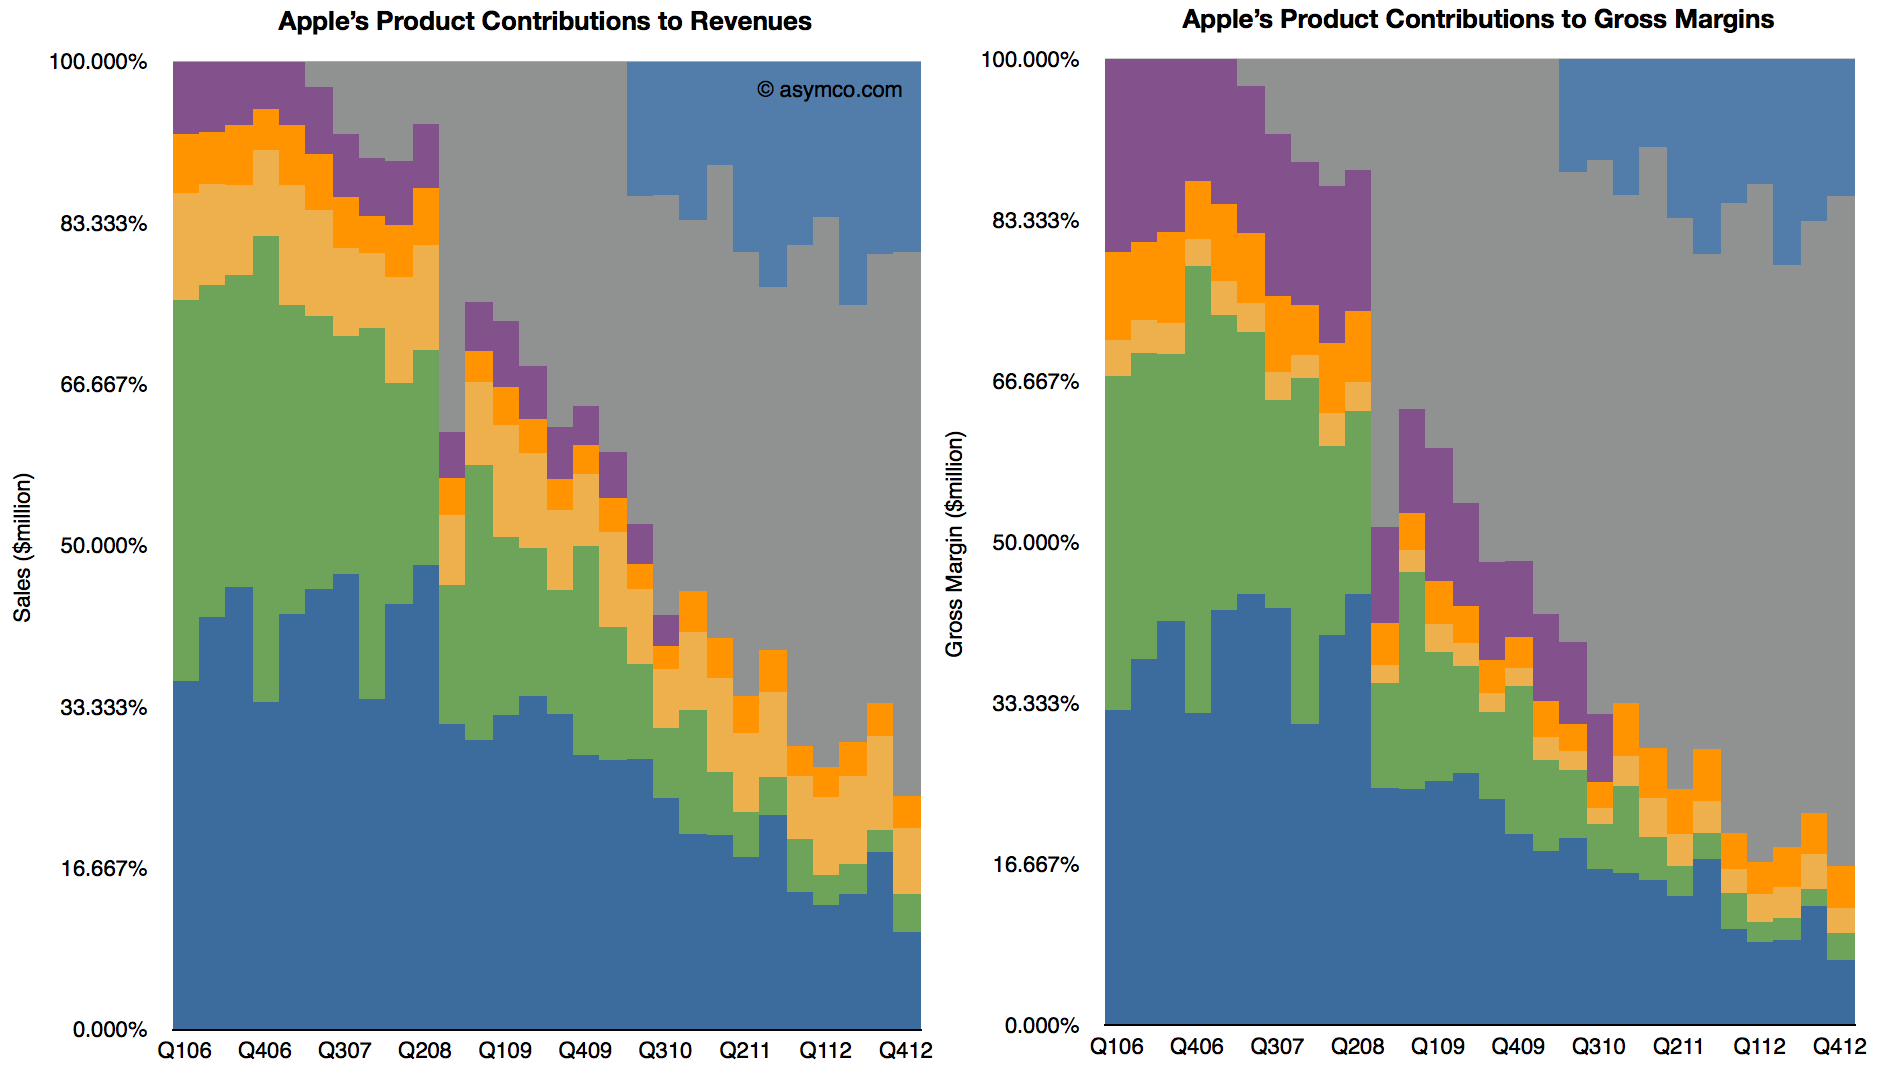
When seen this way, as a percent of total, iTunes begins to look increasingly as a viable "leg stool" upon which Apple rests. Note that in the following charts the percent of total for iTunes holds steady while Mac and iPod decline.
Adding the Accessories business (which includes Apple TV and is showing in Orange above) these "other" businesses are already bigger than the Mac. Of course, content, software, accessories and services depend on a healthy device business, but the size of these ancillaries are beginning to be substantial and Apple's ecosystem may begin to be valued more than just as an incentive to buy the devices.
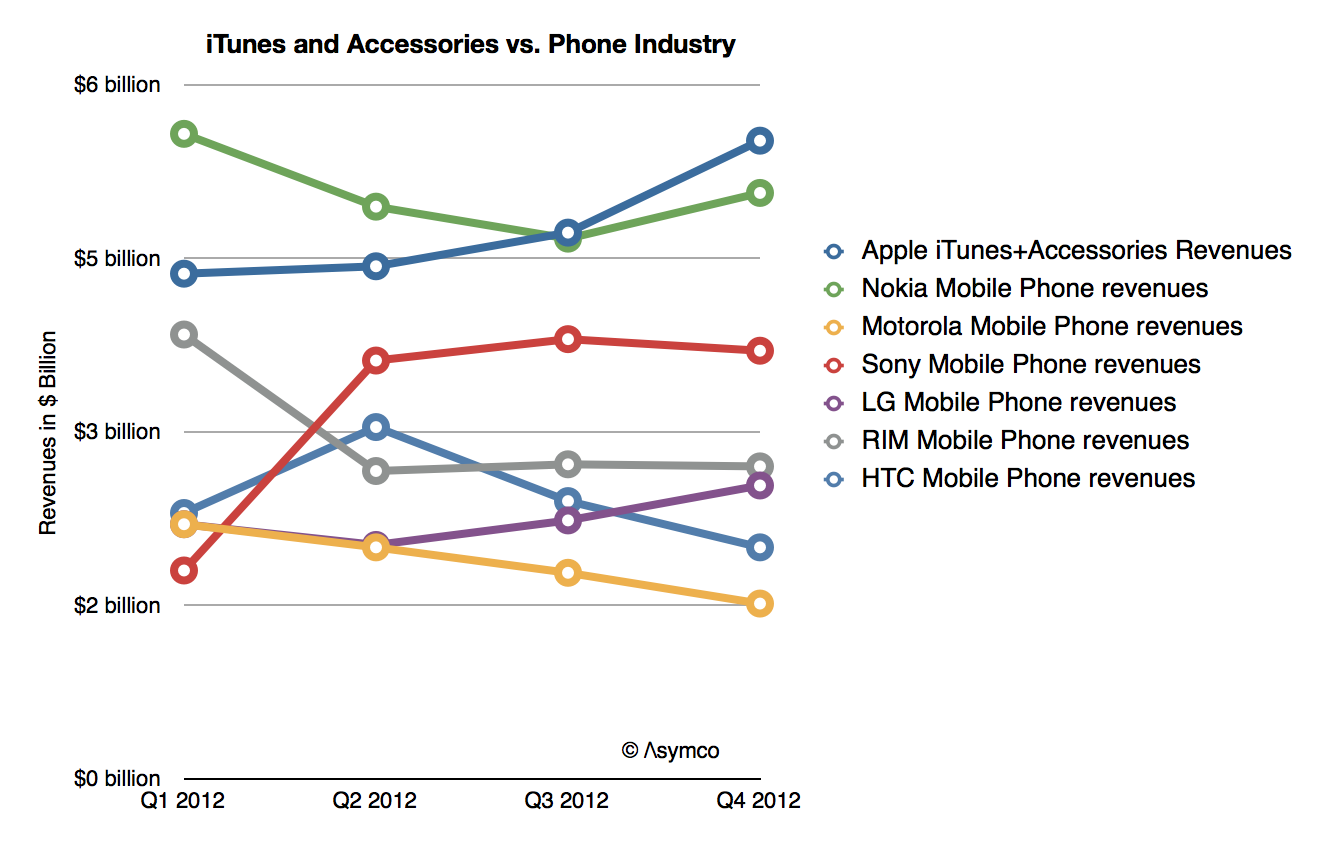
Indeed, if seen in isolation, iTunes+Accessories combined is a bigger business in terms of revenues than any of the other phone vendors except Samsung:
We take on the future of TV again, given the developments and experiments hitting the news. Hanging in the air like a big matzah ball is the question of a catalyst to bring long form video to the age of software. Not just digital production and distribution but an integration of software into the product itself. We get there via a quick recap of Asymconf California.
During the fourth quarter 2012 Apple's margin fell to about 38%, a level not seen since two years earlier and down from a peak of 47% in Q1 2012. Does this lower margin foretell lower prices or a loss of competitiveness?
Obviously not.
Gross margin is a function of Sales (aka revenues) and Cost of Sales. Gross margin as a percent is calculated with the following formula: (Sales-Cost of Sales)/Sales. If dealing with a single product, Sales itself is the product of shipments and price/unit but since cost of sales is also a product of shipments and cost per unit, the shipments numbers cancel each other out and the gross margin reduces to the ratio of (Price-Cost)/Price.
So a margin drop can only be caused if one of three things happened:
Prices dropped
Costs increased
Both prices dropped and costs increased.
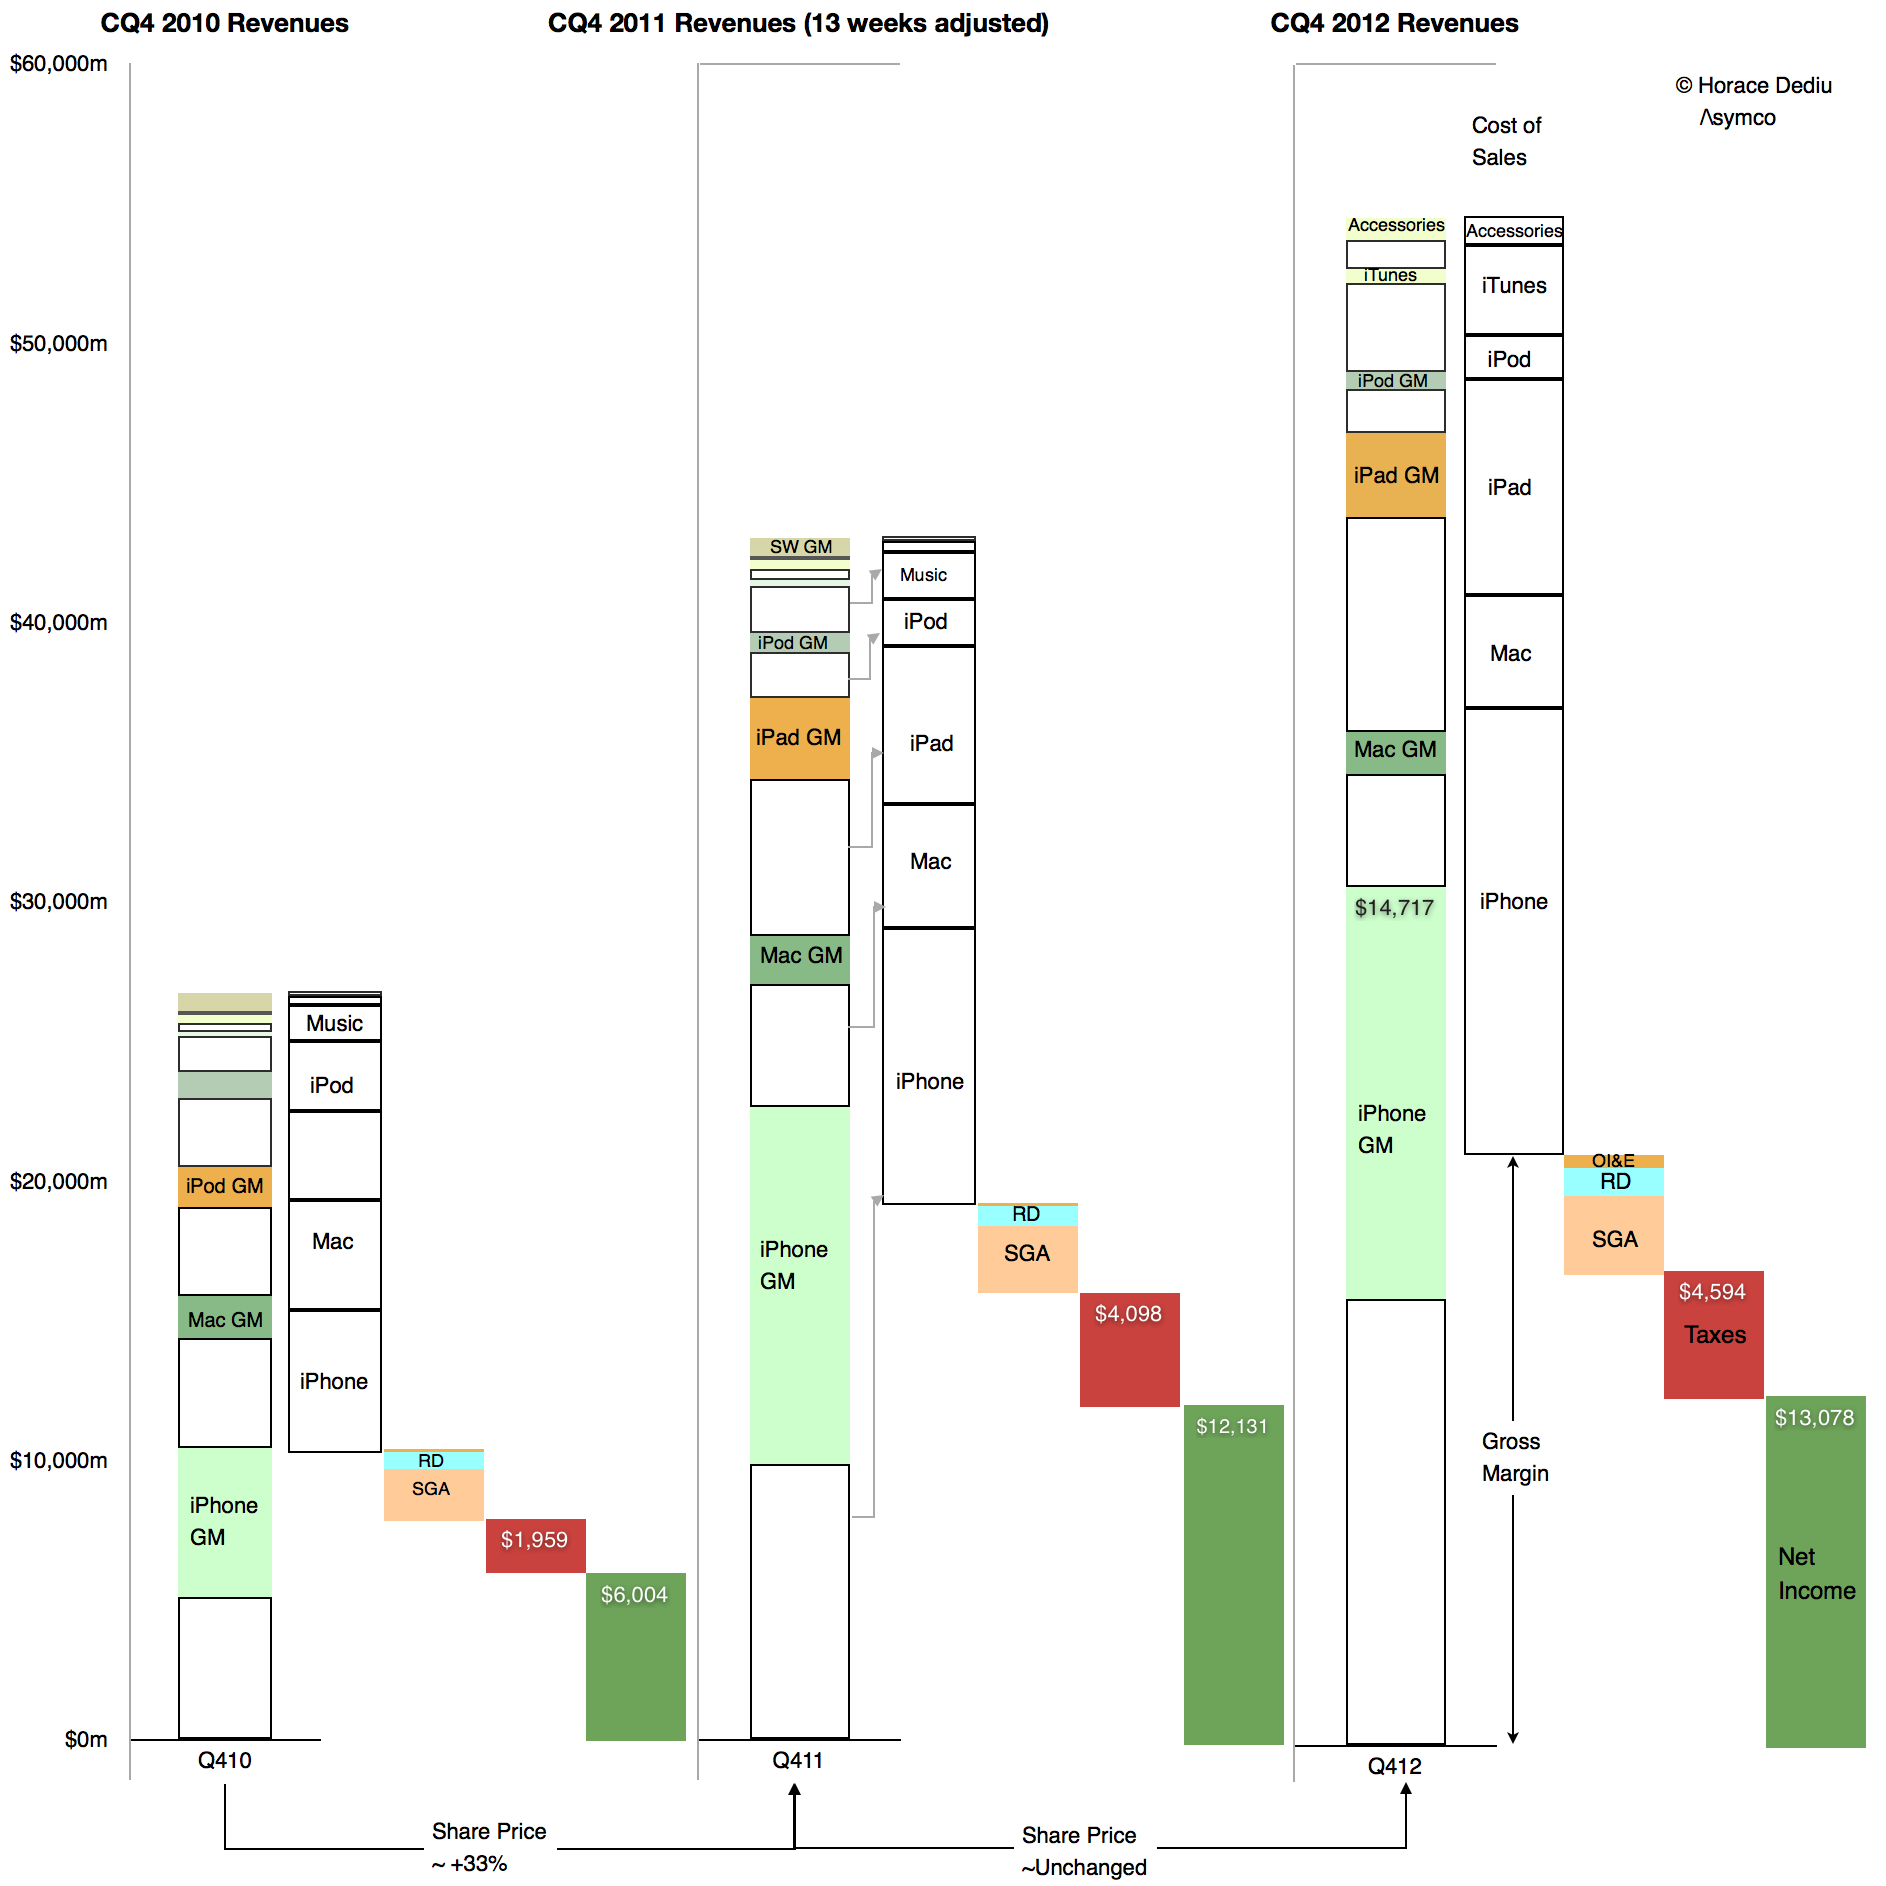
We can easily find out which of these was the cause in the fourth quarter because we have volumes and prices for all of Apple's products. We can also derive total costs based a total gross margin. These are illustrated in the following retina-friendly diagram.
The diagram shows Revenues, cost of Sales, Operating expenses, Taxes and Net Income relative to each other for the fourth quarters of 2010, 2011 and 2012. Of interest is the difference between 2011 and 2012. Note how the 2012 Gross Margin (absolute, not as a percent, identified with the arrow) did not change much from the year before. As Taxes and Operating Expenses did not change much either, the earnings were quite flat y/y.
However note also that total sales increased quite a bit. As the gross margin (absolute) remained steady and sales increased the margin as a percent fell. But the cause is that cost of sales also increased. They increased faster than sales increased.
Relative to adjusted 4th quarter 2011 Sales increased by 27% while Cost of Sales increased by 30.5%. Margins shrank in late 2012 because the products were more expensive to make.
It's simple arithmetic.
We can at a glance see that the cost of sales increased as a proportion of sales. Therefore the margin decreased as a percent of sales. The cause is higher costs, not lower pricing.
In fact, pricing analysis was already performed and showed that they largely held steady (iPad being the only decline). If pricing is unchanged then competitive issues are not to blame. The supposed link between lower margins and some mythical loss of competitiveness can be easily disproved.
But there's more.
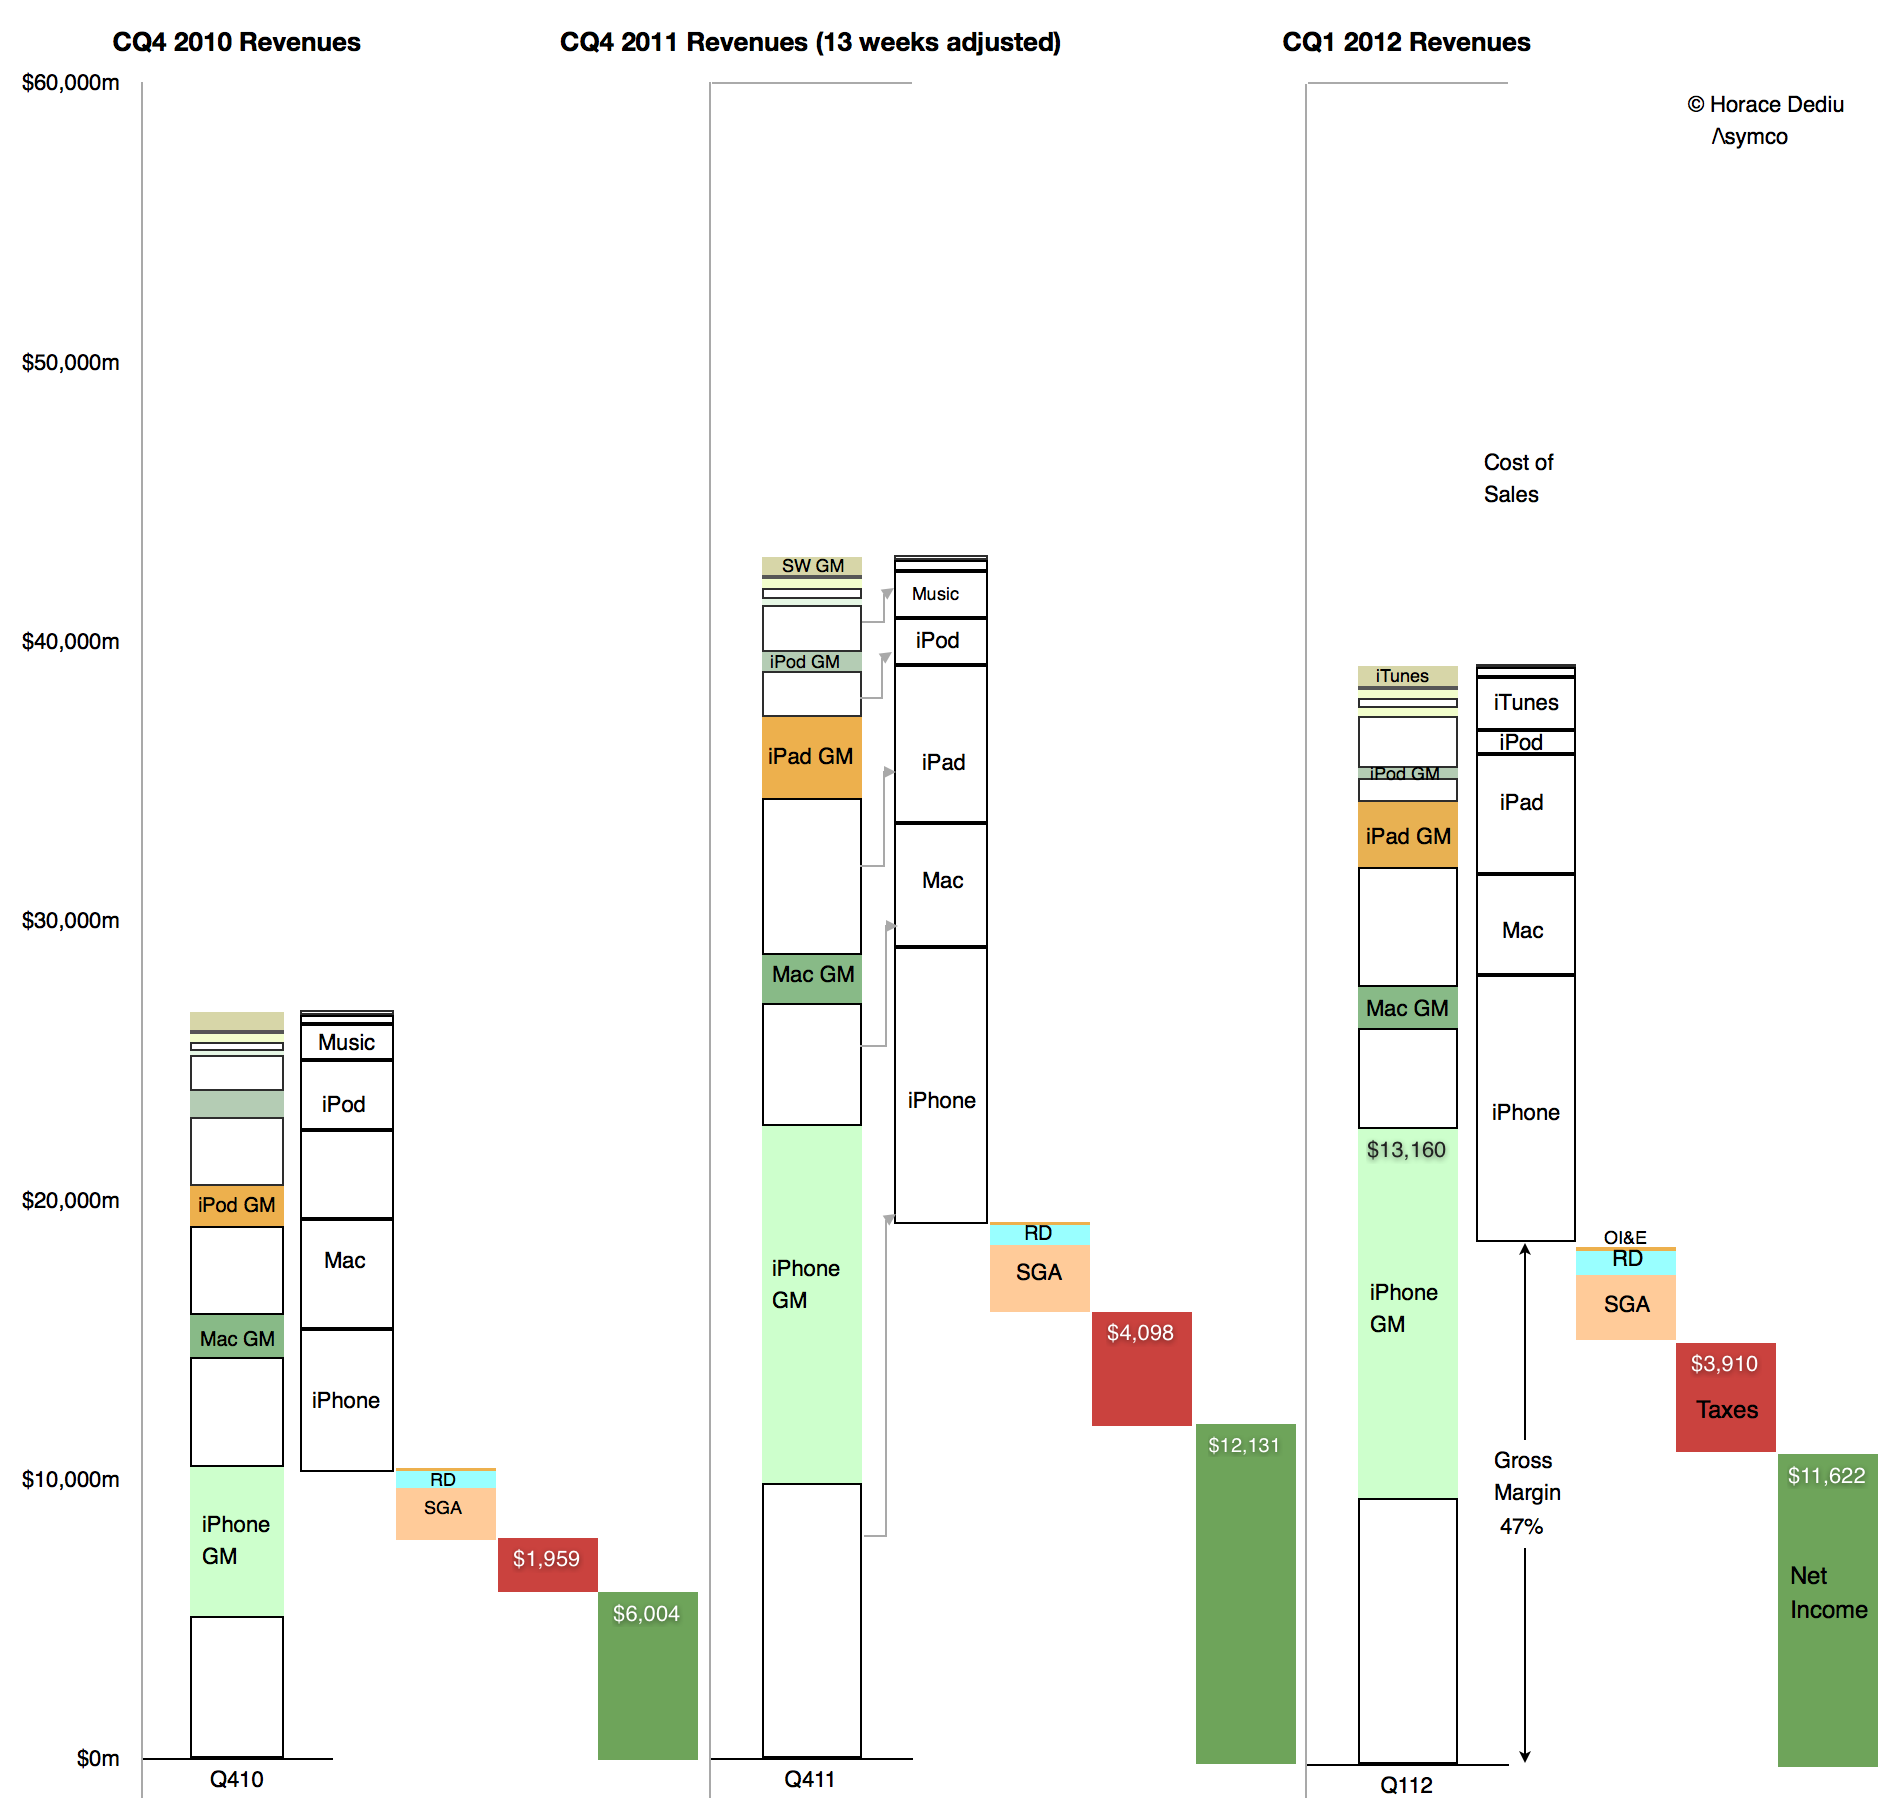
There is an easily observed cause to changes in production costs. Consider the opposite effect in the sequential change from the fourth quarter of 2011 to the first quarter of 2012:
Here we can see how sequentially sales fell but gross margins rose. Again, the change in absolute Gross Margin was slight but the reduction in cost of sales was out of proportion of the reduction in sales. Cost of sales fell by 13% while sales fell by 9%. The result was an increase in gross margin from 45% to 47%. The cause was that the cost of production fell.
Obviously. Because, as everyone knows, costs of production fall as output increases. It's due to something called the learning curve. It's something that has happened for all of Apple's (or anyone else's) product launches forever.
What is not obvious is the effect this has on the share price whose changes are shown at the bottom of the first diagram. It's a case where one margin's fall has caused quite a few margin calls.
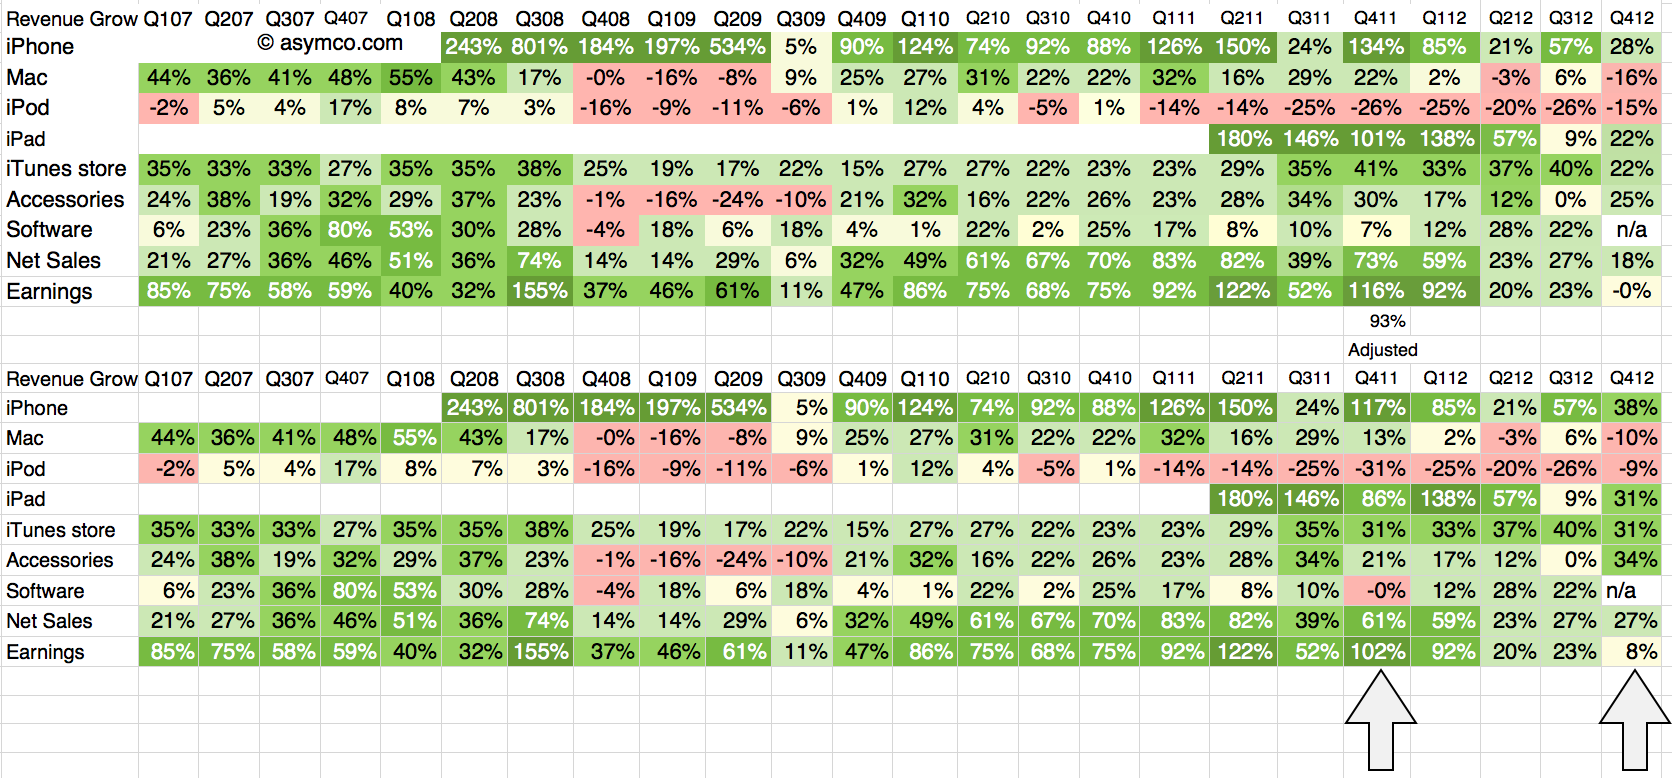
The fourth quarter of 2012 was 13 weeks in duration while the fourth quarter of 2011 was 14 weeks. The difference implies that a comparison of revenues should be done with an adjusted 93% of the 2011 values. The growth for 4Q 2011 relative to 4Q 2010 should also be adjusted on this basis.
The following tables show the unadjusted and adjusted growth rates. The adjustments apply to the bottom table and the columns highlighted.
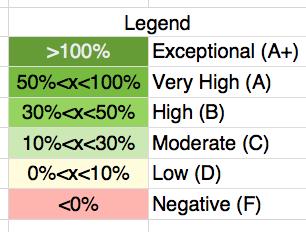
As in previous scorecards, I used the following color scheme to "grade" the performance.
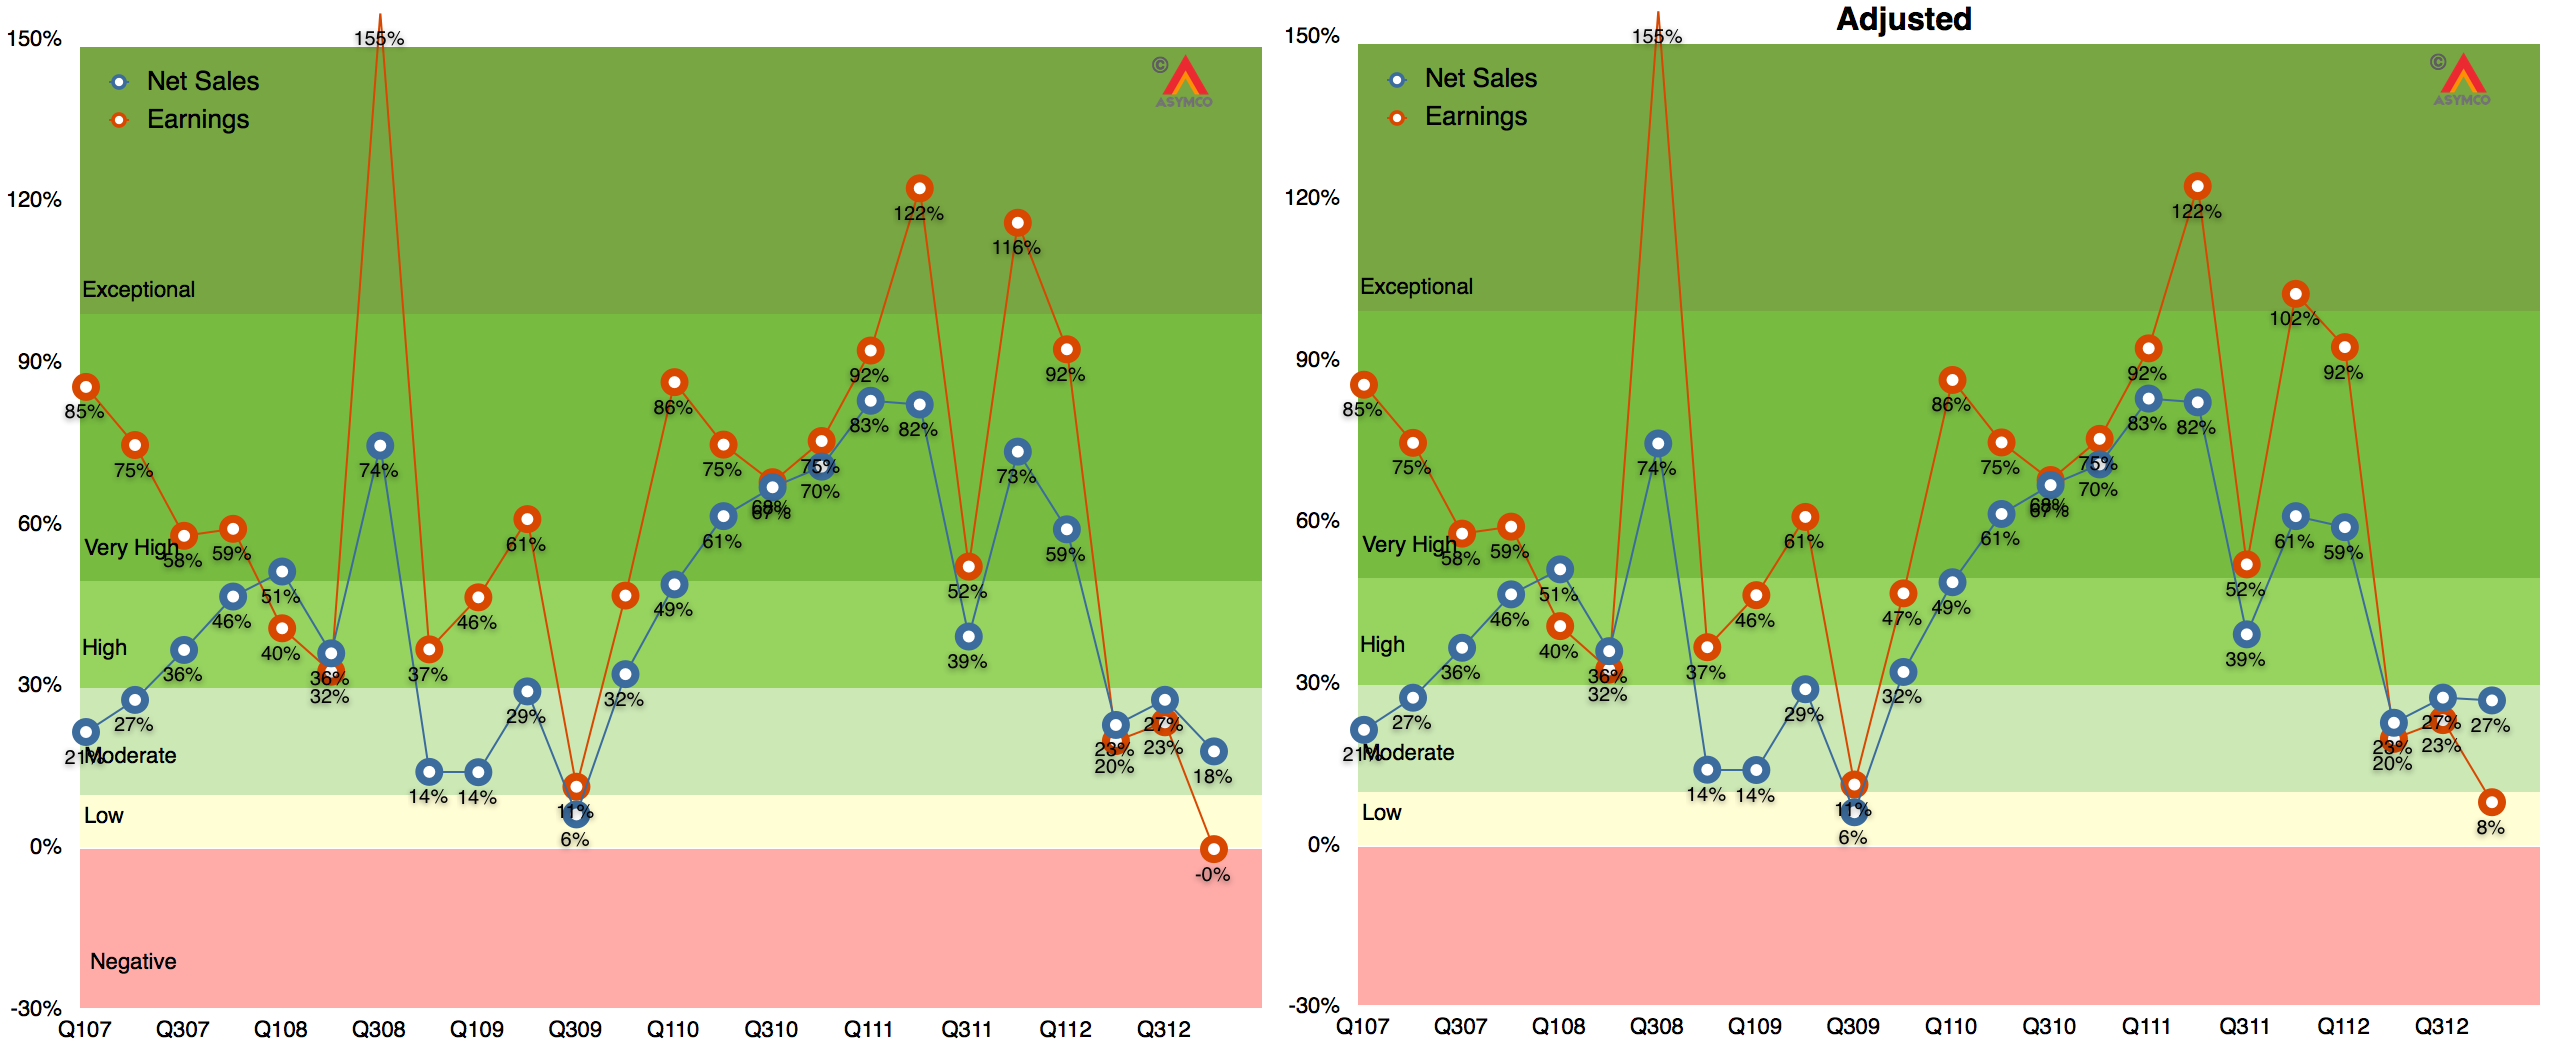
The adjustment brings growth in sales to a respectable 27%, well above the 18% unadjusted level. In fact, using the color map grading system four lines increase their rating from "Moderate" to "High" growth: iPhone, iPad, iTunes, Accessories all move from the 20's to 30's percent growth.
The bottom line moves from 0% to 8% growth but it's still low relative to historic performance. That had to do with margins; more about that later.
The graphs showing Revenue and Earnings growth with and without adjustments are shown below:
Note that iPad, iPhone, Accessories and iTunes/Software are based on re-stated figures.
Note also that the adjusted 2011 growth rates do not change dramatically with only iPad changing from Exceptional to Very High.
My thanks to all those who made Asymconf California the best Asymconf ever. We had over 200 attendees and, for the first time ever, 50 workshop participants and a panel session. The venue was spectacular: IBM's historic Almaden Research Center and special thanks to Paul Brody of IBM for making it available.
Engagement was stronger than ever and I believe we moved the ball forward on a range of topics: The workshops helped solve some of the mysteries related to Amazon valuation and the main event looked at the limits of growth. The State of the Union took a look at the post-PC world and Apple's inflection point. The panel session took on the future of TV and, including the audience, we had input from some of the most influential companies in the space.
We will scramble to make the proceedings (in the form of an iPad download) available as soon as possible.
In the latest quarterly report Apple changed how it reports product revenues. In previous quarters the iPhone and iPad were reported including accessory revenues while iPod accessories were reported under "Music" revenues.
"Under this new format revenue from iPhone, iPad, Mac and iPod sales is presented exclusive of related service and accessory revenue […] revenue from all Apple and third party accessory sales is presented as a single line item [Accessories.]"
Apple provided a document showing re-classified product summary data. By measuring the difference between original revenue and re-stated revenue per product we can determine how much service and accessory revenue was being attached to each product.
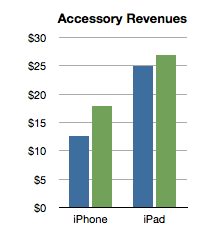
I did this for two quarters as a sample:
The analysis shows that the iPhone has been receiving about $15 of accessory attached value and the iPad about $25. Interesting trivia, but how is this insightful?
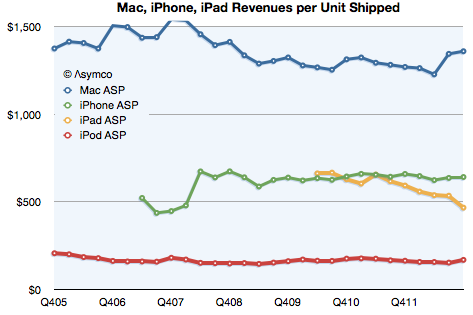
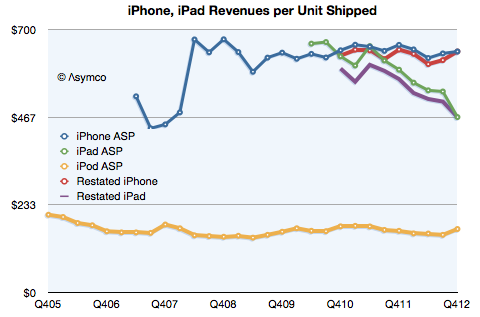
Consider the impact on this analysis of revenues/unit shipped:
The iPhone obtained about $642 revenue/unit (shown above as the last datum in the green line). That compares slightly lower with last year's $659/unit. However, the latest quarter is on the new basis and the data in the chart above shows old basis.
Here is the data with re-stated iPad and iPhone ASP:
On a re-stated basis, without the extra revenue from accessories, the iPhone "ASP" (Average Selling Price) from a year ago becomes $646 (which, again, is not what is reflected in the graph). This is almost exactly the same as the current quarter. The iPhone "ASP erosion" therefore goes from 2.6% to only 0.7%.
Similarly, the iPad shown at $467 in the latest quarter does not drop from $593 last year but from $568. Its ASP erosion becomes 18% rather than 21%.
Interesting resilience with the iPhone and slightly better support for the iPad price. What does it mean?
Pricing power is the most important indicator of differentiation and it implies an ability to create value in excess of cost. Not only that but it also indicates whether a product is being "commoditized" by over-serving the market and being substituted by lower priced alternatives.
In the case of the iPhone the tenacious retention of its ASP indicates that the point of over-service has not been reached. Buyers are not yet switching in significant numbers to the older, cheaper variants available from Apple. If they were we would see evidence in the price first due to the change in mix.
Contrast that with the iPad where there is a far more marked erosion. That's due to the introduction of the mini which is good enough to substitute for the larger version for many of the jobs it's hired to do. We can safely argue that the iPad is good enough in smaller form factors and addressing larger markets.
But why isn't this happening to the iPhone? Why isn't the iPhone n-1 "good enough"? Surely consumers can do almost the same tasks with an iPhone 4S as they can with the 5. Why are they still buying the new phone?
The clue comes from the fact that the consumer is not the only buyer. It's operators who buy and re-price the product. They are hiring the product to sell broadband and the newest variant is still the best hire to do that job. This observation is crucial to understanding the growth dynamics of the iPhone and consequently, of Apple itself.
I repeat what I've mentioned before: The iPhone is primarily hired as a premium network service salesman. It receives a "commission" for selling a premium service in the form of a premium price. Because it's so good at it, the premium is quite high. Also because it's so good, it gets bought in large batches which allow Apple to schedule production efficiently.
This understanding gives us a solid basis from which to evaluate its growth potential.