Asymco

Asymmetric Intelligence

Latest from Asymco

  1. The iPhone and Apple's Margins

    Research · 17 comments

    As the following graph shows Apple gross margins and its operating margins have both been on a consistent upward slope since early 2006.
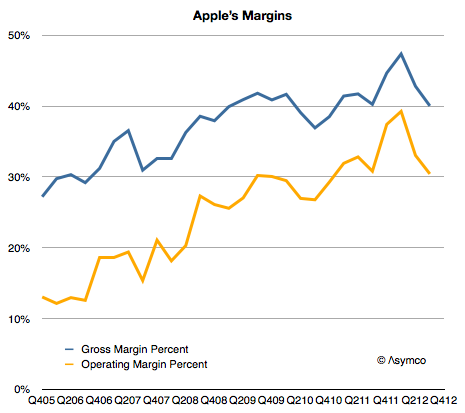
    The reason is that the company has moved to more mobile devices as a percent of products shipped. Whereas Macs have had decent margins by the standard of the PC industry, they are not as profitable on a unit basis as iPods, iPhones or iPads. As portable or mobile products grow rapidly, it would follow that margins would as well.

    However, the growth is not monotonic. There are occasional dips in gross margins. The cause is the launch of new device versions. On the following graph I show the launch times for the iPhone versions and the company's gross margin as well as my estimates for iPhone and other product line margins.
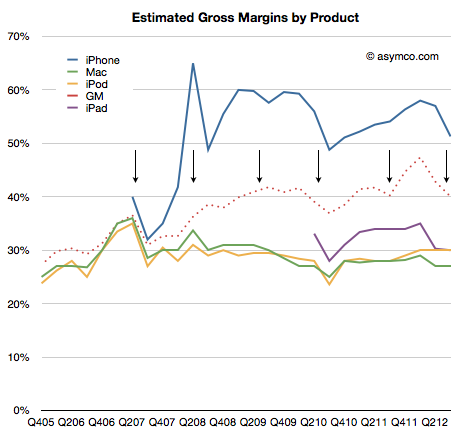
    The general pattern is clear: each new version of the iPhone causes a dip in gross margins. This is not surprising as the company forewarns of this (in a decidedly exaggerated manner.) But why does it happen?

    The iPhone is a profit monster, but when it launches there are many costs associated with it: components tend to be more expensive, there are more warranty returns, there are higher shipping costs are units are shipped in smaller lots to more points of sale. Tim Cook explains as "In terms of costs, with each new product we see learning curves associated with ramping production."

    Every launch causes an amplification of these learning effects. With each dip in margins however, comes another surge as the learning is complete and the volumes of the new generation product begin to dwarf the previous. And so the process continues.

    There is an asymptotic limit to margins as they cannot grow higher than whatever the iPhone yields but that's not yet in sight. The upper bound is probably in the 50% range.

  2. iPad sales grew 44 percent in Q3

    Research · 31 comments

    The iPad grew shipments at 26% y/y but "sales" as measured by sell-through were up 44%. Detail from Tim Cook's discussion:

    "The June to September [sequential change] was 17 million to 14 million…   as we had talked about in the July call, the June quarter contained 1.2 million increase in channel inventory and so … the comparison looks very different than our reported [shipment] numbers do… On a year-over-year basis, because of the year ago quarter having also a channel inventory build as we stock the channel to the [proper] level, the sell through year-over-year actually grew 44% and so the underlying sell through was extremely strong."

    Sell-through, (or "sales" vs. "shipments") is a much better indicator of demand, obviously. Also see transcript for explanation of sequential decline (educational buying).

    44% is not spectacular but it places the growth far more comfortably in the "high" bracket than the 26% units and 9% revenue growth that shipments data would indicate.

  3. Apple's Growth Scorecard for third quarter 2012

    Research · 70 comments

    In the parlance of developers Apple keeps "throwing exceptions." This quarter the iPad surprised with a significant decline in sales growth. I placed a table showing the sales growth for this quarter as well as the previous 22 quarters at the bottom of this post.

    Here is a quick review of each line:

    1. The iPhone returned to a more customary growth rate (which I rate as Very Good--above 50%). The quarter was bound to be quirky due to it being both a transition quarter and a launch quarter. The launch of the iPhone 5 came quite late but not too late to make a contribution. It was also widely rumored and anticipated so there was slowing of the previous generation product. I expect growth to accelerate further in the last quarter of the year.
    2. The Mac turned in a commendable 6% revenue growth (1% unit growth) on the back of the new 15" Retina screen MacBook. The average sales price increased sequentially and the mix of portables to desktops reached a new high of above 80%. More about the Mac will be written in a future post.
    3. The iPod continued its decline. The 26% sales decline was in-line with other non-launch quarters. The company tipped its hand and let us know that iPod touch now makes up 60% of iPod volumes. At 3.2 million iPod touch units, it's a significant iOS contributor but still a declining number.
    4. The iPad was painfully underperforming. With only 9% revenue growth, it was a complete reversal of the torrid growth of the last two years. Management blamed both anticipation of a new product and a reduction of inventory ahead of refresh of the larger screen retina. The only silver lining was that the average price decline was moderate (down about $3/unit). Overall, I'm very disappointed with the pause in the product but the new mini could change the character of the product dramatically in a way similar to how the iPod mini turbo-charged the iPod line.
    5. iTunes had a very good quarter. It's the perennial growth engine with the most consistent performance throughout the time period shown. It was the second fastest growing line item firmly in the "High" growth bracket.
    6. Peripherals, including Apple TV had a moderate quarter. Management revealed that about 5 million Apple TV units shipped in the fiscal year. That adds up to a half-billion dollar revenue business. Peripherals had $2.8 billion over the same time frame so Apple TV was about 18% on a yearly basis. This does not include content revenues.
    7. Software had a modest growth of 22% but has come to be the high end of the range. Since changing the way it prices OS X updates, the era of Apple software windfalls is over. Still, at nearly $1 billion per quarter it's nice pocket change, especially as it's nearly all margin.
    8. The overall top line (net sales) was a bit improved sequentially (+4 points of percent) but still in the "transition quarter" range of moderate growth. The company may be shifting its launch cycles and as a result we're seeing a break in pattern. As pricing for iPhone and iPad did not change very much the slowing of top line growth is entirely due to a unit shipment reduction. Again, the primary cause is transitions in multiple lines simultaneously.
    9. The bottom line (earnings) followed the same pattern as top line (slight sequential increase in growth). There was a slight attenuation of margins (gross margins are down to 40%).

    Overall, the quarter was not up to the recent level of performance for Apple. Growth was overall "moderate".

  4. Asymconf 2012 videos now available

    Podcast · 6 comments

    The Asymconf 2012 videos are now available for purchase from the new Asymco Store.

    The package includes 1080p HD video produced by Kevin Krautle. Multiple camera angles capture all the action. Great quality audio and hours of conversation. It's even subtitled. Over 20 gigs of content.

    But wait, there's more. You also get Perspective stories, Audio Podcast and Transcripts all for the low, low price of $89.99. Over 20 Gigabytes of content.

    I hope you enjoy it as much as we enjoyed producing it.

  5. The next 100 million iPads

    Research · 56 comments

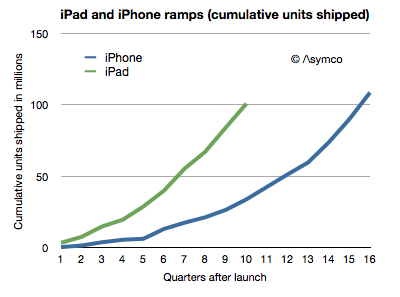
    Having reached 100 million iPads shipped in 2.5 years the natural question is how long will it take for the next 100 million iPads?

    The ramp of cumulative units shipped is shown below.


    I also added the equivalent ramp for the iPhone. [The last data point for the iPad is based on an estimate of 16.5 million units in Q3 which may need revision depending on company reporting.]

    The next 100 million will depend to a large degree on the success of the new iPad mini. To make an estimate we have to realize that there are several aspects of the tablet market which differ from the phone market and that therefore the predictive power for previous data is weak.

    First, the channels are different. Tablets are sold as media consumption or "computing" products. They are not sold as communication devices. Therefore operators have few incentives to promote and subsidize them. They do participate in the distribution but not with the same level of commitment. That means less "push" and opportunity for discovery. Apple has an advantage in this case with their stores and brand value. The lack of operator engagement and lack of points of sale might be one reason why Android tablets have not ramped as quickly.

    Second, for some competitors, the tablet itself is a loss leader and acts more as a terminal into an ecosystem rather than a product in itself. In cases where tablets are given away it's possible that consumers might own one for each platform or ecosystem. This is similar to the game console model where the cost of the console is not a barrier to many avid gamers. This means that penetration of tablets can reach above 100% of users in some markets. Although network connections (i.e. SIM cards) can and do reach well above 100%, the number of phones in use by one person simultaneously is bounded.

    Third, the lifetime of the product is as yet undetermined. Phones tend to last 2 years. This is due to evolving standards as well as high wear and tear and breakage or losses. Tablets are not as "mobile" and are less likely to be used and the basic functionality does not evolve as rapidly. It's possible that replacement rates for tablets will follow more that of notebook computers than phones. Perhaps between 2 and 4 years. I suspect most iPads purchased are still in use today, including the first version. There will be some obsolescence from system upgrades, but the older systems will keep going.

    Some of these aspects of the product could lead to slower growth and some to faster growth. That and the fact that it's a completely new category with business and consumer and educational and vertical applications makes it a difficult product to forecast.

    Having said that, the product is extremely resonant with buyers. The growth to 100 million is testament to that. The liquidity of the product, with no carrier locking and no pricing illusions means that it reaches all parts of the world quickly. So there is no obvious upper bound on the size of population who might buy it. The new price points and form factor may lead to a wave of new adoption, similar to the impact the iPod mini had on the iPod line.

    There are still many factors that can slow growth, especially production capacity, but I believe that the iPad could growth between 50% and 80% which would mean 100 million more iPads could be sold by the end of 2013.

  6. Nokia's price for exclusivity

    Research · 47 comments

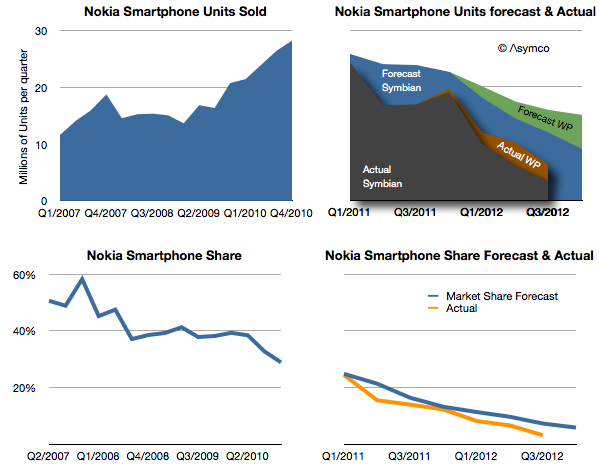
    Days after Nokia announced the end of life for the Symbian platform I wrote a post titled Who will buy the next 150 million Symbian smartphones? The reference was to claim by management that before there would be a complete transition to Windows Phone, 150 million legacy Symbian phones would be sold, keeping the company financially stable before the new ecosystem took root.

    I reproduce the original forecast I made below with the addition of what actually happened.

    [Note that the Actual stack area chart is independent of the forecast area chart as indicated by shading.]

    My forecast in early 2011 was based on the 150 million Symbian phones being sold over a two year transition period. The implication with the forecast for Windows Phone was that this would still lead to a difficult contraction of volumes.

    As it turns out, only 96 million Symbian devices have been sold in the 7 quarters since the platform was deprecated. It's unlikely that there will be ever by 150 million units sold as last quarter only 3.4 million shipped. In any case, management has already retracted that claim.

    What about the Windows Phone forecast? It turns out that by this point in time (Q3 2012) I had expected Lumia shipments to total 9 million. Actual shipments reached about 9.5 million, so not bad. However, the market grew faster than I had expected and overall Nokia smartphone market share turned out to be slightly lower (6.3% in Q2 vs. 10% estimated.)

    The just ended quarter shares are not yet available but it's quite possible that overall Nokia smartphones could be well below 5%, and may slip to 3% during the transition period.

    My warning in February 2012 was that 150 million Symbian units would not ship since I expected there would be a stigma associated with the products among distributors, even if consumers were fine with them (which they weren't).

    The public execution of Symbian (and any other alternative being developed inside Nokia) will probably be a classic case study in disruption management. To wit: even if a platform needs to be led out to pasture, there are ways of managing decline other than suicide. Nokia's failure is not so much having chosen the wrong alternative to Symbian, but having chosen exclusively.

    However, there's a twist. The company did not accept exclusivity of one supplier without a concession: In exchange for exclusivity, Nokia negotiated $250 million every quarter in the form of "platform support payments" from Microsoft. Nokia has to date received over $1 billion in such payments. (For the last quarter that amounts to $86 for each Lumia phone shipped.)

    The tragedy comes from this $1 billion/yr not being enough. The foregone revenues from Symbian (assuming they had been able to maintain the decline to the level of 150 million units that they had originally forecast) would be about $9 billion. This means that had Nokia not knifed Symbian and had sold the shortfall units at an average price of $200 they would have received an additional $9 billion in sales. Furthermore, assuming a margin of 33% for those units, Nokia received from Microsoft one third from of what she gave up for exclusivity.

    In other words, the net cost of the Microsoft exclusive relationship is at least $2 billion in operating profit.

    This turns out to be the difference between being profitable and being distressed.

    We will never know if this scenario would have ever happened, but the forecast management made 21 months ago suggests that at least they thought this was what they were going to get out of the bargain.

    This reminds me of another article posted around the same time.

  7. Nokia's Lumia brand strategy for the US

    Research · 29 comments

    Last July I asked the question "How many Lumia phones were shipped in the US?"

    My answer was 630k through the first half of this year.

    I revisit this question following Nokia's latest quarterly report.

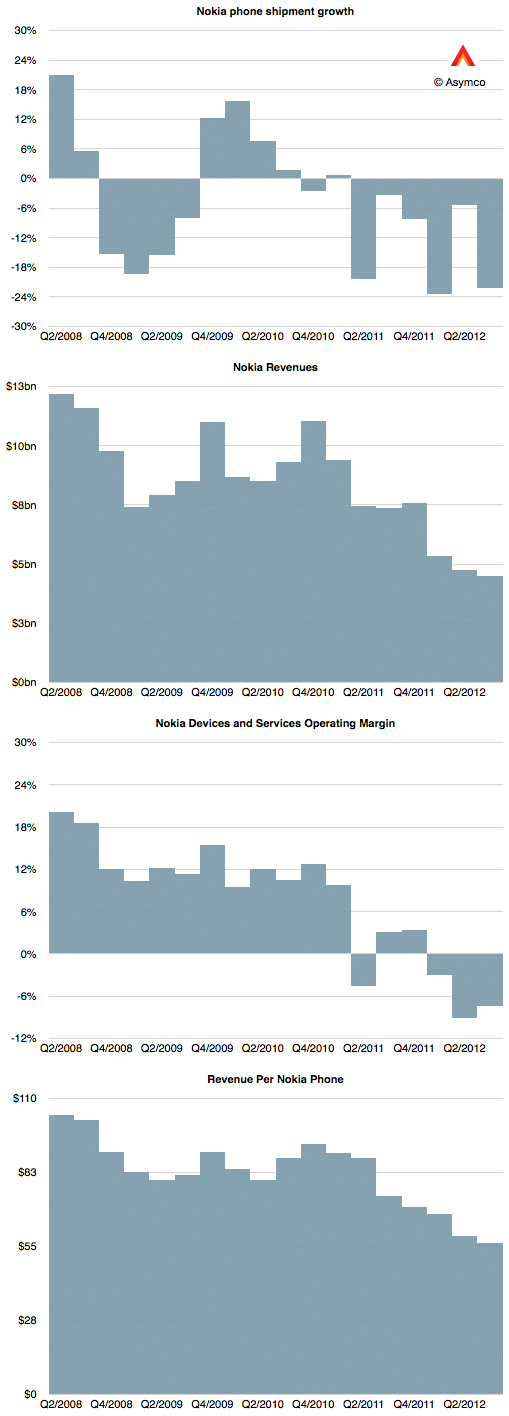
    As a quick review, Nokia reported the following performance for its mobile phones operations:


    The most worrying thing of all however is that Nokia's smartphone performance has collapsed. With only 6.3 million units shipped, the company may be the worst performer among eight competitors I track. They were below RIM's shipment total.

    The value of 6.3 represents only 7.6% of their overall phone shipments.

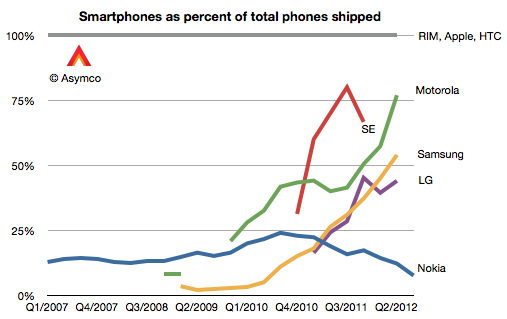
    As the graph above shows, Nokia is going in the wrong direction with respect to moving to a smartphone portfolio.[1]

    Of the total 6.3 million smartphones (aka smart devices, as per Nokia's reporting nomenclature) 2.9 million were Lumia Windows Phone units.

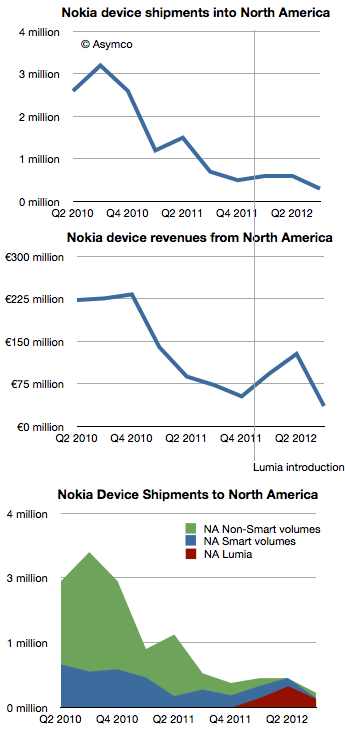
    Using information about average selling prices and total volumes into North America, I was able to estimate that there were about 180,000 units sold into North America during the last quarter.

    Since launch, my estimate is that Lumia has sold 810k units in the North American market.

    This cannot be seen as a good performance. There are mitigating factors such as the lack of upgradeability to Windows Phone 8 which probably deflated demand[2]. However, it's a poignant observation that during the last quarter the US reached 50% smartphone penetration by users. As traction is still absent from both Nokia and Microsoft in the US market, we are back to the question of how to compete.

    As the market in the US transitions from competition against non-consumption to competition among rival platforms, the Lumia brand is being forced into targeting smartphone "switchers" rather than smartphone "adopters". The switching option is expensive, requiring aggressive advertising (see Samsung Electronics' $11 billion ad budget).

    There's only one source of cash for that sort of strategy.

    ---

    Notes:

    1. The caveat is that they market some of the Series 40 phones are "smartphones" on the basis of having "smartphone-equivalent" performance. However, smartphone equivalency is and has been purely subjective. On that basis there were many times in the last decade and a half that we could have counted Java-based or BREW-based or i-Mode-based phones "smartphone-like". Smartphone has been defined on the basis of running an operating system with native APIs for developers.
    2. I imagine that the upgrade path could have been known to Nokia, AT&T and Microsoft nine months ago when the Lumia was unveiled for the US by the three CEOs and therefore expectations could have been modulated accordingly.