Asymco

Asymmetric Intelligence

Latest from Asymco

  1. Minding the store

    Research · 59 comments

    Apple's Retail head was recently replaced. The hire seems to have been a mistake dealt with quite swiftly. It is tempting to think that the firing of a manager is due to a failure in their performance, measurable in quarterly reported metrics. But this is not often the case. It may be true of sales or some operations, but most strategic management decisions take months to make and years to implement before you can have the luxury of measured results. And even then the dependencies of performance are many and outside the control of specific managers.

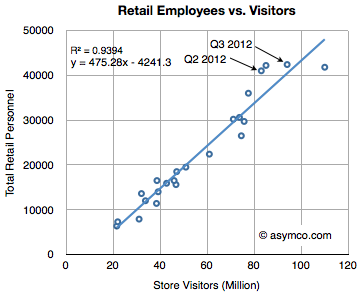
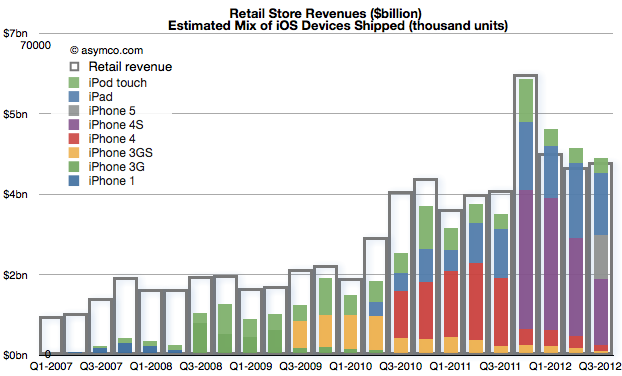
    John Browett joined Apple in April and left in October. A mere six months. How did Apple retail perform in those two quarters? Very well actually. Which is to say, as well as it has previously given the overall performance of the company. The correlation can be shown between store revenues and iOS device shipments:

    Store visits increased to 94 million in Q3, second only to fourth quarter of 2011. The growth was 21%. Year-on-year growth in revenues was about 17% for both quarters, in-line with company growth. Profits grew 5% in Q2 and 25% in Q3.

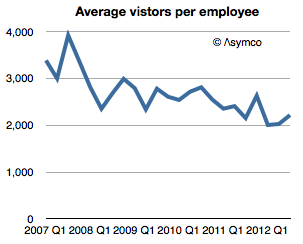
    Average visitors per employee picked up slightly but remained largely unchanged since 2008.

    Employment increased in proportion to visitors, consistent with previous quarters.

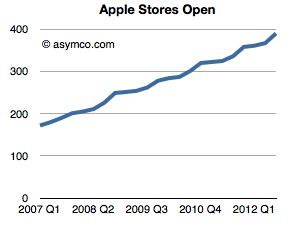
    Store openings were 9 and 18, above the recent past but consistent with historic trend.

    [It should be noted here that the lead time for a store's opening is longer than the development time of an iPhone so whatever was opened was probably planned in 2010 or so.]

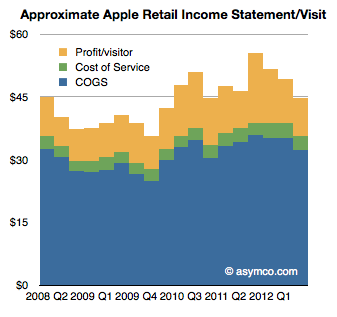
    Based on employment time and cost, the "performance" of the stores were not divergent from the overall historic trend (and product launch cycles of the company.)

    If stores did not show any effect of poor management, then why was Browett fired? I suspect it had mostly to do with a mis-match of understanding of the job the stores are hired to do by consumers and by Apple itself. The company treats the stores as a sales channel but also as a communications channel with its customers. Recall when Steve Jobs was asked why they stopped attending MacWorld (and any other trade show) he answered that they had the dialog they needed with customers through their stores making.

    That dialog is engaged between 100 million visitors and 42,000 employees every three months. The average time spent with each visitor is 13 minutes. Each visitor also leaves about $45 behind. As I put it earlier, the stores are the face of the brand.

    Whoever is in charge must understand this special relationship. The surprise for me is not that Browett was fired, but that if he did not understand this relationship, how was he ever hired?


  2. ReCapEx: The curious case of Apple's 2012 and 2013 Capital Expenditures

    Research · 111 comments

    The latest yearly report from Apple includes, as it has in the past, the forecast of Capital Expenditures. I've been tracking this data as an indicator of both strategic intent and potential forecasting tool for iOS device production.

    Before exploring Apple's own forecast, we should look at how they met expectations for fiscal 2012.

    In October 2011 the company forecast was as follows:

    The Company anticipates utilizing approximately $8.0 billion for capital expenditures during 2012, including approximately $900 million for retail store facilities and approximately $7.1 billion for product tooling and manufacturing process equipment

    In October 2012 it reported:

    The Company’s capital expenditures were $10.3 billion during 2012, consisting of $865 million for retail store facilities and $9.5 billion for other capital expenditures, including product tooling and manufacturing process equipment, and other corporate facilities and infrastructure. The Company’s actual cash payments for capital expenditures during 2012 were $8.3 billion.

    There are two points that need to be highlighted:

    1. Expenditures overall were $2.3 billion higher than forecast. Nearly all of the over-spending was for "product tooling, manufacturing process equipment and infrastructure". Retail was planned at $900 million and actual was $865 (an under-spend of $35 million). As no major real estate assets were acquired (change in those assets was $380 million, less than 2011 or 2010) the "deficit" in budgeted expenditures can be attributed entirely to product tooling and manufacturing process equipment.[1] The $2.3 billion spending over expectations amounts to 34% of forecast.
    2. The cash payments for capex were $2 billion lower than expenditures. This is a curious situation which was not highlighted in previous 10 K reports. What this implies is that much of the "over-spend" was not paid for though cash and since no new debt was booked it's likely to have been paid for through some form of vendor financing. I'll explore some explanations below.

    So it's important to note that the company spent a great deal more (one third more) than expected and paid for some of the acquisitions through uncharacteristic or unorthodox means.

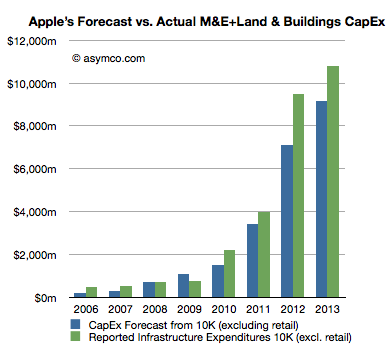
    The historic budgeting for Machinery & Equipment (+Land & Buildings) is shown in the following graph:


    I included the forecast for 2013 ($9.15 billion) and added 18% to estimate 2013 actual spend.

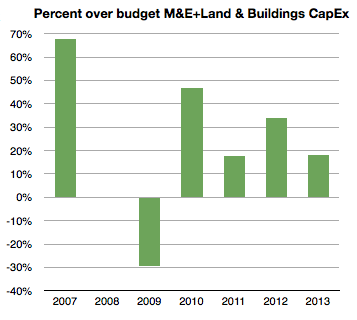
    The percent over/under budget (percent difference between green and blue bars above) is shown below:

    [Again, note that I took the liberty of forecasting 2013 over-spending at 18% or $10.8 billion.]

    Note that 2008 and 2009 were either on target or below target. The recession of 2008/2009 might have had something to do with that. The under-spending situation of 2009 was made up for during 2010 with over 45% extra spending. 2011 came in at 18% over and 2012, as already noted, was 34% over budget. I then suggest that 2013 will be at 18%, same as in 2011.

    When seen in this historic context, the increase of 2012 is even more dramatic. Apple overspent in 2012 more than it spent overall two years earlier. 2012 spending on M&E (and Land) was up 138% sequentially and nearly seven times the level of three years ago.

    With this splurge in mind it's necessary to think about that second noteworthy point above. There is evidence that at least some of the $2.3 billion over-budget was unanticipated and came late in the year. We saw the surge in spending in FQ4 from the gross asset value change data. The question is what was it spent on and why did it not go through the cash flow statement?

    Circumstantial[2] evidence points to the asset being production equipment (or even a whole plant) previously owned by Sharp. Sharp is a key supplier of screens to Apple but is also in financial distress. Sharp has also been the object of an intended investment by Foxconn [Hon Hai]. That deal fell through as Sharp's finances deteriorated. My guess is that these attempts to shore up Sharp are directed by Apple to ensure both continuity of supply and a balanced supplier base (offsetting Samsung, another supplier.) If Sharp were to enter into some form of bankruptcy, the key plant(s) used in producing screens for Apple might be "up for grabs" by creditors and they might be taken off-line, jeopardizing Apple's production capacity, irrespective of contractual obligations. I believe that Apple's late and unprecedented expenditure was to secure this asset. I further believe that the financing for this deal was done through a swap of "pre-orders". Stepping even further into the hypothesis, I believe Apple arranged to move a Sharp screen production line onto its books and "paid" for it through a pre-payment of components. This being a pre-payment it would be in the form of an "off balance sheet" commitment. Apple reported that "As of September 29, 2012, the Company had outstanding off-balance sheet third-party manufacturing commitments and component purchase commitments of $21.1 billion" [my emphasis]. This is a significant increase from earlier years and allows for a huge "slush fund" to cover asset swaps.

    If we take the timing of this expenditure into consideration, I consider it reasonable to assume that 2013 spending is lower by this amount. In other words, I think that about $2 billion, including the Sharp plant, may have been "brought forward" by a few months from 2013. If the company had spent more on schedule and on budget (i.e. with an over-spend of 15% rather than 34%) it would have spent about $8.2 billion. Therefore, as next year's forecast is for $9.15 billion and as I would also expect an over-spend of 18% or $10.8 billion total, adding the brought-forward $2 billion would imply sequential growth from $8.2 to $12.8 or 56%.

    This is in contrast to the indicated change of $9.5 billion (actual) to $9.15 billion (forecast), or decrease of 4%.

    So, recapping the CapEx story, the company over-spent far more in 2012 than anticipated. It did so late in the year. It did it while a supplier was in distress and another's supplier's efforts in rescue failed. Furthermore, it indicated a modest and thus uncharacteristic increase in the next year's CapEx budget. My take is that the trajectory of investment is not being altered dramatically but it's had an adjustment in timing, a kink in the line. The overall story remains that Apple is still injecting vast and growing amounts of capital into production and placing those assets on its own balance sheet.

    ---

    Notes:

    1. I track this spending through asset value changes in the balance sheet. That change in value excludes depreciation which turned to to be substantial in 2012: $2.44 billion.
    2. What follows is strictly hypothetical and based only on pieces of evidence that have become public hinting at an explanation but there is no proof.
  3. The policymaker's dilemma

    Research · 33 comments

    Here is an exchange with Robert van Apeldoorn, Journalist with Trends Tendances Magazine in Belgium. (www.trends.be/fr). The exchange took place in early September via e-mail.

    Robert: -Information and Communications Technology (ICT) is considered in Europe as a way to push growth, and is a target of national and EU policies (digital growth,etc), but the result seems to be a failure: the European computer industry (hardware) is almost dead (ICL, Siemens computers bought by Fujitsu, Olivetti almost out of computer business, Nixdorf dead) since the 90’, and the telco industry seems to be in crisis. All European companies are out of the handset business (big and fading exception is Nokia, but with  American software), and Alcatel is suffering with telco equipement manufacturing. It seems that at best, Europe can be a good niche player, with companies like ARM (chips). Technology seems to be reduced to localized services (computer services), some software businesses. What do you thing about that point of view? Is it correct or exaggerated ?
    What will remain to the European companies ?

    The main problem is perphaps the creation of European platform/ecosystems. Almost all are American today: Apple IOS-iTunes, Android, Amazon,…

    Why Symbian didn’t succeed as a competitive platform ?

    Is it possible to create European platforms? After all, IOS succeed after a short period of time.

    What are the European tech companies that could play an important role in the near future ?

    My answer: You are correct in this observation. Europe has failed to generate growth on the basis of ICT. The reasons are that the rate of change in ICT is rapid and getting more so. If European businesses require intervention, support or other forms of assistance in terms of policy, the time for that coordination to take effect is longer than the cycle time of disruption.

    Almost all growth has come from companies that entered the space. Google, Amazon, Apple and Facebook and even Microsoft came into positions of power from outside the industries they entered. Policy tends to offer means of sustaining incumbents or finding "logical" or defensible entrants. I should mention that the problem of industrial policy failing is not unique to Europe. Japan and to a lesser degree Korea are also facing crises of innovation due to policies designed to sustain rather than disrupt.

    It's understandable given the need to justify spending other people's money. No policy maker wants to spend it recklessly. However, the process of unforeseen growth is, well, unforeseeable. It cannot be predicted and it's very likely to come from somewhere other than where you expect it.

    This quickly becomes a lengthy discussion, but fundamentally the innovation process is chaotic. It's very similar to the process of artistic creation. The crisis in innovation comes from not having sufficient chaos. If Europe wants to preserve, sustain, nurture, and maintain it will do so at the expense of creative destruction. Nobody likes chaos but everybody wants innovation. Unfortunately they are concurrent things.

    thank you very much for these interesting answer. Usually the answer is the lack of venture capital or the compartimented market.

    So Nokia was an exception ?

    If a lack of venture capital is the problem then what is the cause of a lack of venture capital? There is plenty of capital on the continent. Why should it not be allocated to ventures? Capital markets in Europe are quite free and liquid and capital will find the best opportunities. The problem is that there are few fundable opportunities.

    I think Nokia was not an exception in the sense that it was not a "managed" success. The company (and Finland) emerged from a crisis in the early 90s. The crisis forced a re-evaluation of priorities and the success of Nokia could be attributed to a lack of emphasis in what was considered sustaining at the time (consumer electronics, TVs, natural resources, etc.) Entry into mobile phones was not what policy would have suggested was the biggest opportunity at the time. The market for mobile phones was projected to be insignificant in comparison to what was seen as success of the time (Sony, et. al.)

    [Addendum: What are policy makers suggesting as the key investment themes? Which projects get funding today and which don't?]

  4. The late smartphone adopter paradox

    Research · 68 comments

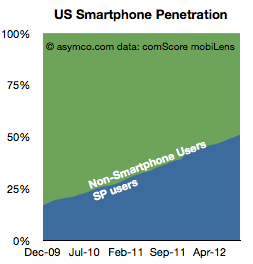
    comScore reports that US smartphone penetration has decisively crossed over 50% in August. This should not come as a surprise as the penetration rate has been very linear.

    Now that we've crossed this milestone, the thing to watch is the conversion rate from smartphone non-consumption to smartphone consumption.

    The reason is that we don't know what "saturation" means in smartphones. We can assume it's at least 80% as about 80% of new phones being purchased are smartphones. What we don't know is how much above 80% it can be. It could  be 100% if feature phones simply stop being made but we can't be sure if there will be latent demand and how long this will last (similar to the market for black-and-white TVs after Color became commonplace).

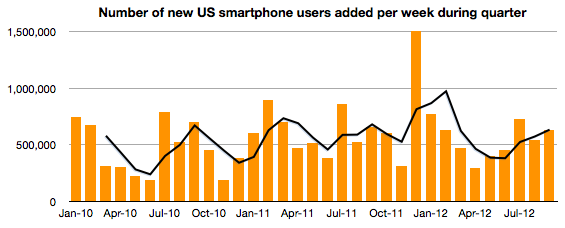
    To help keep an eye on this measure, the following graph shows the rate at which non-smart to smart conversion is happening.

    It measures the addition of new (to smart) subs each week in a particular measurement period (three months ending the month shown on the x-axis). There is also a 3 period moving average shown as a line. Keep in mind that this shows net new users and therefore excludes smartphone switchers. It's a good measure of how rapidly non-consumers are being converted to consumers.

    The data shows that there are as many first time smartphone adoptions in late 2012 as there were in late 2010. Or, the new-to-smart users are joining ecosystems just as quickly when penetration is 50% as when it was 20%. An encouraging situation when considering the opportunity space above 50%. The "S-curve" has not reached an inflection point.

    If you're thinking about growth, so far so good. There is however one surprise in the data.

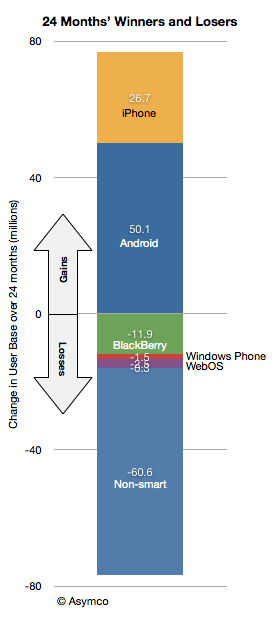
    All the growth in the last 24 months (between 2010 and present) was due to Android and iOS. Android added 50 million and iOS added 26 million in the last 24 months. The net smartphone user additions were about 60 million (RIM lost about 12 million, Windows lost 1.5 million and others lost 2.6 million). Android therefore has gained twice as many users as iOS has in this two-year period. Put another way, Android captured 70% of the growth and iOS captured 30% of the growth.

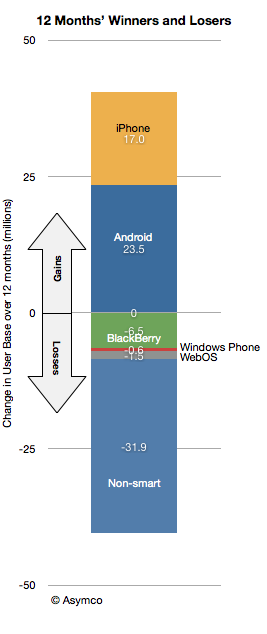
    However, if we look at the last 12 months, the split is 23.5 million for Android and 17.0 million for iOS. Android gained 58% of the growth and Apple captured 42%--a change in "spread" from 40 points to 16 in favor of Android.

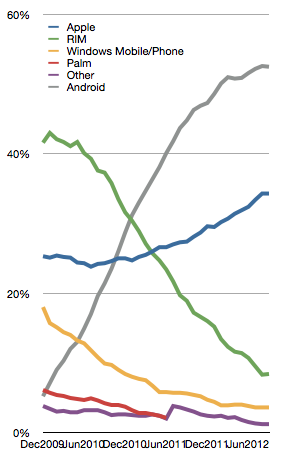
    The evidence also shows itself in the trajectory of platform market shares of installed base.

    In the last six months, Android share growth is slowing while iOS is still gaining.

    If this trend continues then the next 50% may not behave as one might expect (namely that late adopters would take the low-cost commodity offering accelerating Android adoption.) Late adopters may, in fact, be choosier than early adopters. And it's not at the cost of overall growth. Late adopters are still converting at the same rate of the early adopters.

    Therefore, paradoxically, the late market shows that the prospect for iOS growth seems strong. Furthermore, as we do reach saturation, perhaps in another three years, the secular growth may end in the US but the loyalty of iOS usage may give iOS another advantage in a market where growth is determined by "platform churn"

    The US is the crucible of the phone market in many ways so what happens in the US may be a harbinger for what happens world-wide.

  5. The App Revolution (in Filmmaking)

    Research · 20 comments

    The following article is published in Filmmaker Magazine. Fall 2012, Vol. 21 #1.

    There is a saying I once heard: "Once you change the method of distribution, the product has to change."

    This itself is a take on the idea that distribution defines the product. You see this around you every day in the products you buy. Cars are influenced by the dealership networks that sell them. Phones by the mobile network operators and the choice of computer you use at work by whatever the IT department or value added reseller prefers to work with. Mass market restaurants offer what can be sold by wholesalers--typically frozen, long shelf-life staples. Almost every product category is shaped more by what can be distributed than what can be produced. That's simply because in mature economies distribution is harder than production. In consumer products it requires access to wholesalers who then require access to shops who themselves have access to prime real estate which attracts foot traffic. Production only requires capital. Distribution requires relationships, often exclusive ones.

    This pattern is even more pronounced when looking at media products. Production is arguably easier since it's constrained by talent, which is fungible. But distribution is even harder as it is addressing bigger audiences in shorter time frames. You see this lopsided balance of power in the abundance of books being written relative to those being published. There are thousands of films produced and hundreds get distributed.

    But the saying suggests that if distribution were to change then the product itself would change. Indeed, if you can sell ebooks direct, then they tend to evolve into new genres (e.g. Fifty Shades of Grey). If you can sell cheap adult video online it tends to evolve into new genres as well (I'll leave examples to the imagination.) YouTube videos quickly cluster around "Fail" or "Win" compilations which evolved from America's Funniest Home Videos. They get millions of views. Even before the Internet, the availability of cable created the genre of music video, which created the first music broadcast alternative to radio. And of course, cinema itself redefined theater once it could get shown to millions rather than thousands. The new methods of distribution of media affected what gets produced rather than the other way around. Consider the converse: innovative filmmakers who try new storytelling methods are stymied by a lack of acceptance by existing distributors and find their material languishing in festivals or perpetual cult status.

    So we can re-state the saying to a new "Law of new media": Once you change the method of distribution, the medium itself has to change.

    I gave examples of how Internet distribution changed some media formats. However, the Internet itself has not had any effect on long-form cinema so far. In fact, you would be able to tell if Internet distribution did work by watching if the product would change. So far, it seems, at least to me, that the commercially successful product has not changed. One reason has been that film is still a very difficult product to distribute digitally as most of the world does not have the capacity to buy, consume and enjoy films digitally. Another is that the current distributors have had an allergic reaction to the option. As existing products have been crammed into the new distribution chain (e.g. Netflix) the established distributors are experiencing channel conflict and are raising the costs of digital distribution rights. Netflix has seen its costs triple as it ate into Cable market share. Fundamentally, the incumbent distributors are reluctant to open a channel of distribution which conflicts with or reduces margins of the existing channels.

    This brings up another corollary: fundamentally, you can’t move an existing media to a new network. You have to think of it as a deeply rooted-in system, and it's just not going to like moving to another environment. You have to uproot this huge tree, and it just won’t come out and if it did it will not take root in a new place.

    The only way to create this new value network around new distribution is to plant a new tree.

    This is the problem for the technology industry today. The only way technology companies can solve the “content is king” dilemma (which, by the way, is an euphemism for "Hollywood is king and Silicon Valley isn't"), is by allowing new content to flourish on top of new platforms. It’s not about moving the old content to the new platform. It’s about allowing new content to be created exclusively on the new platforms. This new content will therefore, by our law, be a new medium.

    For me, apps are that new medium. Apps offered a new way to package entertainment for “niche time”. The early fart apps evolved into a whole new genre of games which are now challenging the established game studios. The result is that a generation of developers has moved from building PC or web software to apps with cloud back-ends. The first to switch to this new medium were those with the least to lose and with the most modest of goals. Apps have now a more valuable industry than digital music with over 55 billion installs between the iPhone and Android ecosystems. Consumers are increasingly spending their spare time in front of apps. In the US “app consumption” increased from 43 min/day in 2010 to 94 min/day at the end of 2011. This number already exceeds the time spent in web consumption. I find it difficult to doubt that app time will exceed TV time, especially as TV time is increasingly a dual screen experience.

    (Feels like it needs one sentence explaining why. Is it because of their accessibility to small developers, or their ability to reach mobile handsets natively, or because of consumer trend?) If it’s absolutely impossible to move long-form video or long-form cinema to this new medium in such a way that everyone in the world can consume it on every device, then the app ecosystems will take up that challenge and say, “There’s a job to be done, and that’s to enertain people for an hour-and-a-half with characters, plots and wonderful stories, and we will make that happen, and we’ll call this thing an app.”

    And that app will solve that job for that person. It's what's happening to the game console business. The new game apps are distributed differently, priced differently and produced differently. As a result they are used differently and make a different set of developers thrive.

    The new app media will mean that we’ll just have to live in app universes, and go eat popcorn somewhere else. Microsoft and Google and Apple and Amazon and anybody else whose belly is at the bar has been scratching their heads wondering "How do we move that content over to us?" They've been barking up the wrong tree. The fundamental question isn't how to cram old media into a new shiny screen. It is how do you let developers and artists and creative people create stuff that is new and compatible with this new way of living.

    Think also about the history of media -- movies haven't been around forever; music hasn't existed as a recorded medium forever. Not even books. What did people do before these forms of expression? We think of the use cases of going to the movies, or the use cases of sitting in front of a TV on Sunday night, or playing a console game. These things didn’t get done at some point in time. Nor will they be done at some future point in time.

    In a few years we’ll move on and we won’t do those things. Each person will probably have his own screen in front of them--many already do--and whatever we do together we’ll do through a shared screen. We won’t have communal experiences that we associate with the old media. Certainly not in a theater. Maybe not even in a living room. And that is how we will move into a new value network.

    It is inevitable. As a technology provider, you shouldn’t try to squeeze a 19th-century model into a 21st-century model. Just let it go. Create a platform and give people the freedom to create on it. As a media creator, you should try to learn what the new model demands. New forms of interaction, new story telling opportunities, new ways to communicate with audiences. Create experiments and learn. It's the only way.
  6. Hey Big Spender

    Research · 64 comments

    In previous posts I described the patterns of asset value growth for Property Plant and Equipment at Apple and how that change has been thus far correlated to the production of iOS devices.

    The analysis was based on looking at the declared value of the PP&E assets on Apple's balance sheet. These values include depreciation so they reflect not only the "spending" on new assets but also the value lost due to wear and tear. As such it's not a perfect measure of investment.

    The better approach is to use declarations on the cash flow statement. Apple reports a specific cash flow related to PP&E: Under Investing Activities, Payments for acquisition of property, plan and equipment.

    In the latest 8-K the amount for the 12 months ended September 29 the value was $8.295 billion.

    Compare this with the statement in the Annual Report from one year ago:

    The Company anticipates utilizing approximately $8.0 billion for capital expenditures during 2012, including approximately $900 million for retail store facilities and approximately $7.1 billion for product tooling and manufacturing process equipment, and corporate facilities and infrastructure, including information systems hardware, software and enhancements.

    Compare also with the PP&E net asset value on the Balance Sheet currently at $15.452 billion but valued at $7.777 billion a year ago (an increase of $7.7 billion).

    This means that Apple intended to spend $8 billion, actually spent $8.3 billion and realized a net asset gain (after depreciation) of $7.7 billion.

    So there are no major surprises. The spending was only about 4% above expectations a year earlier.

    The other pattern to observe is that the spending rose dramatically into the fourth quarter. The fiscal quarterly spending was:

    1. $1.32 billion
    2. $1.46 billion
    3. $2.06 billion
    4. $3.46 billion

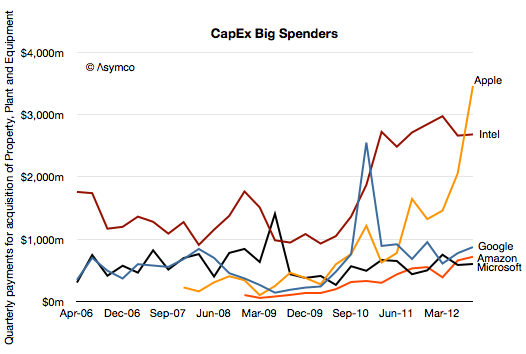
    I illustrate this pattern (and previous quarterly spending) in the following chart.

    The question remains what is this $8.3 billion being spent on?

    To help answer I also added the comparable spending (from cash flow statements) of a few other technology companies. Google, Amazon and Microsoft have been spending in the same range of $500 million per quarter. Over the past eight quarters the average spending of these companies has been:

    • Amazon $487 million
    • Microsoft $583 million
    • Google $800 million

    Intel is different. Its average spend level has been $2.6 billion/quarter.

    But Apple has just spent about 30% more than Intel. And it spent three times in Q3 than Google, 4.8x Microsoft and 3.8x Amazon.

    The level of spending and growth from a far lower level implies to me that Apple is spending primarily on process equipment (aka tooling) rather than servers. Data centers are expensive at $1 billion for a large one, but they are not being built fast enough to account for $3.5 billion in one quarter.

    Note that Apple's CapEx is above that of Intel whose fab-based semiconductor production method is known as particularly capital intensive. And Intel's Capital Expenditures have been increasing to all-time highs.

    If Apple spent at Google levels on server infrastructure it would only be spending a quarter of what it's actually spending. If Apple spent on production at Intel levels it would only be spending three quarters of what it's spending.

    In other words, Apple is spending at the equivalent of one Intel of fabrication and one Google of server infrastructure.

    In a few days we will learn what the plan for expenditure for fiscal 2013 is. Historically, the company has roughly doubled spending for each year of the iOS platform. If that continues then Apple will be spending the equivalent of several Intels and several Googles.

  7. The beloved hobbies of Google and Amazon

    Podcast · 40 comments

    Tim Cook speaking about the Apple TV product:

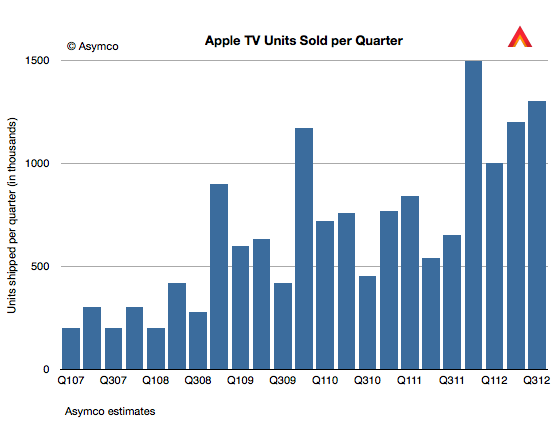
    For Q4 we sold 1.3 million. That is up over a 100% year-on-year. We sold more than 5 million Apple TVs during the fiscal year, which is almost double the previous year, when we sold 2.8 million. So the business continues to do very well, but if you look at the size of revenue of this business versus our other businesses, it’s quite small and so it still has the hobby label, however it’s a beloved hobby and we continue to focus on it and continue to believe there is something more there and continue to pull the string to see where it takes us.

    Five million Apple TVs per year is a half-billion dollar hobby. As such it quintupled from the first year (calendar 2007).

    The value for hardware is, of course, only a part of the story. It is accounted for as part of peripherals revenue and amounts to 18% of total peripherals revenues. Last May I estimated that the installed base of Apple TVs was 10 million. I'd estimate current total to be closer to 12 million. Assuming $10/month in content sales per Apple TV results in $1.4 billion of which 30% might be retained by Apple as revenue (agency fee).

    The yearly revenue thus could be as high as $900 million. Therefore it seems plausible that Apple TV is on the verge of being a billion dollar business.

    It may be a hobby to Apple but I've noted before on my podcast that Apple TV is a mirror image of the Kindle business model: Sell hardware at low margins and experiment with content sales as a profit model. The "hobby" moniker means that it's not a big business but how big is Kindle or Nexus 7 for their respective owners?

    Kindle may sell up to 10 million units at nearly break-even but is the average revenue per user much higher than Apple TV? What about the Nexus franchise? Is the loss on hardware leading to revenue to Google+OEMs above $10/month? I doubt it.

    I can't be precise or absolute about it since we don't have data from Amazon or Google about units or from any of the platforms' margins or attach rates for content, but I'm doubtful that they qualify for more than hobby status according to Apple's definition. At least in terms of profitability, Apple TV could be bigger than either Kindle or Nexus tablets.