A conversation with Philip Elmer-DeWitt on Apple's relationship with the media. How did the relationship evolve, is it changing and how is Apple addressing different media channels. Philip brings 30 years of experience to Apple journalism and provides some poignant anecdotes about Steve Jobs, the folklore of Apple and the disruption of journalism itself.
[The following was originally published on LinkedIn.]
The US is in the forefront of smartphone usage. This has not always been the case. Five years ago only 3 percent of US phone users were using a smartphone, lower than the global average. At the time Palm and BlackBerry were the prominent devices in the US while in Europe Nokia's push with Symbian and Microsoft's licensing of Windows Mobile led to a smartphone adoption rate of about 7%.
All that changed with the iPhone. After 2007 the US began to rapidly catch up and eventually overtook all other regions in terms of smartphone adoption. The latest data from comScore Mobilens shows that the US is now effectively 50% penetrated. The following chart shows just how quickly this happened.
In December 2009 only 17% of Americans used a smartphone as their primary phone. As of August the total reached 49.8%. By today the US is effectively a majority smartphone usage country and it looks like there is no slowing. We might very well see the US reach saturation with 80% smartphone usage in another two years.
Of course, the US is not the first country to reach this threshold. Some northern European countries were there earlier, but North America is the first major region to get there. That means over 115 million smartphone users in one market. As a result, the US has become the crucible of the whole smartphone market. It's where platforms are most concentrated in use and therefore the most sensitive to the effects of that usage. That leads to more innovation, more discovery of new use cases and more ecosystem growth. Quite simply, it's where competition is most heated.
This prominent position implies that the US could now be seen as a leading indicator of global trends. It might allow a keen observer to predict what will happen from US data. So what does the mobile platform rivalry look like in the US? We are fortunate because the data is finely grained in the US. We have montly updates from comScore and we get specific platform penetration data. The following graph shows the shares of the major platforms since late 2009.
It becomes immediately evident that BlackBerry has lost a huge part of its user base to Android and iOS. In 2.5 years share when from about 42% to 8%. In raw numbers that's 11 million users that switched to another smartphone.
Looking closer you can also see a consistent growth in share for the iPhone since mid 2010 with a slightly higher rate of increase of share than Android in the last few months. The problem is that this pattern of rapid decline in RIM and moderating growth in Android is not necessarily mirrored globally.
RIM just reported an increase in total users during the last quarter (from 78 to 80 million subscribers.) Google also recently reported 500 million Android activations globally with no apparently letup in growth.
So there seems to once again be a disparity between the US and global platforms. Do we take the US market to be anomalous or is it a pre-cursor to global trends?
Certainly the US market is in many ways unique with a very low rate of pre-paid usage and a relatively high ARPU and average device pricing due to subsidies. However, the global trend has been to increasingly mirror the US not vice-versa. The iPhone has radiated out of the US in terms of usage and so has Android. Attempts by other platforms to make inroads in the US have been unsuccessful. Symbian failed to gain a foothold and it seems Windows Phone is stumbling as well. Both of these platforms have had more success outside the US. The US operator subsidy model has also been "exported" more than pre-paid has been "imported". By 2007 Europe was moving away from subsidies as prices of feature phones were coming down and 3G was still in its infancy. That was reversed as the large screen smartphones became the device of choice. In addition to device and operator trends, most apps originate in the US and the major social media platforms are all American-based. In other words, the modes of usage are being conceived in the US.
On the other hand, the US is still a tiny percent of total consumption. It represents only about 6% of all phone users. Chances are that prices for devices in the US (especially the iPhone) can't be sustained for 5 billion consumers. Then there are "cultural" considerations where regions cling to their own usage habits and perceptions of value.
So it's still an open question of whether the US is the leading indicator for how platforms might change globally but I would watch this data very carefully. When it comes to mobile platforms, it might be that if it plays in the US it will play globally.
This is a quick note to mention that I'll be speaking at the Tools of Change (TOC) Frankfurt Conference this October on the eve of the Frankfurt Book Fair. Conference details:
You can get a 20% discount if you use the following code when registering:
TOCPartner20TSpeaker
I'll be speaking about the jobs publishers are hired to do. Without giving too much away, here is my synopsis of the talk:
We're inclined to "categorize" or "segment" media according to its attributes. We think of visual, auditory or written forms as distinct. Within each of these definitions of media we further sub-segment according to the way they are packaged. As in books, periodicals, or TV vs. film and albums and singles. These definitions are convenient because they describe the product and the product has evolved into a distribution chain and a therefore a market. It becomes therefore analogous to think of a book market and a TV market and a periodicals market as if these are what people actually desire.
But what people desire are more basic things. They desire to feel good or to be comfortable or to escape into fantasy or to be aroused. They have thirsts for knowledge or flights of fancy or needs for belonging. Authors and story tellers have sought to serve these needs for as long as we've been humans, regardless of the medium. When you step back and ask what the real "markets" are you realize that we've categorized according to technical and business means of delivering these needs.
Business theorists have a word to describe this categorization: segmentation according to product attributes. It's a common practice to define markets according to products rather than what these products are hired to do. The great Harvard marketing professor Theodore Levitt used to tell his students, “People don’t want to buy a quarter-inch drill. They want a quarter-inch hole!” The idea that you can categorize by what consumers want to get done rather than what you are selling them is not new but it's still a very hard thing to get your head around. It's become known as "Job to be done" segmentation and has changed product planning for many firms. If you apply this method to your industry you realize that the products you sell are in competition not with other products like them but with completely new products. A newspaper may be in competition with Angry Birds and a TV show with FaceBook and a Movie with a cinematic themed video game.
If you take the history of story telling and job to be done analysis into consideration you realize that technology has always played a part in how stories are told and re-told. This technological progress is accelerating and we are now in an era where apps are the new medium which can encompass much of any of the previous story telling mediums. Apps are so flexible and so easily distributed and consumed that they threaten to converge multiple media types. I'll explain how app economics are affecting not just games, but all forms of publishing.
This is a talk I gave today at Aalto University. It's a wide ranging talk and Q&A session lasting about 2 hours.
You can listen and see the visuals using the Perspective app on your iPad. Download the app (free from the App Store if you don't already have it) and open the link below using the iPad.
On October 5th, 2011 I asked Why is there no iPhone 5? The question was prompted by the pervasive media surprise that the 2011 iPhone launch was the "4S" and not a completely new design.
I answered this question with the conclusion that an iPhone "5" in 2011 would over-serve the market by offering more than most buyers would be looking for. That was because there could only be three groups of users the iPhone 4S would need to target: existing iPhone users, smartphone non-consumers and non-iPhone smartphone users. The majority of iPhone users in late 2011 who would be willing to upgrade were iPhone 3 or 3GS users and for them the 4S would be a huge improvement. Non-consumers would find the 4S attractive, as they would any iPhone; and existing smartphone users (mainly Android) would still be in their first contract and not likely to be looking to upgrade. Given the conditions at the time, the 4S was an adequate fit with customer expectations.
I wrote "The question will be very different a year from now when most early Android buyers will be looking for a new phone and when most iPhone 4 users (all 70 million of them) will be looking for a new iPhone. That would seem like a good time to introduce a new iPhone '5'."
It is now a year hence and we can consider how these same three targeted user groups see the new iPhone:
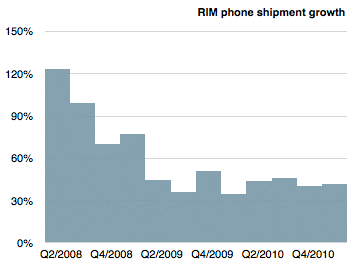
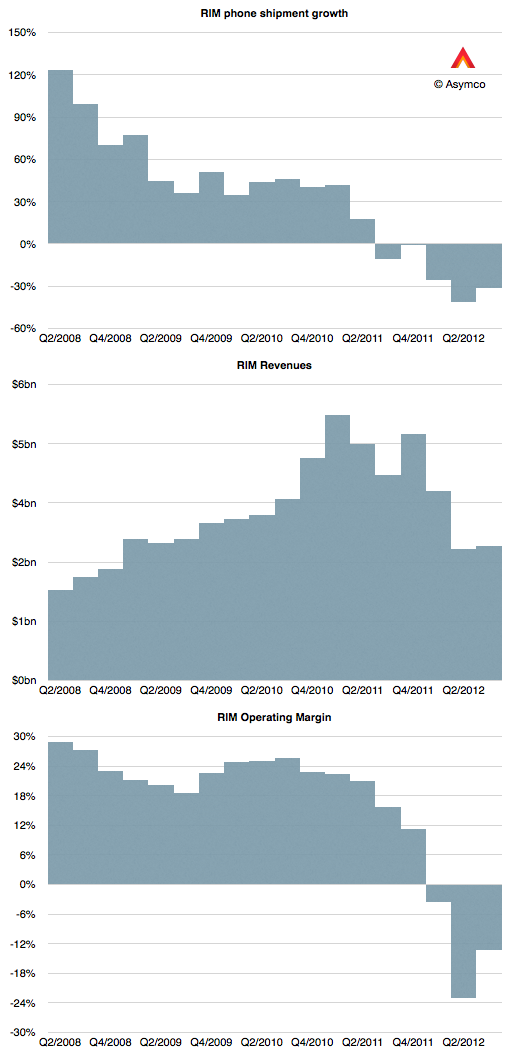
Quarterly financial data is often a lagging indicator of strategic success. RIM's vital signs were exceptionally strong up until early 2011. Consider the following graph showing RIM's device growth.
Using language commonly heard among analysts, one would say that the company was "reverting to the mean" and growing nearly in-line with the market. In other words, exceptional growth was over but continuing growth was likely. The company was returning to something "normal."
However, keen observers of the market would have been hard pressed to find any reason for justifying that performance. Seen through a disruptive lens, it was evident as early as 2008 that RIM's strategy was not sustainable. The company had a very weak smartphone product relative to emergent iOS and Android ecosystems. And yet, the company continued to prosper for nearly three years, through 2008, 2009 and 2010. Those shorting the stock during this period would have been unrewarded.
But then in early 2011 it fell off a cliff.
There was no reversion to the mean but an acceleration toward oblivion. The share price dropped to book value or below liquidation.
This pattern was very similar for Nokia. It too looked fairly strong on paper until early 2011 when it found it necessary to fling itself off a platform.
This pattern of disproportionate decline is a mirror image of the disproportionate ascent of Apple.
It might sound like a spectacular story; an anomaly, a once-in-a-lifetime reversal of fortunes. However, the moral of this story is that this is not an exceptional phenomenon. Disruption happens. It happens quickly and perhaps most quickly in this industry, and looking at trailing indicators like revenues and profits is of no help. I've only witnessed sharp expansions and sharp declines. I've never witnessed steady state, quiescent markets in technology. The history of platforms is always virtuous cycles followed by vicious declines. Whatever amplifies success seems to also amplify failure.
Rather than assuming that businesses are in a state of average growth or in some anomalous state above or below that average (from which they'll recover) we need to think of them being either growing or failing. Going straight up or straight down.
If this is the case, how can anyone expect to manage this? Orthodox management theory assumes continuity but the world seems discontinuous.
In a discontinuous framework it's important to look for unfair, unsustainable advantages that can be capitalized. Once exploited the advantage often disappears. The victim assumes it becomes sustainable. The survivor looks for another advantage. Resting is not an option and the mean is only an illusion.
James Allworth, Harvard Business School Forum for Growth and Innovation fellow and co-author of How Will You Measure Your Life joins Horace for an in-depth discussion of the vulnerability of Apple to low-end disruption. Specifically, assuming the iPhone reaches a point of over-service, did Apple arm its suppliers with the means to create its replacement? We dip into case studies of Dell, HP, HTC and Microsoft and touch on how iPod escaped this fate.
Tim Cook is quoted as having said the inventory is not only evil but that it's fundamentally evil.
With just-in-time production inventory can be reduced, at least work-in-progress inventory. Unfortunately inventory cannot be completely eliminated. The fact remains that you sometimes need to stockpile product for launch and need to have some on hand depending which way it's sold. There is also substantial channel inventory (which is off Apple's books but still evil) that needs to be in the hands of distributors.
Tight inventory management has become a characteristic of Apple and that contributes to getting ranked number one in Supply Chain Management. So we can expect that Apple runs a tight ship. In fact we have evidence of this through the ability to track our purchases from when they ship out of a factory in China all the way to our homes.
This tracking in itself shows that when product is in high demand production is initiated on direct consumer orders not just in response to maintaining a level of inventory. So with that in mind, we can revisit the question of how many iPhones 5 the company has produced.
First, we need to step back and recall the method for analyzing production. I built a model which attempts to show what a typical production run for an iPhone model would look like. I first published the process in early 2011. It used the historic data from iPhone 1, 3G and 3GS to try to predict iPhone 4 production. I've updated the model to show what that would look like today.
The assumptions driving the model are:
There has to be some inventory on hand during any given month (i.e. inventory cannot be negative.)
Inventory has to be kept as low as possible. Preferably below one full month of shipments in the month. This rule needs to be broken on launch as there has to be an attempt to meet first month sales, which are usually substantial.
There is an assumed mix of older variants equal to about 10% of current model sales.
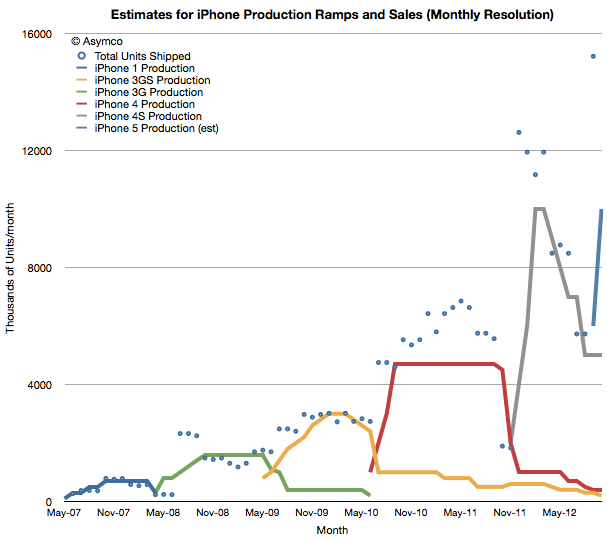
The results are shown below.
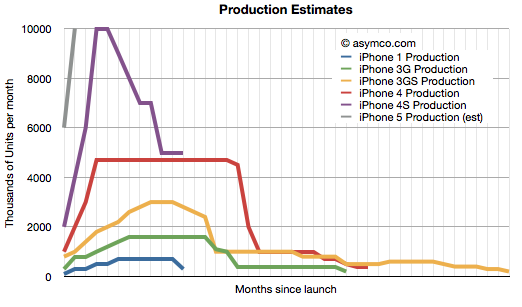
The solid lines are estimated production and the points are actual shipments (the resolution is monthly so quarterly shipment data is averaged over the months covered by the quarter and normalized for the number of days in a given month). Note that each product ramp differs slightly in shape but that overall there is a doubling of peak production. This is shown more clearly in this view where each production ramp is indexed to the same starting point.
The ramps roughly match the shipment data which assumes the JIT production method is being used. Note also that the start of production was roughly double that of the previous product run--consistent also with the spending on capital equipment (Machinery and Equipment as part of PP&E). Note also that the iPhone 4S was more "peaky" with a shorter maximum run than the 4 but that the 3GS also was peakier than the 3.
The iPhone 5 production, shown in grey, assumes 10 million units sold in September and a quicker ramp to maximum run rate. The need to have units on hand led me to assume 6 million units were produced in August and none prior to that. We don't yet know peak production or duration of peak production but my guess would be that peak will be well above 4S level, perhaps 15 million per month and that the run will be longer than the 4S.
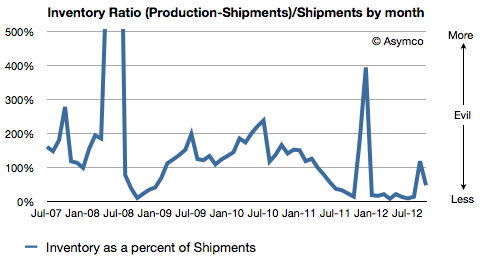
The maximum inventory on a monthly basis runs to about 6 to 7 million for the iPhone 5 but as a percent of total shipments, I'm assuming the performance is improving over time. The following chart shows this ratio:
For the sake of argument, I would create an equivalency between this ratio and the amount of evil present. My model is based on many assumptions and a mostly a work of (informed) fiction but it would not surprise me that the amount of evil is decreasing.
When Apple announced five million iPhone 5 were sold to end users over its launch weekend, I was surprised. Not because my guess had been around 6 million, but because the company had set expectations by announcing a doubling of pre-orders from the year-ago 4S launch.
Instead of doubling its performance for the launch weekend the company only sold 25% more units. How can there be this discrepancy? Is this a sign that demand is not growing at the rate we've become accustomed to? Is it a sign that there are shortages of components or labor or other production problems?
No, probably none of the above.
What we saw in the 5 million figure is what the company was able to deliver in the hands of buyers. It's possible that there were people who did not get a phone when they wanted it, and at the same time it's possible that some phones were available for sale and did not get bought.
This is because Apple offers the product through multiple channels. Some channels like Apple Stores may have gotten too many units while other channels like their on-line store, operator stores or retail partners did not get enough.
In other words, we have a situation of over- and under-supply (or over- and under-demand) simultaneously because the product is misallocated.
Can this really happen?
The fact that pre-orders were twice as fast indicates that online purchasing was much more popular. The company's press release suggested that only "a majority" of online orders shipped so far and we know that day one delivery of units was only offered to online buyers for 40 minutes.[1] At the same time some stores seemed to have plenty of stock.
This is easily explained. It's possible that this year a larger group of consumers decided that braving long lines is not their cup of tea. Instead, this larger proportion could have chosen to bravely endure waiting for a package at home rather than the companionship of their fellow man. Maybe the population of buyers is broader this year as one would expect from such a large base, and there are fewer who have the time or inclination to queue for a device.
If the shift to online from in-store was unforeseen, the company could easily have allocated too many units to retail and not enough to online resulting in weeks-long waits for orders placed online and relatively short waits in queues.
It's easy to fault the company for making this error. However, we can only calibrate our expectations on what we've seen before. If the company measured demand in its stores and on-line for three years and saw a pattern, it would make sense to allocate the limited supply according to the same pattern of demand[2].
But overall, the performance of the product is relatively solid. The iPhone 4S launched into seven countries in 2011 with a total combined population of 704 million and sold 4 million units in three days. The iPhone 5 launched into nine countries in 2012 with a total combined population of 721 million and sold 5 million in the same amount of time.
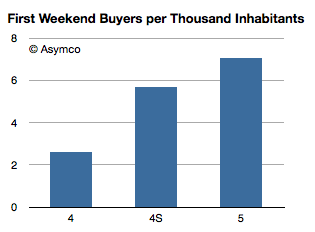
That means that 0.57% of the addressable market bought an iPhone 4S in three days and 0.69% bought an iPhone 5. A handier measure might be that 7 out of 1000 inhabitants in the launch countries bought an iPhone 5 in the first three days.
The pattern for the last three phones is shown below:
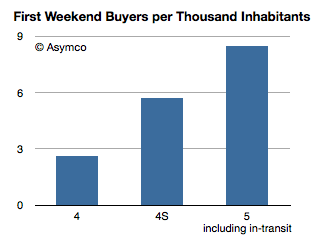
The growth from 4S to 5 is subdued, but it fails to account for the in-transit inventory. Assuming that due to the misallocation of stock, unfilled online orders number one million then the growth would look as follows:
For the markets iPhone launched in, this would be a fairly healthy take-up rate. Anecdotal evidence I've seen suggests that 1% penetration on day one is not uncommon.
---
Notes:
The fact that more than those initial promises were met means that the company quickly re-allocated stock and production to online after they sensed there was a problem.
Demand estimates are also driving the allocation of production capacity and capital expenditures for process equipment and pre-purchase agreements for components. All indications are that these allocations are running at the usual growth rate.
Horace and Moisés discuss the early consumer response to iOS 6 (Maps in particular), and how people appear to greatly prefer native apps to their web app counterparts. They also dig into just how large an opportunity cost Apple is capable of absorbing in the interest of protecting their platform. In doing so, they examine the native app vs. HTML5 debate.
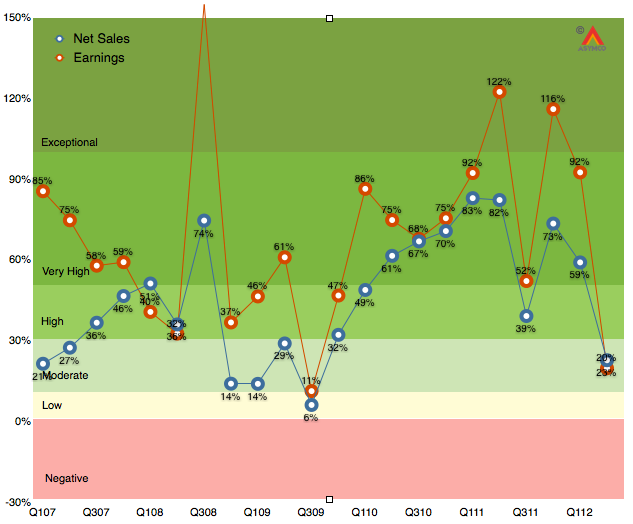
As the chart below shows, the last quarter (second calendar 2012, third fiscal 2012) was disappointingly moderate with 20% earnings growth and 23% net sales growth.
It was the first quarter since the iPhone launched that earnings growth has fallen into moderate (below 30%) territory. Much of that disappointment (to me) was the relatively low performance of the iPad following a launch quarter. The iPhone was weak as well, though that was expected. As I said last quarter, the iPhone is still the most important component but the iPad is becoming increasingly decisive in overall performance. In fact, I’m projecting that the iPad will have the same revenues as the iPhone had one year earlier.
The iPhone is going to be extremely difficult to project. On one hand we have the launch of the i5 which will account for about 10 million units in the quarter, on the other, chances are that sales were very weak prior to the launch as purchases were being deferred even more than during the last quarter.
So with these very meager clues, here are my estimates for the quarter (with y/y growth in parentheses):
iPhone units: 27.8 million (62%)
Macs: 5.6 million (15%)
iPads: 18.8 million (69%)
iPods: 5.6 million (-15%)
Music (incl. app) rev. growth: 40%
Peripherals rev. growth: 10%
Software rev. growth: 15%
Total revenues: $39.5 billion (40%)
GM: 42%
EPS: $9.75 (38%)
This earnings value would imply a trailing twelve months’ EPS of about $45.2. At the current price of $697/share the P/E would be 15.4. Cash and equivalents will probably increase to $125 billion or $131/share. Excluding cash, the P/E would be 12.5.
[Update. The EPS figure above includes a tax rate estimate of 30%. Company guidance was 25.5%. Using the company's guidance yields an EPS of 10.43. TTM EPS becomes $45.9/share and at $697 the PE is 15.2. At time of this update the share price has fallen to $665 and thus the pro-forma trailing P/E ratio is 14.5).]