Asymco

Asymmetric Intelligence

Industry

  1. Are Apple’s investments in PP&E extraordinary?

    Research · 33 comments

    In his recent posts Horace took a look at Apple’s fixed assets and their development over the recent years. He also tested the hypotheses that Apple is making investments into machinery & equipment on which iOS devices are produced by overlaying iOS volumes with preceding changes in property, plant and equipment (PP&E).

    The question that has arisen is: Are Apple’s investments in PP&E extraordinary?

    To answer, I have compiled the capital expenditures (CapEx) for our previously established peer group [1].

    But first we need to clarify what CapEx include and not include. CapEx includes investment into property, plants, equipment, office furniture, larger IT hardware and in some cases patents; CapEx do not include investment into long-term marketable securities or other long-term financial instruments, acquisitions or capitalized R&D. Furthermore, CapEx are gross values and are not net of any sold equipment [2]. CapEx are largely depending on a company’s business model and strategy. For example if you are a manufacturer you need equipment to operate, if you are a software company or a retailer, your business will not be capital intensive.

    As the second calendar quarter of 2011 is the latest quarter for which all companies have reported figures, we will take a look at last twelve months’ (LTM) figures from Q2/2011 backwards. The following stacked bar chart shows the combined CapEx of our peer group:
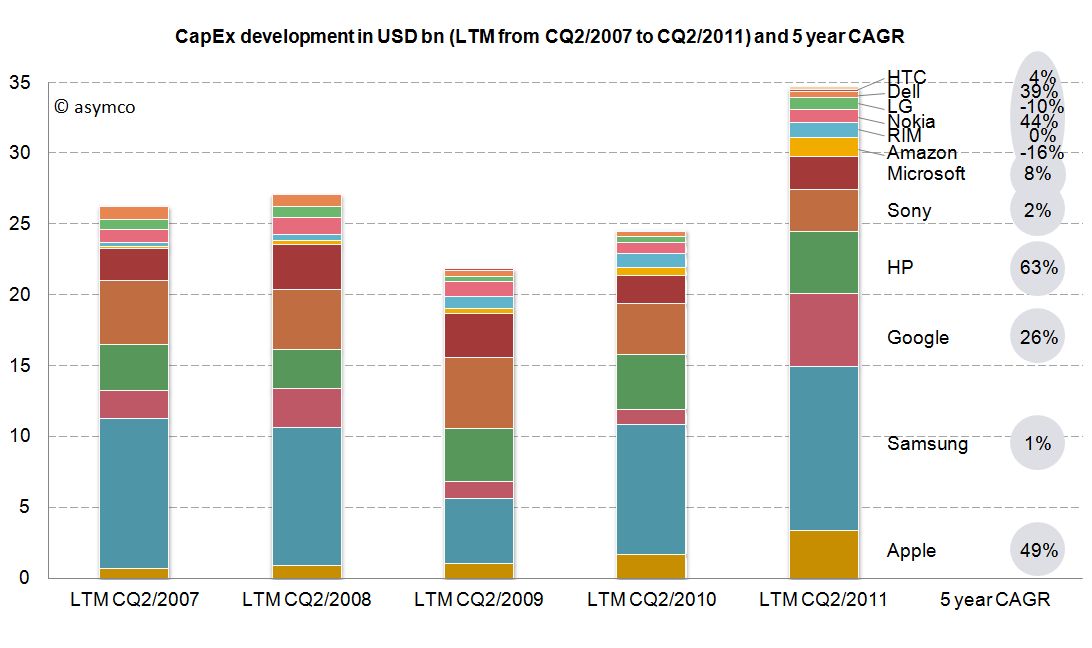
     

    The combined capital expenditures of our peer group for the LTM CQ2/2011 have outpaced even pre-crisis levels of investments and, combined, account for $34.7 billion. Samsung, a diversified manufacturer of IT hardware and other equipment, has invested more than $11.6bn with Google ($5.1bn), HP ($4.4bn) and Apple with $3.4bn following in line. While Google’s CapEx mostly account for its infrastructure of server farms and other IT hardware, HP’s CapEx mostly account for IT hardware it leases to its customers [3]. In absolute terms, Apple takes fourth place in CapEx spending for the last twelve months ending in CQ2.

    Since the business model and sales magnitude varies largely in our peer group, we can also take a look at a common measure to compare CapEx intensity by dividing CapEx by sales achieved in the same period. For the last twelve months we can depict the following chart:
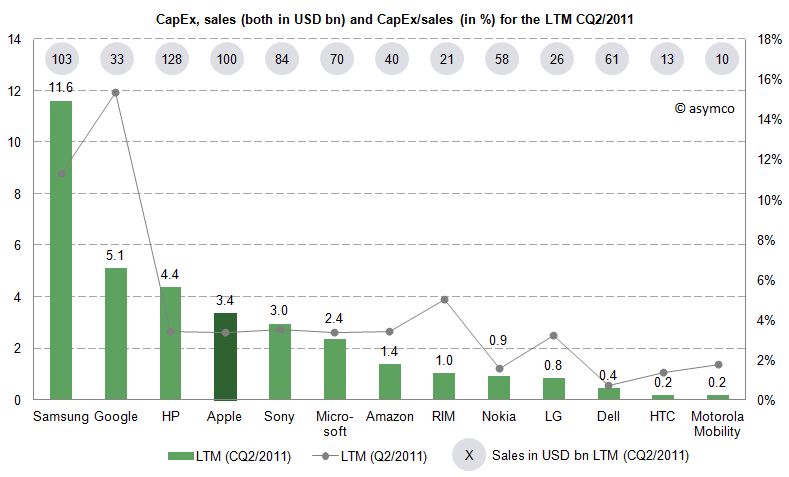
     

    The average of the peer group accounts for 4.4% of CapEx over sales. Samsung’s and Google’s business model are clearly more capital intensive, while Apple’s CapEx ratio of 3.4% is below the peer group average but above some of its peers like Nokia, Dell, LG, HTC or Motorola Mobility. Interestingly, capital intensity of HP, Apple, Sony, Microsoft and Amazon is at a comparable level of around 3.4%.

    As noted before, business models and strategies are significantly different among companies in our peer group. However, while Apple’s CapEx intensity is not extraordinary, Apple’s CapEx in absolute terms are among the largest in it this peer group and have grown constantly throughout a five year period.

    Is this a good thing and why does it matter?

    CapEx by itself does not tell us much. We still do not know in what companies specifically invest as financial regulations do not require detailed CapEx accounts. We know that even if a company is not growing assets they need to be maintained, upgraded and replaced – this spending is also called "Maintenance CapEx". Everything else can be called "Expansion CapEx" associated with new product launches, entry to new business area or geographies or expansion of (manufacturing) capacity.

    Therefore, Expansion CapEx is closely linked to expected organic sales growth in the future. So let’s go ahead and link CapEx ratio of the previous years with the sales growth of the following year. The following chart shows the cumulative average growth rate (CAGR) over the last four years versus the average of CapEx/sales ratio of the four last preceding years:
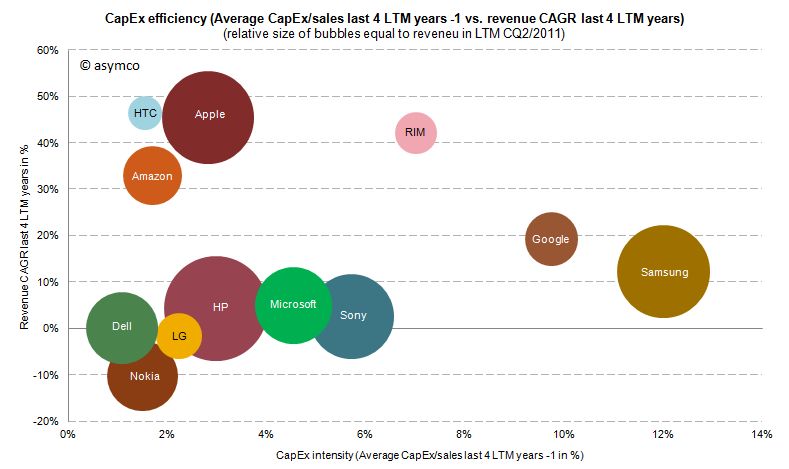
     

    We can see that high CapEx efficiency has been achieved by Amazon, Apple and HTC with sales growth rates of 33-47%. RIM reached similar revenue growth but with higher CapEx intensity. Google and Samsung with high CapEx intensity have only reached modest growth rates. Dell, HP, Microsoft and Sony have not grown significantly but have close to average CapEx intensity.

    We cannot state that CapEx in absolute terms have been extraordinary for Apple, but we can witness that with below average CapEx/sales ratio Apple outgrew in absolute terms Dell, LG, Microsoft, Nokia and Sony and has grown close to the revenue size of Samsung and HP in the last four years.

    ---

    Notes:

    1. Excluding Lenovo (not reported) and Acer (extra-ordinary low numbers reported, to be investigated), Motorola Mobility figures only available for the last six quarters
    2. Minor differences may occur due to local Generally Accepted Accounting Principles (GAAP)
    3. HP assumes ownership of these assets and rents them to the customers who in turn have a smaller balance sheet and can run IT hardware CapEx through the income statement as lease expenses
  2. How much do Apple's factories cost?

    Research · 87 comments

    In the last two posts (How much does an Apple store cost?, The down payment on iCloud) I discussed two line items in the PP&E asset class on Apple's Balance Sheet. In isolation, the data is interesting as it gives us an idea of the cost structure of stores and facilities being developed to sustain its current business model. In aggregate, it provides insight into Apple's strategic intent.

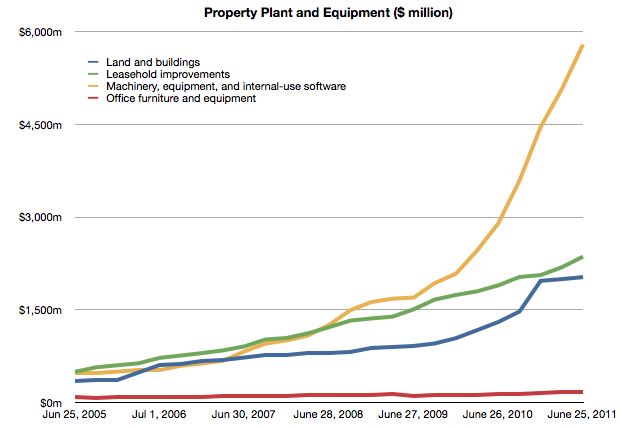
    To complete the picture, I will look at the third asset: "Machinery, equipment and internal use software." It's the yellow line in the chart below:

    It's plain to see at first glance that it's the most significant asset. What does it represent and what conclusions can we draw about Apple's strategy?

    Before I begin, I should make clear what this asset represents and what it does not represent. These expenditures cover equipment used in production. They do not include components used in the production nor loans to suppliers for purchasing equipment. These are fixed assets that can be depreciated on a schedule and have specific tax treatment as a result. These are, in plain language, instruments used for producing things to be sold. They are things Apple owns.[1]

    Using the same method as in the other asset analyses I took a measure of the sequential change in that asset over the time period and tried to see if there is a correlation between that spending and some other measure of output from the company.

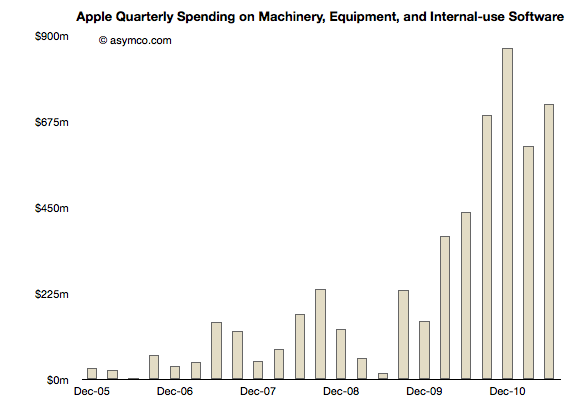
    Here is the sequential change chart since the end of 2005:

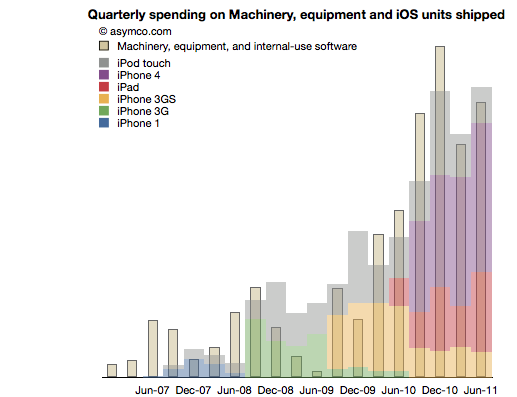
    I noted that the pattern seems to relate closely with the increase in shipments of iPhones. More specifically, iOS devices. To test this I overlaid the overall volumes (with estimates of product types) of iOS shipments. This is a modified version of the chart published here.

    There is a broad similarity. But again, as in the other analyses, the spending on assets typically predates the "output" from that asset. As we saw in land and buildings, the operational start of a facility may happen many quarters after the purchase is made. Similarly, stores open some time after the spending on fitting them out.

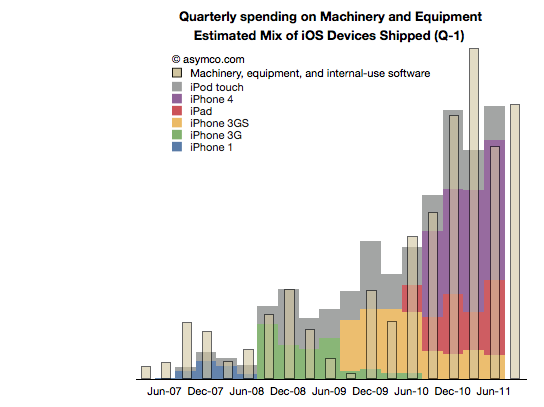
    So it is with Machinery and Equipment. If we time-shift the output one quarter to account for spending before production we have a better fit (note the change in the title with "Q-1" indicating that the dates for the iOS shipments are offset by 1 quarter to the left).

    We can even take the analysis further by breaking the spending and output into Phases corresponding to specific product cycles and introductions.

    Phase 1: The original iPhone

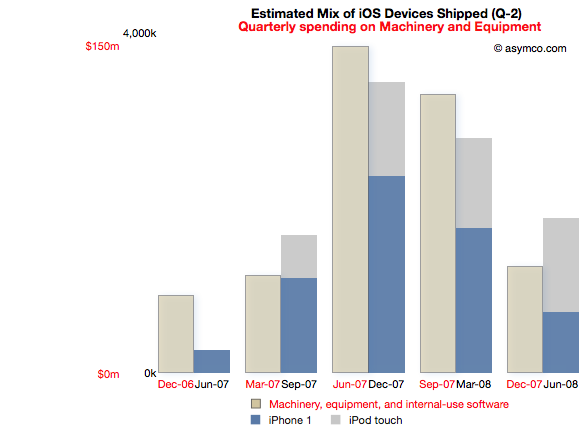
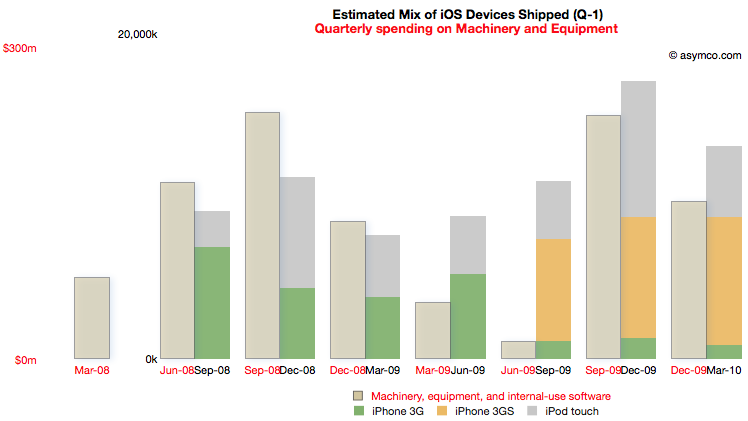
    Spending on M&E prior to the iPhone launch began two quarters in advance of sales. The following chart reflects this delay. Note that the M&E payments are marked with quarters ending six months earlier than the shipment schedule. Note also the scale (red denoting the M&E spending and black the units shipped). I also separated the two product types  (iPod touch are my estimates, iPhone numbers are published by Apple).

    This Phase corresponds to the first "bump" in the expenditure chart but offers more detail. There is an evident relationship between the "input" expense and the "output" of units shipped.

    The cost of Phase I was $408 million.

    Phase II: The iPhone 3G series

    Phase II covers spending from the quarter ending March '08 to December '09 and production from September '08 to March '10.

    For this Phase the time shift is only one quarter but there is a quarter's worth of spending that is initiated prior to any shipments. I chose to demarcate this Phase to cover production for both the 3G and 3GS as they probably shared a lot of common equipment. Some spending on new production lines however still had to happen as volumes increased during 3GS production.

    Note the scale change from the first Phase. Whereas the maximum in Phase I spending was around $150 million per quarter, the peak is nearly twice as much in the second Phase. The peak output is 5x higher.

    The cost of Phase II was $1 billion.

    [I had to guess whether the Sep 09 and Dec 09 M&E spending was for 3GS or whether it was to prepare for the ramps in the new products about to be launched in the third Phase.]

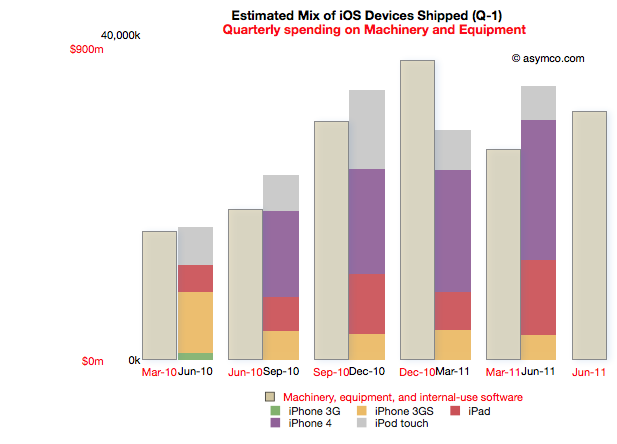
    Phase III: The iPhone 4 and the iPad

    Phase III begins with spending prior to the launch of the iPad 1 (March '10) to the last quarter (ending June 2011). Coupled to this is production starting in quarter ending June '10 and ending in the last quarter.

    Note that due to the time offsetting on production, the output from the spending on the quarter just ended will not be known until Apple publishes their shipments for the June quarter (scheduled for October 18th).

    The relationship between pre-dated spending and production one quarter later holds quite well. There is a "surplus" of spending in December 2010 but that could be seen as the ramp being prepared for the second iPad.

    Phase III cost is $3.7 billion so far.

    Note again the change in scale from the previous two Phases. Peak M&E expenditures are around $900 million per quarter while production peaks at around 35 million units. This is a tripling of spending coupled to about a doubling of output.

    Observations

    The data suggests spending on equipment is correlated with the volume of production of its iOS devices.  However, Apple is understood to be a company that outsources its production and does not "own" its own factories. Claiming that it keeps equipment used in the production of iOS devices on its books is an extraordinary claim.

    I make a further claim that the scope of spending itself is extraordinary.

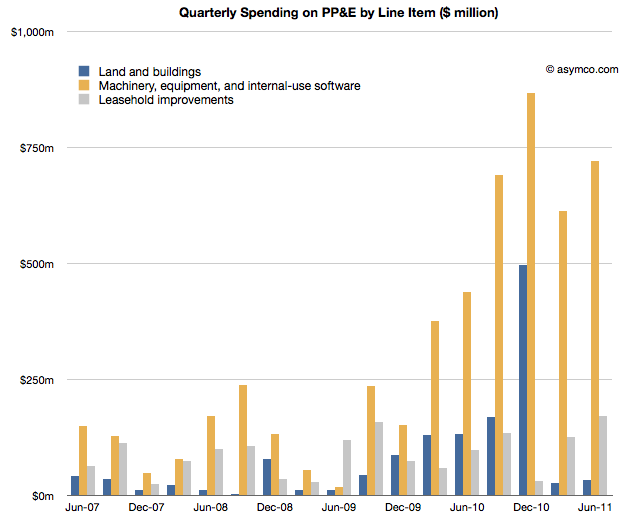
    The following chart shows the three asset classes discussed in the three latest posts relative to each other (quarterly change in asset value).

    In How much does an Apple store cost? I noted that the spending on leasehold improvements of $2 billion over a few years is significant and sustaining and largely asymmetric to competitors. You can see that spending in the grey bars above.

    In The down payment on iCloud I noted that spending on Land and Buildings is significant and sustaining to iOS but not on a scale many can match. Those costs are shown in the blue bars above.

    If, as I claim here, the yellow bars show the spending on Machinery and Equipment used in the production of iOS devices, then the commitment Apple has made to controlling production is even higher. In December 2010, M&E expenses were 50% higher than the spending on the data center and the new Cupertino campus put together.

    The M&E assets have cost a total of $6 billion. The Apple stores have cost $2.3 billion and land and buildings $2 billion.  In other words, Apple's machinery and equipment is worth much more than all its buildings and stores put together.

    Compared with what Apple spends on other fixed assets, M&E is spectacularly significant.

    In the twelve months ended June, Apple will have spent $2.9 billion in M&E to manufacture 118 million iOS devices. To put that in perspective, Nokia, which manufacturers a large (if not majority) of the 340 million phones it sells, expects full year 2011 capital expenditures of $1.1 billion.

    Correcting for amortization and depreciation and deducting some spending on Mac M&E, it's very likely that Apple spent twice as much as Nokia on the instruments of production for one third the number of devices.

    Conclusions

    It may be too early to draw conclusions from this analysis. The claims should be debated and the claims should be tested, but I can suggest some tentative strategic implications.

    Last December I wrote that I thought Apple should use its capital to own the means of production for iOS. I reasoned that device supply was its biggest deficiency and that perhaps ownership would allow them to become better at it.

    Indeed, Apple has used capital to ensure it has better control over the supply of components and to also perhaps ensure capacity of production of those components.

    But this analysis shows that Apple has gone much further toward integrating its value chain. It suggests that a large part of the tooling in its supply chain is owned by Apple. It suggests that those tools are put out of reach of its competitors.

    The implications could be profound but given the length of this post, I'll leave that discussion for another day.

    ---

    Notes:

    1. Some of the capital expenditures were also allocated to servers or "information systems hardware, software and enhancements." From the Annual Report 2010:
      Capital Assets. The Company anticipates utilizing approximately $4.0 billion for capital expenditures during 2011, including approximately $600 million for retail store facilities and approximately $3.4 billion for product tooling and manufacturing process equipment, and corporate facilities and infrastructure, including information systems hardware, software and enhancements.
  3. How much does an Apple store cost?

    Research · 75 comments

    Apple loves to talk about its stores. They do it in every conference call, keynote event and SEC filing. There is a monotony with the repetition of how many they have and how many they are building and how pretty they are. They start to seem like commodities.

    But if they were commodities why aren't there any other networks of successful "vendor stores"?

    The answer is partly in the odd integrated business model Apple maintains asymmetric to every other modular technology provider. Apple seems to want to control the relationship with the buyer. It's also partly in the uniqueness of design, an obsession with the brand. But still, that does not explain why can't it be copied.

    The answer is in the economics.

    To understand the cost of developing an Apple store, we turn again to the balance sheet. Fortunately for us, Apple reports details of a particular asset called "Leasehold Improvements." It's a substantial asset worth over $2.3 billion in the last statement. It represents "alterations made to rental premises in order to customize it for the specific needs of a tenant."

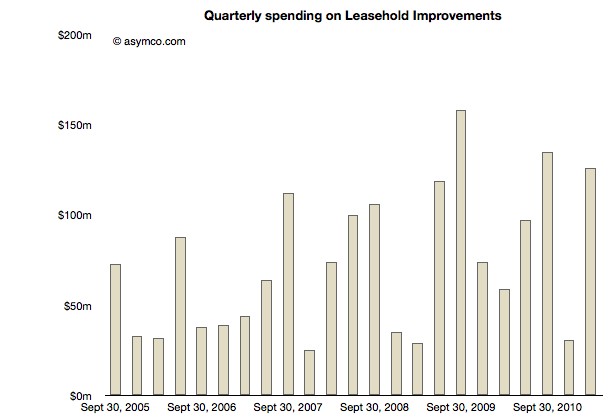
    The following chart shows the change in that figure quarter-over-quarter.

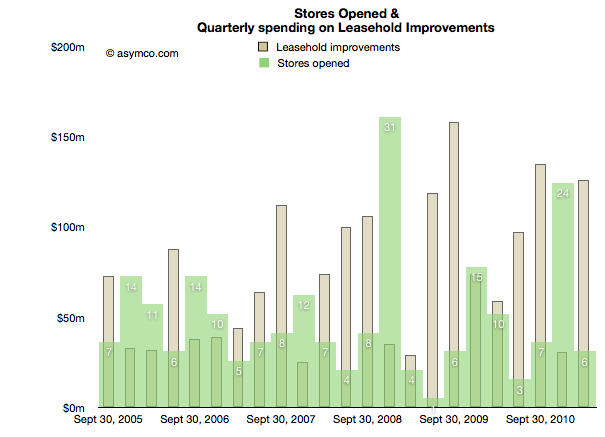
    Can we tie these expenditures directly to stores? I overlaid the number of stores opened in the same quarters as the expenses in the following chart:

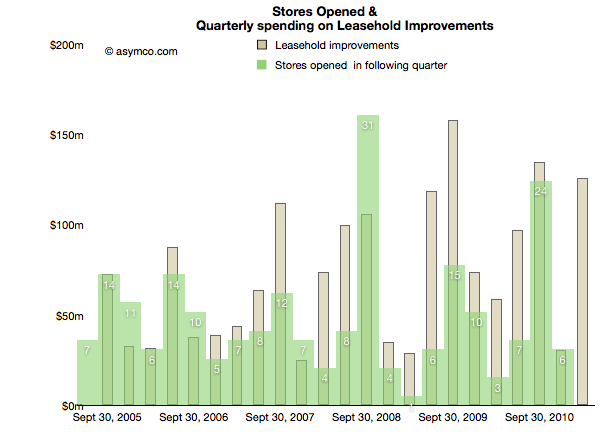
    There does not seem to be much correlation. But if we consider that spending happens before a store opens and shift the openings forward relative to expense by one quarter we have the following:

    This is a very consistent pattern. The rise and fall in expenses is matched by the subsequent rise and fall in store openings. We can even see how stores seem to be getting more expensive with the amplitude of the waves increasing relative to the amplitude of the openings.

    So if we are looking at store costs, just how much does one cost?

    Over the time period illustrated, Apple opened 220 stores and spent $1.9 billion in fitting them out. That's about $8.5 million per store. It's been increasing so it's probably closer to $10 million lately.

    That's an interesting figure by itself, evidence of how profitable they must be. But I turn the question again to competitiveness and the lack of response in kind.

    The data shows that if a company wanted to duplicate this effort they would need to commit to spending at least $2 billion. And that's just for "fixing up" the sites. This figure does not include the lease itself, the cost to operate (including the tens of thousands of employees) or the inventory within. It also does not include the value of choosing the right locations (though maybe a follower could simply choose to locate in the near proximity to an Apple store.)

    So assuming a competitor (e.g. Microsoft) did commit to this spending, how would they recover it? I'll keep this question rhetorical, but the hint must be in the unique way Apple is integrated as a business.

  4. At $2.9bn/yr apps are challenging songs as the most valuable online medium

    Research · 16 comments

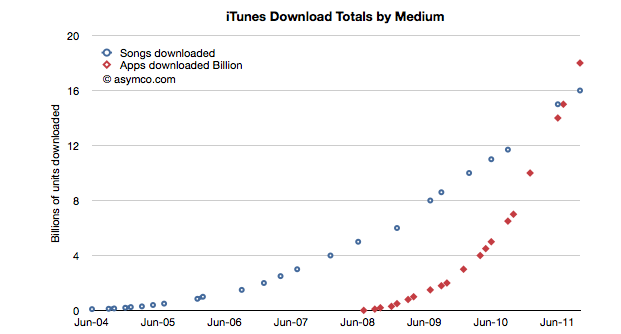
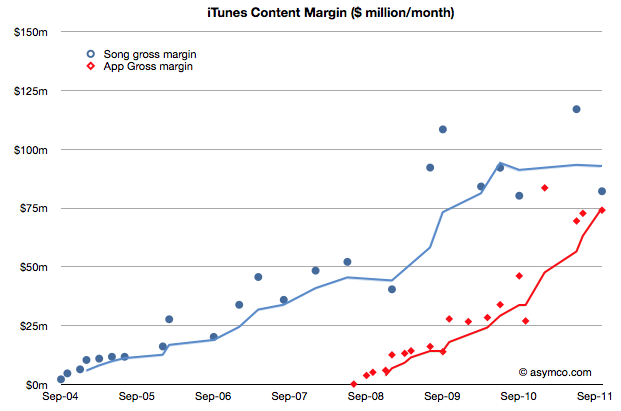
    During the October iPhone event Apple gave an update on the app and song download totals. This is a reliable gauge of the iTunes ecosystem performance and Apple has been supplying these numbers for several years.  Plotting these numbers gives us a good idea of the trend in mobile content consumption. Here is the data to date:

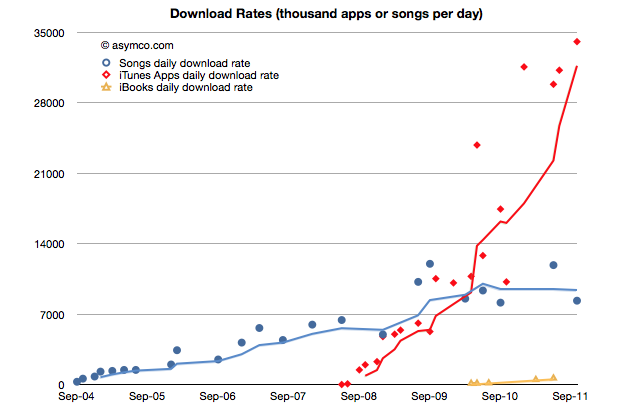
    The total number of apps downloaded (excluding updates) overtook songs in June/July and continues on its trajectory. In fact, the rate of downloads for Apps is now over 1 billion / month. Given the data points above, I calculate it to be about 34 million per day. The corresponding rate for songs is 8.3 million per day.

    You can see the rate of downloads as it's changed over time here:

    I used trailing four periods' moving average for the lines to show the trend more clearly. The gap in download rates is large and increasing.

    Now most observers would note that songs are much more expensive than apps, especially since there are no free songs and many apps are free. This would imply that the music business is probably more valuable than the app business.

    That's true, but not by much. To determine how much, I used the other data point offered: $3 billion in payments to developers. Since that represents 70% of gross revenues to Apple, we can determine that the average price per app is now 23.8c (down from 28.5c in April 2009)[1]. Knowing the app price we can plot both revenues and the margin that Apple keeps.

    We can compare that with the margin that Apple keeps from songs (assuming a price point of $1.2 per song and a 73% pay-out to labels.)

    The data jumps around quite a bit but the trend is pretty clear. After paying the content owners, iTunes is left with about $75 million per month from apps and $85 million per month from songs.

    Apple then needs to pay other direct costs like credit card processing, bandwidth, storage, curation and testing. Then there are other operating expenses like R&D and marketing. These costs add up such that, according to Apple, they cover revenues, yielding a break-even operation.

    Break-even or not, the way the data is trending it's pretty clear that Apps will be responsible for a the majority of content cash flow at Apple.

    At a billion downloads a month (and rising) the value in terms of revenues is already a run rate of $2.9 billion per year. This has been enough to overtake a business that has been running for more than seven years.

    ---

    Notes:

    1. The payments to developers probably includes in-app purchases.
  5. iOS vs. Microsoft: Comparing the bottom lines

    Research · 60 comments

    I began comparing Microsoft and Apple's financial performance with a review of "top line" or revenues by product lines over a four year period.

    This post is about the "bottom line" for the same companies and products.

    Before I jump in I would like to make sure there is no confusion about the terms. I will be comparing "operating income"[1] as a measure of "bottom line". This is a common way to compare the profitability of companies because it excludes taxes and interest income. These non-operating expenses/income can distort a comparison of performance because they can be the result of investment activity or changes in tax law or where the company is domiciled. One should not make judgements of comparative performance on those non-operational bases.[2]

    Another challenge is that some companies report operating income by division while others don't. We can usually compare overall operating income but usually not on a division or product-level. This is the challenge I will try to overcome in this analysis between two very different operating models.

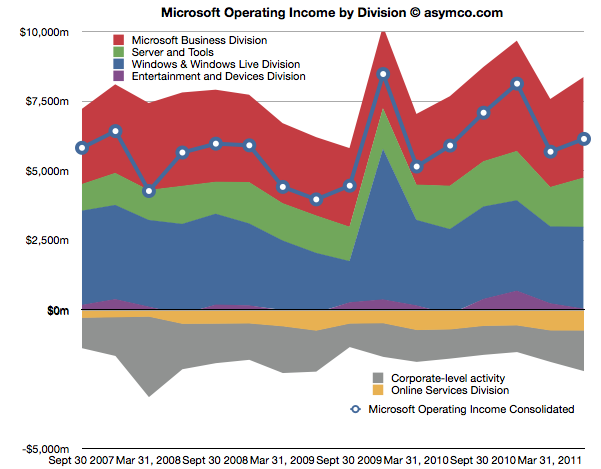
    The first chart shows Microsoft's Operating Income by Division as reported by the company.

    Each area represents a business division. Note some are showing negative income (losses).I've added a line representing consolidated operating income which is the sum of all areas (including the negatives).

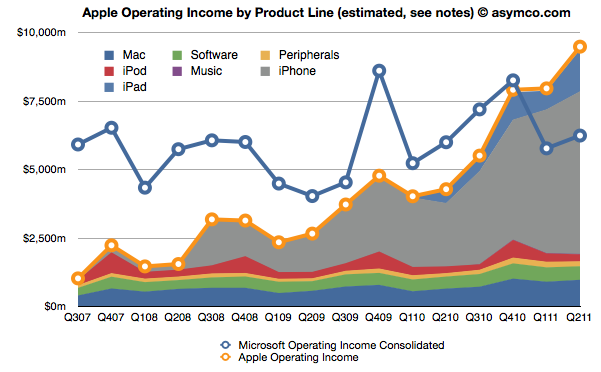
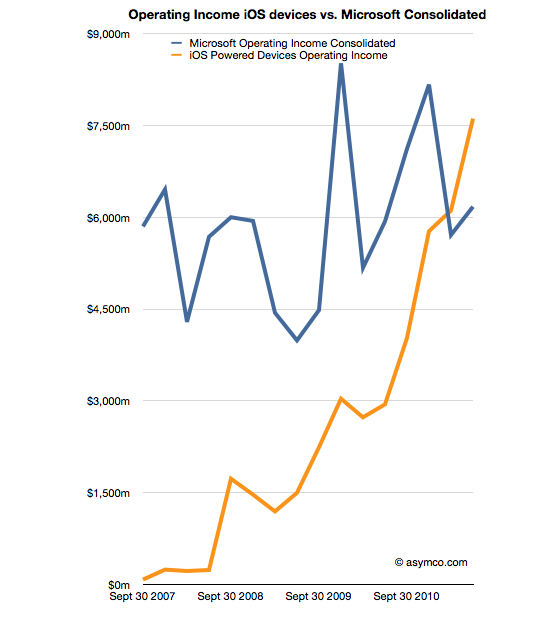
    The same line from the chart above is super-imposed on the chart below and is comparable to the orange line that represents the operating income that Apple was able to obtain over the same time frame. Note that both axes are using the same scale.

    The Blue and Orange lines are indisputable but the allocation of the areas under the orange line may be open to debate.

    As Apple does not report a break-down of each product line or division, getting the areas in the Apple chart is a matter of analysis and estimation. The method I used was to estimate gross margins per product (the overall gross margin is known) and assigning a portion of OPEX (also known) in a ratio equal to the sales level of that product. [3][4]

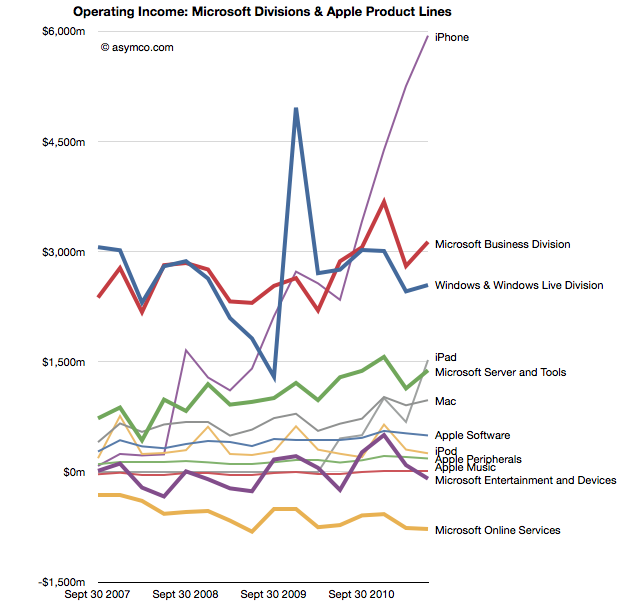
    To make the contrast sharper (though more cluttered), I took all operating incomes from all product lines and divisions of both companies and laid them out as time series line charts in the following chart. I allocated Corporate Level Activity as an expense proportionate to each business unit in a ratio proportional to its sales. This allows comparison of product lines individually.


    Finally, I combined all the iOS product lines (iPhone, iPad and iPod touch est.) as one line and laid it alongside overall Microsoft Operating Income (consolidated).

    The second chart in this post showed that Apple has reached higher operational profitability than Microsoft by the end of last year. This fourth chart shows that iOS products combined are more profitable than Microsoft as a whole.

    Microsoft invented the software business and built it to become the world's most valuable business by the year 2000. It's still been growing since and after 35 years it is reaching a profit of $27 billion per year. It did this while maintaining enormous margins and a highly disruptive monopoly business model the likes of which the world had never seen before.

    It is scarcely believable then that a device business has been created to overtake it in four years.

    ---

    Notes:

    1. The operating income is almost the same as EBIT  which is explained here: Earnings before interest and taxes - Wikipedia, the free encyclopedia.
    2. On the other hand, one should not use Gross Margins alone. The crucial difference between Gross Margin (Sales Revenue - Cost of Goods Sold or COGS) and Operating Income is that fixed costs are also accounted for. These fixed costs are typically Selling, General and Administrative Expenses and Research and Development Expenses (commonly summarized as Operational Expenses or OPEX) which can be allocated to a particular business or division. For different business models, gross margins can be widely different. In the case of Microsoft for example, software has negligible direct variable costs. A CD or download is of tiny cost compared to the price of the license to use it. As a result software often has 80% gross margins. Hardware on the other hand can have very thin margins in single digits (e.g. PCs). Conversely, Microsoft will have very high fixed costs to pay for developers, product management and sales forces. A hardware vendor may have few engineers and sales could be handled through resellers. Thus Microsoft will have very high OPEX and a PC company will have very low OPEX.
    3. So, for example, In Q2 '11 the iPad had an estimated gross margin of $2.06 billion (which assumed 34% margin on published revenues of $6.06bn). As it also was 21% of total revenues that quarter, I assigned 21% of OPEX to the iPad. That means 21% of $2.54bn or $540 million was the operational expense allocated to the iPad. This results in operational income estimate of $1.52bn for the iPad in Q2.
    4. To summarize, the assumptions this estimate depends on are gross margin estimates and the allocation of OPEX in proportion to sales. Gross margin analysis has been a matter of iteration and peer review for some time and I'm fairly confident in my estimates. The allocation of OPEX is more arbitrary. Chances are that these expenses vary greatly with each quarter where more work is done nearer to launch of a new product and less in late season. If there are better methods available to allocate expenses by product, I'm open to suggestion.
  6. Decoding Steve Jobs: Select Commentary from HBR.org - Harvard Business Review

    Research · 2 comments

    Announcing a new HBS PRESS BOOK

    Decoding Steve Jobs: Select Commentary from HBR.org

    by Norm Smallwood, Kate Sweetman, Dave Ulrich, Rosabeth Moss Kanter, Jeffrey Pfeffer, Horace Dediu, James Allworth, Max Wessel, Rob Wheeler, Bill Taylor

    Source: Harvard Business Press Books

    14 pages.  Publication date: Sep 22, 2011. Prod. #: 10973-PDF-ENG

    "The news of Steve Jobs's retirement from Apple may be losing steam but observations on his legacy - and Apple's leadership future - are only beginning. In recent years, leading thinkers have contributed their thoughts on the Jobs phenomenon on HBR.org. We've compiled a few of the best here, and we invite you to read them through the lens of business lessons to be learned.' We've selected six pieces: two from after Jobs's August 2011 announcement and four from before. We hope you will enjoy them, learn from them, and continue to turn to HBR.org for ideas and inspiration.

    Available for download for $1.99 via Decoding Steve Jobs: Select Commentary from HBR.org - Harvard Business Review.

  7. OS turning circles: Questioning Windows' maneuverability

    Podcast · 128 comments

    [Updated with Mac OS versions. See footnote 3.]

    I'm glad Windows 8 is named the way it is. With Windows 7 Microsoft went to a numbering system which is much more rational than the mixed naming of the past. The number 8 actually corresponds to the actual sequential number of major versions of Windows released to date.

    Windows proper actually did not start with what was called "Windows 1.0". Windows actually started in April 1992 when Windows 3.1 was released. It was the first Windows which was an operating environment onto itself, apart from DOS. It was followed by Windows 95 (which we can call "2"), Windows 98 ("3"), Windows 2000 ("4"), Windows XP ("5"), Windows Vista ("6"), Windows 7 and now Windows 8.

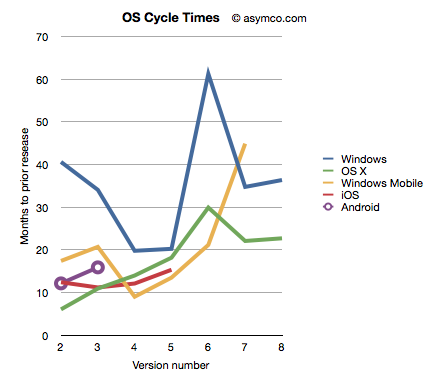
    Given this nomenclature and the dates of general availability of said versions, we can derive a measure of the frequency of upgrades. For example Windows "2" followed about 41 months after "1" and "3" took 34 months after "2". If we continue this for all the versions, and assume "8" will launch by October next year, we can plot the cycle times of new Windows versions.

    To make the story more interesting I added the same data for other OS platforms. OS X, iOS and Android have version numbers which correspond to the sequential order in which they were released. I am assuming that the numbering system (1.0, 2.0, 3.0 etc.) are meaningful and that major releases are given a new integer value.[1]

    I also added Windows Mobile which suffered from the same confused numbering that Windows suffered until the current Windows Phone 7. To create a map to integer values I used the following: Pocket PC 2000 is "1", Pocket PC 2002 is "2", WinMo 2003 is "3", WinMo 2003 SE is "4", WinMo 5 is "5", WinMo 6 is "6" and Windows Phone 7 is "7". There is no clarity when and what Windows Phone 8 will be so that is left off the chart.

    The chart above does give a clue that Windows is a bit slower (more months between releases) than alternatives. However, the point I want to convey is that this cycle time can be a strategic advantage. A faster upgrade cycle means more rapid adoption of improvements, not to mention more revenues. Rather than a line chart, the better way to visualize it is as a turning circle.

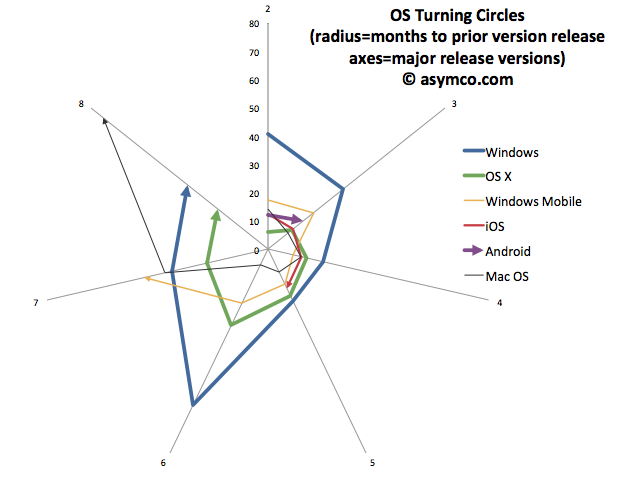
    The analogy is from aerial combat where a plane that can "turn inside" an opponent can get into a firing position. The tightness of turning circles also means that a competitor can iterate more quickly and thus move up the trajectory of improvements necessary to remain competitive more rapidly. To that end, I re-plotted the data above with radial axes.

    The chart clearly shows how among desktops, OS X has been tighter than Windows[3]. Furthermore, mobile OS's have been, typically, more agile than desktop OS's. The exception being Windows Mobile which had significant architectural and business model challenges. It will be interesting to watch the radius of Android. So far it seems to be tight, but as tablet functionality has been added, the speed of change has slowed slightly.

    However, the big contrast is between mobile and desktop. Microsoft tries with Windows 8 to merge the two. But these are different ecosystems. Buyers, OEMs, users, all have different behavioral patterns (jobs-to-be-done) for mobile OS vs. desktop/portables. Will the cycle time for Windows 9 and Windows 10 tighten up? Can Microsoft operate its OS division at this new cycle time?

    What is even more bad news is that the most important customers for Microsoft, enterprises, actually upgrade every other version. The Windows "radius" is nominally averaging about 35 months but large account adoption is closer to 60 months.

    The contrast is then striking: Consumerized devices with over-the-air updates on a 12 month cycle are five times more agile than a traditional corporate Windows desktop. Another way to look at this is that for every change in a corporate desktop environment, the average user will change their device experience five times. Although Microsoft might find comfort in Enterprises' leisurely pace of change[2], those are the wrong customers to keep happy going forward.

    The implications are left as an exercise to the reader, but I would argue that along with the asymmetry in business model around pricing that I highlighted in the last Critical Path podcast, Microsoft has a significant operational asymmetry with devices as a new class of computers.

    ---

    Notes:

    1. The dates of general availability of various versions of operating systems.


      Version
      Windows
      OS X
      Windows Mobile
      iOS
      Android
      1
      4/6/92
      3/24/01
      4/19/00
      6/29/07
      10/21/08
      2
      8/24/95
      9/25/01
      10/1/01
      7/11/08
      10/26/09
      3
      6/25/98
      8/24/02
      6/23/03
      6/17/09
      2/22/11
      4
      2/17/00
      10/24/03
      3/24/04
      6/21/10
      5
      10/25/01
      4/29/05
      5/9/05
      10/1/11
      6
      11/30/06
      10/26/07
      2/12/07
      7
      10/22/09
      8/28/09
      11/8/10
      8
      11/1/12
      7/20/11
       
    2. While at Nokia's Enterprise Solutions I was witness to this difference between the cycle time of devices and the pace of adoption of Enterprises. The fundamental disconnect was that the sales cycle for a "solution" was longer than the shelf life of a device upon which that solution was predicated. Needless to say, Nokia Enterprise Solutions did not last long. Nor do we see today any significant Enterprise-focused mobile device businesses (RIM itself moved to consumerize its products years ago.)
    3. I added Mac OS data to the second chart to also illustrate that no company is immune from spinning out of control. Mac OS clearly went spun out after version 6 with increasing delays leading to its demise and replacement. You can also note that its replacement (OS X) was able to straighten-up and fly right. The lesson may be perhaps that ditching and starting over is a viable option.
  8. RIM and the lamentation of the analyst

    Research · 76 comments

    RIM shipped 10.6 million Blackberries and 200,000 PlayBooks in the last quarter. Management noted that their sell-through was significantly higher for Blackberry (13.7 million) but seems to be very weak for PlayBook as the prior quarter saw 500k units shipped. Additional PlayBook units this quarter probably mostly went into new channels in Asia and there were no additional sales into North America or Europe.

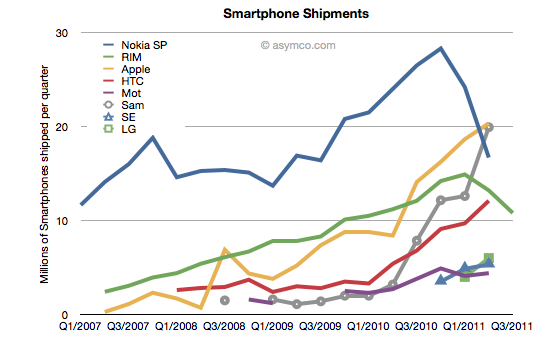
    The figures for units are very poor. How poor depends on the frame of reference. Consider the shipment chart below:

    In terms of the competition, 10.6 million units is less than half what Apple or Samsung sold in its prior quarter. It's also less than what HTC sold. RIM's volume rank will likely go to fifth place as a smartphone vendor.

    In terms of its performance relative to its own history, the Blackberry volume dropped by 11% year-on-year and 18% sequentially. This is the second quarter that shipments shrank.

    In terms of market share, we'll have to wait for the competitor data over the next six weeks but the market has been growing at an average of 77% for four quarters so any continuation of this trend would imply RIM's share dropping to single digits.

    Finally, the biggest shock has been the decline in profitability. It seems that operating margin dropped from 21% to 13%. The company did incur some one-time charges for recent layoffs, but even without that charge, the margins would be around 16%. This is most alarming. The reason for such drops is that as volumes decrease fixed costs don't decrease as rapidly or at all. The company still needs to keep sales, administration and engineering staff around and they become a larger part of the operating expenses (vs. the component costs which vary with volume of goods sold).

    This effect is well understood by financial analysts and the stock price shows it with a huge drop.

    But stepping back to look at the picture above, there is a clear turning point in the company. You can see the elbow in the curve for volumes whose effect is felt so deeply. What's curious is why the pivot occurred when it did. We can point the finger to competition as the cause. But why was there no effect in the company's fortunes when the competition actually emerged. It's been years since the iPhone and even Android entered the market. Yet we see an impact on Nokia and RIM individually at apparently arbitrary points of time.

    This is the lament of the analyst: you can clearly and accurately state what will happen but when remains a mystery. It's the elasticity between obvious causes and their effects that makes this an inexact science or not a science at all. In retrospect, you can say that Nokia's pivot was triggered by its public execution of Symbian, but that assumes that it was preventable--which we know is not the case. But what caused RIM's change of growth, exactly? Why did it happen this past spring? Why didn't the company volumes begin to decline as iPhone and Android boomed in 2009 or 2010? For quite some time RIM seemed immune to competitive pressure. We all were made fools as we called its imminent demise. Then, as Steve Jobs would say, boom!

    ---

    Footnote:

    Piecing together RIM's performance is becoming more difficult each quarter. The data being presented is increasingly obfuscated by irrelevant detail while major information is omitted. This last management presentation was full of holes, namely:

    • We have no idea of device pricing. Valiant efforts have to be made to piece together that aspect of the business. Matt Richman does a good job but it still requires some guesswork regarding PlayBook pricing to back out Blackberry pricing.
    • Management detailed where Blackberries were selling-out but only detailed sell-in for the PlayBook. Obvious spin.
    • They are cherry picking the data they present and each quarter it's a different story making pattern recognition impossible.

    This leads to an erosion of trust. Observers are faced with the problem of increasingly guessing what is happening each quarter. For instance, regarding pricing I prefer to include service revenues in the analysis of device sales because device+service is what is being bought by the user and vendors which can offer services as part of the device get a justifiably higher value for the product--value that I think needs to be considered as advantageous. Nokia and Apple also account for services (though not apps) as part of device sales and it makes it more convenient to compare these businesses.

    Given RIM's smokescreen, this quarter I decided to stop trying to guess Blackberry pricing and used Operating Income/Units sold as the average selling price.


  9. Mobile Impossible

    Research · 23 comments

    In yesterday's post about the "biggest mobile loser" I covered the exodus of users from non-smart devices in the US and EU5. I also said that what happens in those regions tends to happen in other regions with a time shift. In some regions it happens quicker but in most it happens more slowly.

    But can we be sure that there isn't vast non-smartphone growth in other regions? Well, no, we can't be sure. At least not without access to reliable data.

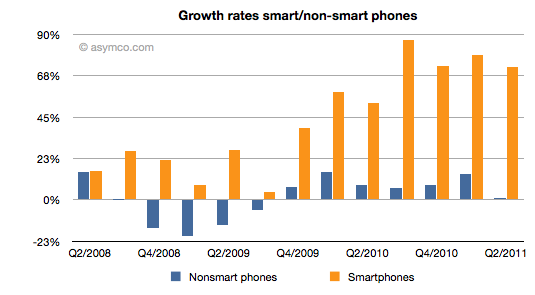
    But what we can track is the overall non-smart phone market and compare it to the smartphone market. Here are the growth rates of the two sub-markets:

    The difference is plain to see. We can also note that the non-smart market may be heading into a contraction--something noted by some analysts close to the market--but no real sign of that happening in smartphones.

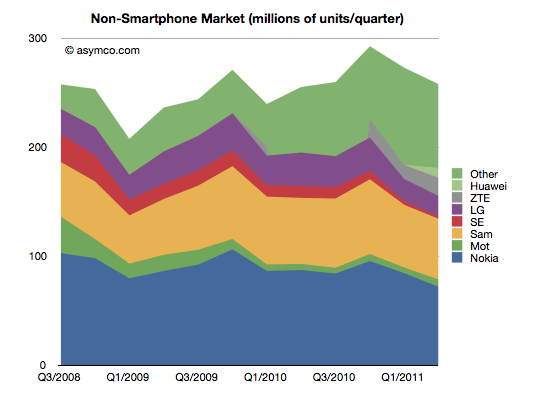
    Beside growth, we can also see actuals and the split of various vendors' volumes in the market.

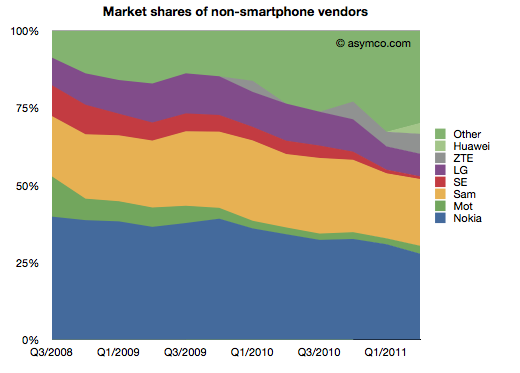
    It's also clear that the top line has not moved much in the last few years. Next, the shares of the vendors.

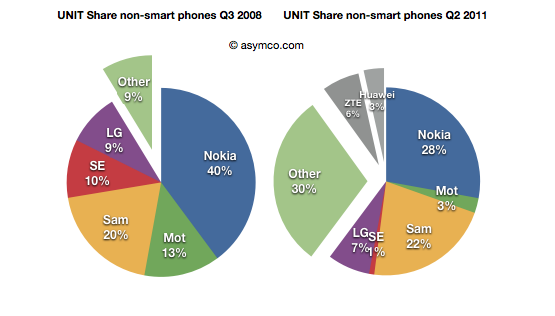
    Finally, the before-and-after share pies.

    We can see that the growth story, if there is one, is coming from low-end entrants. In late 2008 the main brands had 90% share. They now have about 60% (in a flat market.) The growth is all from "Other".

    What seems to be happening is that buyers in mature markets are swapping (or upgrading) from non-smart to smart and adopting new smartphone brands. At the same time, new users in emerging markets are increasingly adopting new non-smartphone brands.

    So the question for the incumbent vendors is extremely important: Facing them are low-end and smartphone entrants engaged in a pincer movement, with obvious success; can the old brands survive?

    The answer, as always, depends on whether the competition is symmetric or not. Low end competitors are usually structured around low cost structures. High-end competitors are exploiting new markets and new business models. For an incumbent to survive and fight on both fronts they'd have to adopt both of these models for themselves, simultaneously and quickly.

    We can see that Sony-Ericsson and Motorola (Google) have thrown in the towel on the low end. The question of dual-front strategy is mainly relevant only for Nokia, Samsung and LG. LG is on the ropes and may actually be ready to exit the market so that really means Nokia and Samsung. Nokia has signaled continuing interest in the non-smart market (citing "the next billion users"). Samsung also seems to be hanging in there. Can they do it?

    I cannot stress how difficult this is or how rarely it has been achieved. The two approaches are if not opposites then at least orthogonal. It's like Mission Impossible. You can't be a low cost global vendor while investing in R&D for differentiated platform-based devices. These are shaping up to be businesses requiring completely different skill sets. Few have the ability to host these skills inside one company. I can think only of one example.

  10. Biggest mobile loser? The non-smart phone

    Research · 15 comments

    Yesterday comScore published survey results for EU5 (France, Germany, Italy, Spain, UK) on smartphone use and installed base. The headline is very similar to what would be written about the US: Android had phenomenal growth over the last twelve months. I also noted that the apparent growth of Google (16.2% share change) seemed to be matched by an apparent decline of Symbian (-16.1% share change.) However the reading of the data is not so simple.

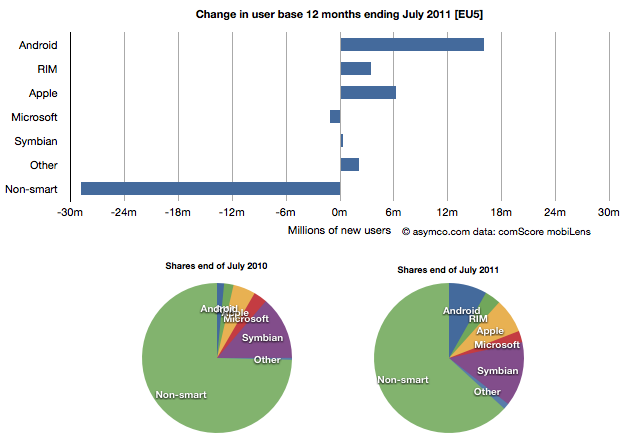
    In order to understand what has happened to usage, it's much more valuable to look at consumption and the actual number of users rather than change in share of a subset of the market. Consider the following charts:

    The bar chart shows that three platforms gained users in the last year (ending July) and that there were negligible losses in users by others. Negligible except for non-smart phones. A remarkable 29 million users moved from non-smart phones to smartphones. Those switchers switched into Android (16 million), iPhones (6.3 million) and RIM (3.4 million). Symbian even gained about 330k users. Microsoft lost about 1 million but its platform has not been actively promoted in that time.

    When seen as a pie chart, you can see how the usage shifted from non-smart to smart even more clearly. It does not appear that Android took share from Symbian at all. Android took share from non-smartphones. The table in the link from comScore leads one to conclude otherwise.

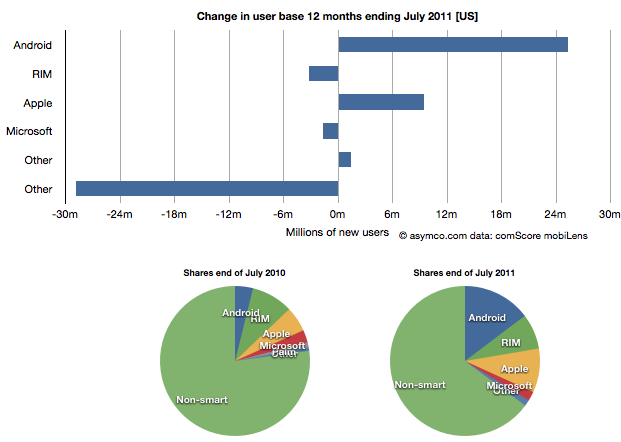
    I took the same approach to look at the US data (also from comScore). It shows a similar pattern.

    In the US, RIM was a net usage loser but its losses also paled to the losses of non-smart devices. In comparing with EU5 the pattern is very similar.

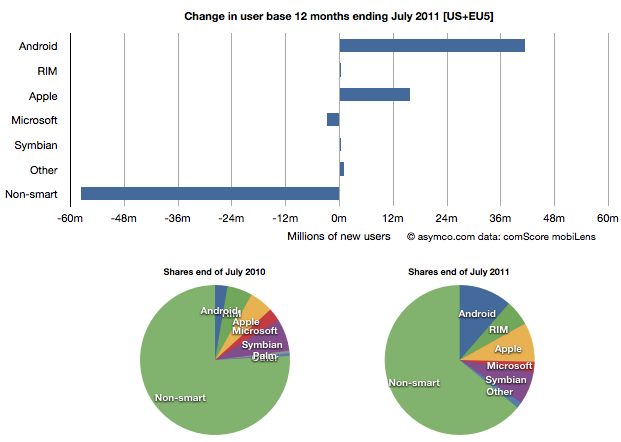
    I then combined the EU5 and US data and provided a view into the combined markets (note scale change from previous two charts.)

    This shows the change in platform phones more or less being from non-smart to Android and iPhones. The total population is 470 million people--not insignificant. The total number of non-smart devices abandoned is nearly 60 million in one year, which equals the total number of new smartphone users. That's 12% of most of the developed world switching in one year. If this keeps up, the "tipping point" when smartphones will outnumber non-smart phones in use in these large markets will be in another year.

    In terms of sales rate, the tipping point has already happened. Sales of smartphones crossed over in the US and Europe several quarters ago (November 2010 in EU5) and the trend is accelerating. Furthermore, if patterns of mobile technology adoption repeat as they have for the last two decades, emerging markets will follow in two to three years.

    This tipping point observation has been repeated on this site a number of times when reflecting on the data in the US. Now it's becoming clear that the same pattern has been underway in Europe as well.

    The big picture from the survey data is just how vast the demand for smartphones is. Some platforms are benefiting more than others in terms of share of growth, but the biggest mobile loser is clearly the non-smart phone. Not only is it an unprofitable product for almost every vendor, it is also being increasingly shunned by buyers.

    At the same time, at 450 million users we're still only looking at less than 10% of the market. As this pattern spreads globally the platform install bases will be measured in the billions of users.

  11. The proliferation of mobile platforms

    Research · 92 comments

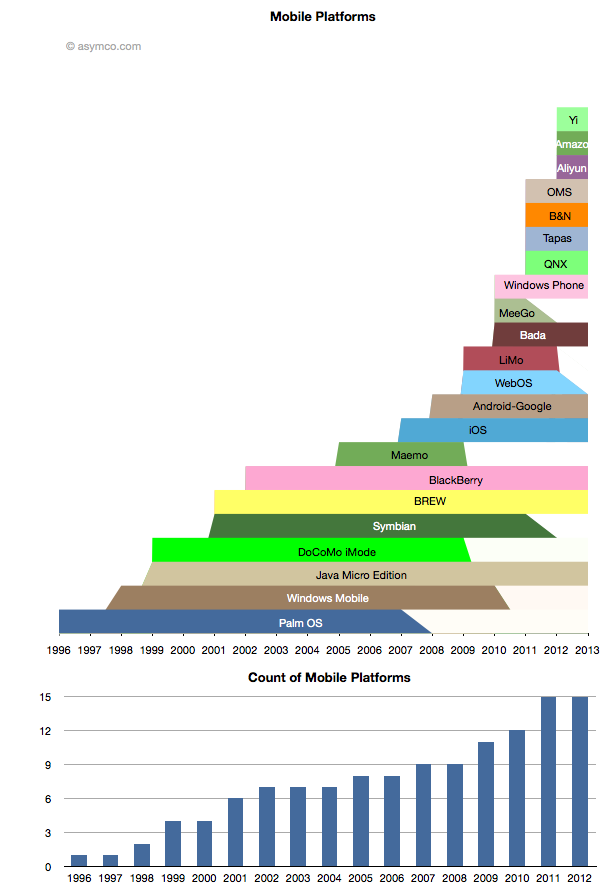
    While some mobile platforms are being withdrawn from the market, others are being introduced. The net is that there are more mobile platforms announced for 2012 than ever before. The following chart shows the lifespan of the platforms that I can recall.[1]

    Amazon's entry is only rumored but I think the description of it is detailed enough to be credible. The day after the scoop with Amazon, Baidu announced the Yi platform. Baidu is the sixth most visited site in the world, so it's not a bit player and it makes as much sense for Baidu to have a mobile platform as it does for Google.

    Aliyun is Alibaba's latest and it, like Amazon's, is positioned on commerce and shopping. I also included the platform underlying Barnes & Noble's Nook for consistency.

    Many of the newcomers are Android-like or Android-derived platforms but cannot be rightly called Android as they are not licensing the Android trademark nor any of the proprietary part of Android. They may run some subset of Android apps but that is not guaranteed to continue.

    It's also worth noting that many of the newer Android-derived platforms are being launched by Google's competitors and indeed seem to be designed to take value away from Google.

    The epic struggle Android vs. Google is sure to continue.

    ---

    Notes:

    1. The lifespan is bounded by the dates of public announcements of start and end of development efforts by the platform owner. It does not include times when products are still in the market or the platform is still supported.