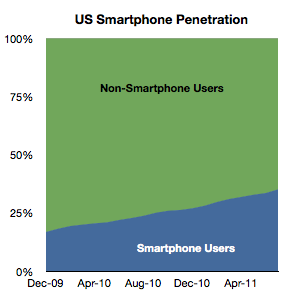
The survey data from comScore is in and it suggests that smartphone penetration increased by a significant 1.58%. It is now 35.1% with 82.2 million users.
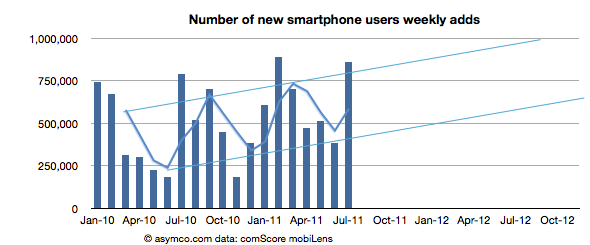
The weekly new user rate was about 863k/wk during July or about 586k/wk average over the last three months. I plotted the weekly add rates for the last 18 surveys and overlaid the three month moving average.
The chart shows that there is an upward slope to the upper and lower bounds of the moving average. Extrapolating trend forward gives me confidence in projecting 50% penetration by July 2012.
Samsung has, over the years, shipped phones using almost every operating system it could get a hold of. That includes Symbian, Windows Mobile, Windows Phone, LiMo, Android, PalmOS and OPhone.
As far as I know, today its portfolio includes Android, Windows Phone and its own Bada OS. The relaxed attitude to platform exclusivity at Samsung is in stark contrast with almost all other competitors who either for the sake of encouraging their own platforms or minimizing development costs maintained either one or two smartphone platforms.
Samsung justified their polyplatform strategy a few years ago by saying that different platforms are popular in different regions and as they did not want to be excluded from any market, they felt that being agnostic is the best policy.
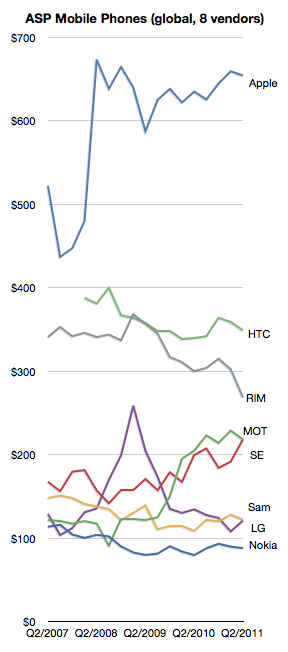
The idea that platforms are not universal, but the result of provincial preferences is interesting. It's a concession that "politics" plays a large part in mobile markets. However, for all the volume growth the strategy has produced, the strategy has not paid off in terms of higher margins or pricing power as the following chart shows.
So perhaps polyplatform thinking is coming to an end.
Exhibit A is Bada itself. The idea that Samsung would build its own OS came as a surprise to anyone following their history. Why did Samsung buy a book when there's a library in town?
Exhibit B is the repeated statements of Samsung's Chairman saying that the company should invest in software. Software!
Exhibit C is the statement today that Samsung intends to spend some of its $9.3 billion R&D budget on Software.
The money is expected to be used to strengthen the company technology prowess in such areas as mobile phones, semiconductors, displays and electronics products. Funds will also be allocated to software development.
Samsung investing in software development does indicate that perhaps the company does see value in that component and would prefer not to be dependent on suppliers for it.
In theory, as the market power of inputs (supplier power) increases due to concentration and forward integration it makes sense to backward integrate.
As a supplier itself, however, Samsung has to ask itself if its component customers are thinking the same thing.
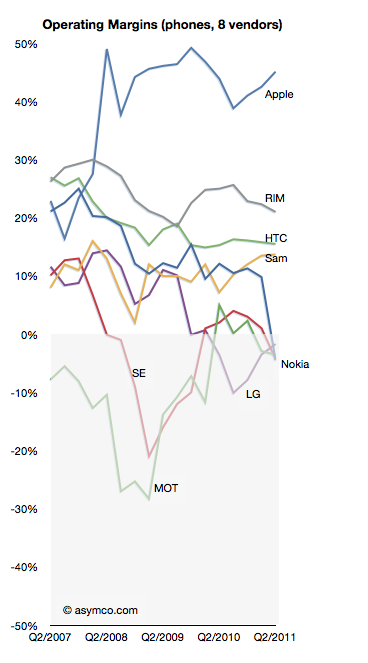
LG lost profitability in Q3 2009 and has not recovered it yet nor can it say when it might.
In a recent article on analyst reactions the prospect of LG's exit from handset sales is raised:
LG's handset division is the company's biggest capital sinkhole and the shares have more than halved this year, making it the worst performer even when compared to HTC and Nokia.
"Selling the loss-making business is probably what investors want," said Harrison Cho, an analyst at KB Investment & Securities. "But even with that option, LG wouldn't get much from the sale. They should have sold it long ago before the overall landscape got tougher."
"They simply missed the boat," said Cho.
The dire business outlook had already pushed LG shares below their book value to a record-low multiple of 0.9 times its book value, much cheaper than Research In Motion's 1.6 times, Nokia's 1.1 and HTC's 8.2.
That's a huge discount for a company that is also a global brand in television and home appliances.
As I like to point out it's unlikely that management failure is the sole cause for this problem LG finds itself in. If it were, then why did Nokia, Sony Ericsson and Motorola find themselves in trouble at the same time?
But putting aside the causes, the prospect of another tier one vendor becoming a victim in a booming market speaks volumes. Only Samsung remains largely unscathed, though I believe they are not immune. The shift in profit capture that I have been documenting is plain proof that the industry is undergoing permanent structural changes.
As the chart to the left illustrates, the plunge into negative margins is difficult to reverse. The only advice for LG today (besides breaking itself up) is:
"What LG can do at this point is keep doing what it can do best; keep upgrading its hardware offering, differentiate them and then diversify away from Android to Microsoft's Windows phones," said Jung Kyun-sik, a fund manager at Eugene Asset Management in Seoul.
I suspect however that diversifying into multiple platforms will not be particularly differentiating as every other vendor will do the same.
My thanks to Eric Hellweg, HBR editor, for offering the opportunity to write in the Harvard Business Review blog and the help in editing and sharpening the message.
Google's acquisition of Motorola is clearly designed to be an acquisition of Intellectual Property rather than an entry of Google into the phone business, but the impact on the business will be felt in many ways.
It is surely going to send some Android vendors scrambling. The situation is not without precedent however. The history of governance and ownership of Symbian shows how the licensing of platforms by licensor competitors leads to unintended consequences.
Symbian was formed to be governed in a way very similar to the original Android via the Open Handset Alliance. The company was owned by a consortium of phone vendors.[1] The shares were not equally distributed however with Nokia holding a larger share (though not a majority).
Although nominally involved in decision making, the smaller shareholders never felt entirely comfortable with the arrangement and over time some sold their shares and left the group even though they continued to license the OS.
Eventually Nokia ended up acquiring the company outright and open sourced the code. However, by then the product was obsolete and the only licensee was Nokia itself.
The lesson (and warning) was that a licensor that is also a licensee makes other licensees uncomfortable. The supplier is also a competitor. This is classic channel conflict and never ends well.
Open or not, with or without equity, these arrangements are always unworkable.
So Google's promise that
"This acquisition will not change our commitment to run Android as an open platform. Motorola will remain a licensee of Android and Android will remain open. We will run Motorola as a separate business. Many hardware partners have contributed to Android’s success and we look forward to continuing to work with all of them to deliver outstanding user experiences."
seems naive at best.
--
Notes:
Before its outright purchase by Nokia in December 2008, Symbian Ltd. was owned by Nokia (56.3%), Ericsson (15.6%), Sony Ericsson (13.1%), Matsushita (10.5%), and Samsung (4.5%). The company's founder shareholders were Psion, Nokia, Ericsson, Panasonic/ Matsushita and Motorola. Motorola sold its stake in the company to Psion and Nokia in September 2003. Psion's stake was bought by Nokia, Matsushita, Siemens AG and Sony Ericsson in July 2004.
The charts published here typically show data across two dimensions, (X-axis and Y-axis). Since many times we have to look at data over these dimensions and through time, there are no easy ways to do it without some iteration of the same chart.
As an alternative a "Motion Chart" let you look at data across up to five dimensions (X-axis, Y-axis, Color, Size and Time). This is a dynamic flash-based chart that allows you to explore several industry/vendor indicators over time. You can:
Select x-axis from seven options
Select y-axis from five options
Select type of chart (tabs in the upper right of chart: bubble, bar, line)
Set color from several variables
Set bubble size from several variables
Select to track individual companies (and enable tracks or trails that trace the patch of individual bubbles)
Play through time (and change playback speed)
Scrub through time manually over any time range
Mouse-over any data point for the actual values it represents in all dimensions (mouse-over and click to select to track that vendor)
This data and chart are updated and available at higher resolution at the following (permanent) location: https://asymco.com/hire-me/vendor-bubbles/ [hang2column foo="bar"] [/hang2column]
I took the stacked cascade chart of profit/phone x phones sold into a multi-quarter animation subtitled "The evolution of Shipments, Revenue, Profitability and Cost structure of eight vendors selling mobile phones between second quarter 2007 and second quarter 2011."
(I recommend selecting 1080p HD view and full screen to sufficiently resolve details.)
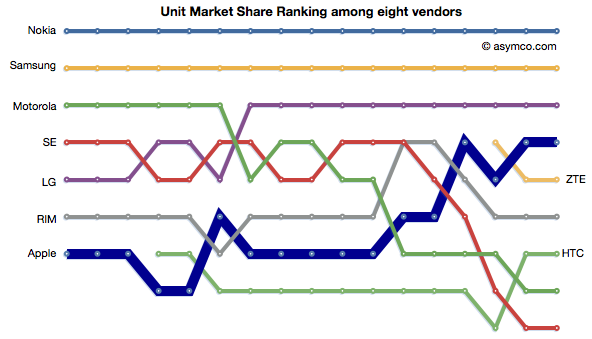
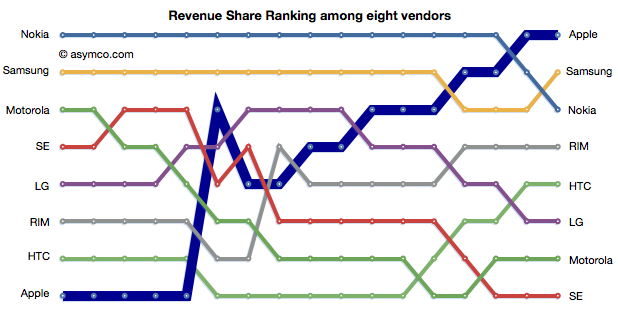
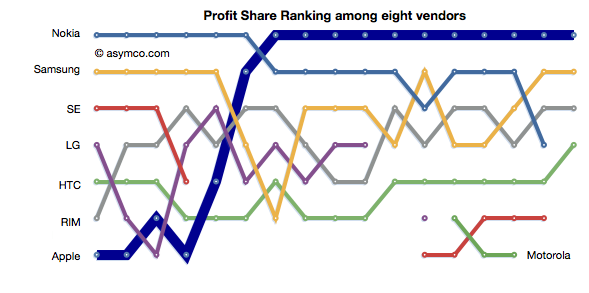
The phone vendors' ranking relative to each other on three measures of share (Unit or Volume, Revenues and Operating Profit) is shown below:
Although not much changed in the unit rankings since last quarter, revenues did see Samsung and Nokia trade places. In the case of Profitability, the chart shows a sparseness that is quite unprecedented. Only positive profit figures are charted.
The profitability (aka Profit/Phone x Phones Sold, aka Rawr) chart is a great way to see the "shape" of the industry at a glance, with attention to volume and profitability.
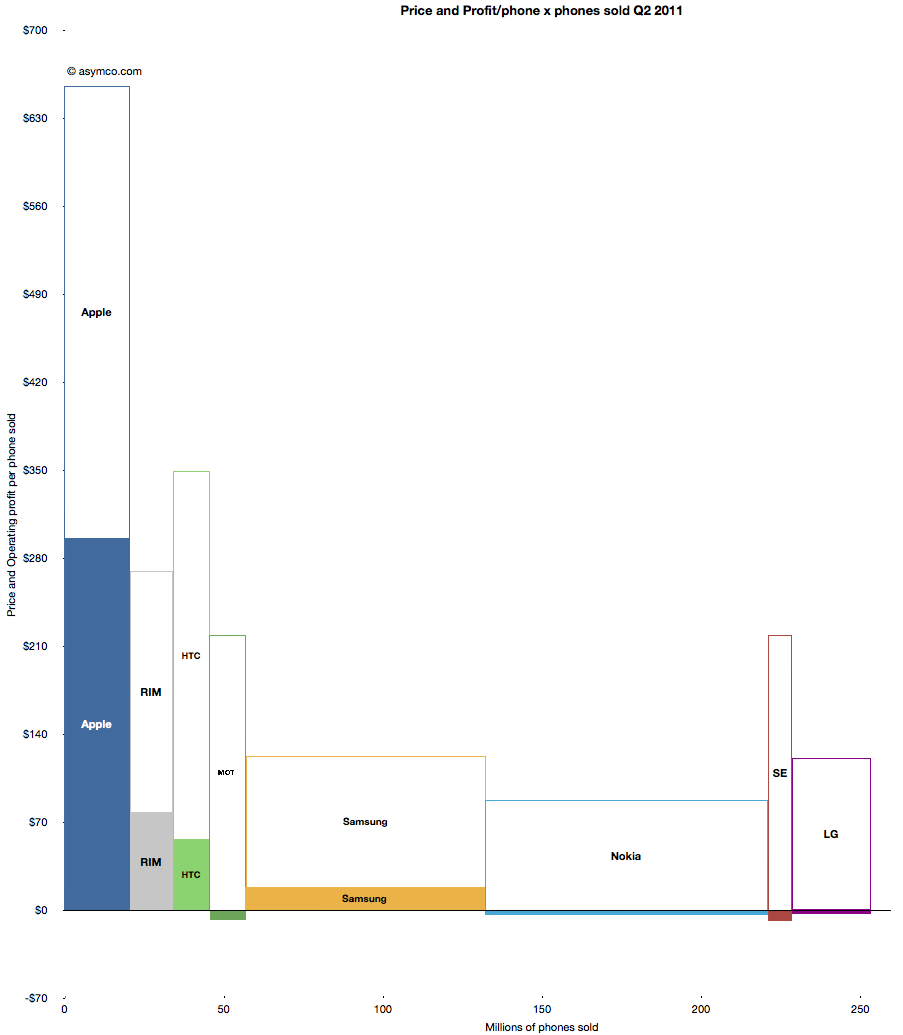
What is missing however is a perception of the sales level and the pricing of the products. To help in that regard, I prepared an extension to the profitability chart which covers the price and sales for each participant.
You can interpret this graph as an extension of the profitability chart where the "empty" or white areas above each profit area are payments to suppliers and operating expenses. Thus the sum of empty and filled areas (above zero) are equivalent to revenues. If the sum of the empty and filled areas are greater then revenues (i.e. they extend below zero) then the difference is operating losses.
The top of both empty and filled rectangles are set at the average selling price per phone (and the top of each filled rectangle is the operating profit per phone). The width of both rectangles is the volume of phones shipped.
The things you can read into this chart are:
Margins at a glance (ratio of filled area to total area)
Sales as well as profit relative to peers (top of each box relative to others)
Pricing power (overall top relative to competitors)
Any combination of the above
Finally, the sum of all the areas are the overall market revenues for the quarter. Sum of white areas are expenses and sum of solid areas are profits & losses.
A natural evolution of this chart would be to animate it across multiple quarters/years.
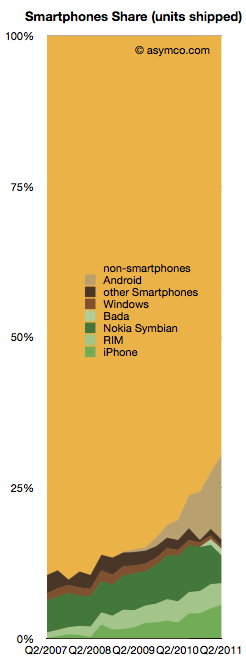
Smartphones made up about 30% of global phone sales last quarter. That is a significant increase from 10% in Q4 of 2007.
From this perspective, iPhone obtained 5.6% share, Android 14.2%, Nokia Symbian 4.6%, RIM 3.6%, Bada 1.1% and Windows 0.4%.
The competition however still has 70.5%.
The chart to the right shows the challenge remaining and the progress being made.
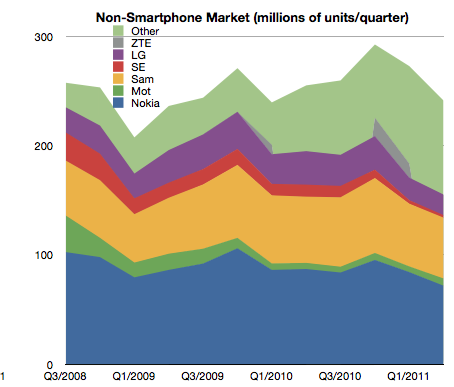
The good news is that the non-smartphone market is not growing while the smartphone market is. In fact, the non-smart market has had a three year CAGR of 0% and a y/y growth of 1.0% and a sequential decline of 6%.
The non-smart portion of each branded vendor's business is pretty dismal:
Nokia saw 17.57% decline y/y
Samsung's non-smart business declined by 8.14%
Sony Ericsson's dropped by a dramatic 80%
LG's fell by 38.56%
Motorola is the only one that grew y/y, by 17.86.
The reason all these brands fell is because the unbranded vendors took their place. "Other" non-smartphones grew by 43%. They have been sustaining growth at the rate of 57% compounded over three years.
The following chart shows the increasing share taken by the "other" vendors in non-smartphone units:
The non-smart business is so dismal for branded vendors that I've been assuming that they will cease to build such devices in the near future.
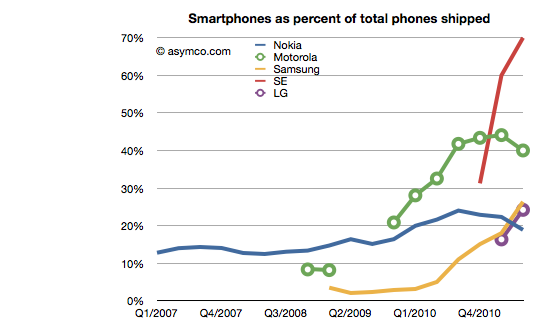
The trend is shown in the following chart which shows the percent of units for branded vendors which are smartphones.
Motorola, Sony Ericsson and Samsung are fleeing to smartphones as rapidly as they can. LG is following as quickly as possible as well.
The only question remains with Nokia. While their smartphone business evaporates they've also made a commitment to the non-smartphone market and are thinking about "the next billion" users who, presumably, will not buy smartphones and will buy some variant of Nokia's Series 40.
Targeting the low end may be commendable, but the question they need to answer is why would those next billion buy anything other than a low cost smartphone? And if not, then what's so different about the next billion?
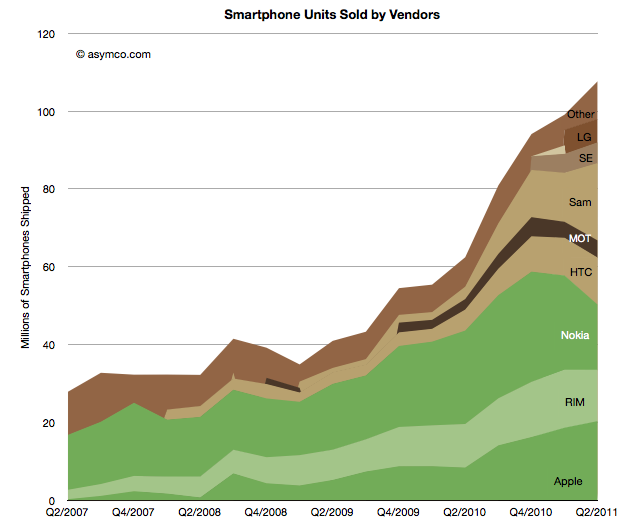
Nearly all the data on smartphone shipments is now available for the second quarter 2011. Some fragments are still not public, including ZTE and Huawei (and any others) shipments. We also have estimates for the various platforms including an estimate for Windows Phone and Bada (though not for WebOS).
This allows the following chart:
Using the traditional color scheme which separates "integrated" from "modular" vendors, the chart shows overall volume growth and how the volumes are split among vendors.
The market grew at about 73% y/y and 50% compounded over three years and 9% sequentially. The y/y growth rates for individual vendors were:
Samsung 525%
Apple 142%
HTC 124%
Motorola 63%
"other" 29%
RIM 18%
Nokia -30%
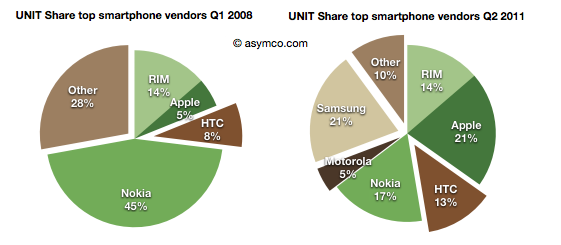
In terms of unit share, the pie charts below show the before and after (three year span):
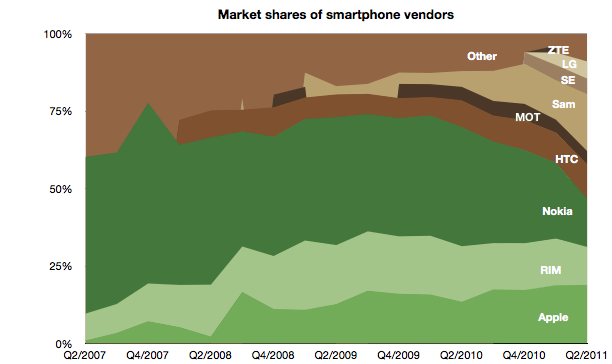
And the stacked area below shows every quarter over a four year period.
The story is largely unchanged since last quarter except perhaps in the rapidity or deterioration in Nokia's performance and Samsung's partial exploitation of that decline.
It should be noted that not all of Samsung's volumes are licensed platforms. An increasing share of Samsung smartphone volumes is Bada, an internally developed OS.
In the charts above I arranged the bars to place Nokia and RIM in the middle to show their double envelopment. A pincer movement is only an analogy but perhaps it's evocative of what's happening.