Asymco

Asymmetric Intelligence

Industry

  1. The Samsung hedge: Estimating Bada for Q2 and hence Samsung's Android shipments

    Research · 28 comments

    The number of Bada phones shipped last quarter is not public, however some assumptions can be made that lead to plausible estimates.

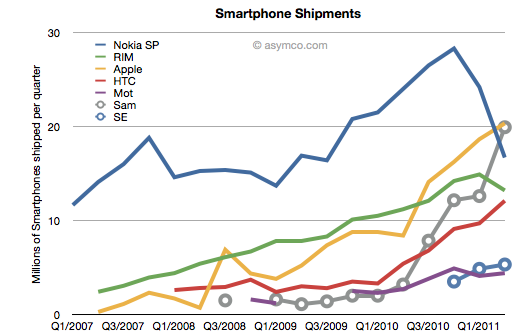
    First, we know that Samsung shipped about 3.2 million smartphones in Q2 2010 and that total included Bada and Android (and perhaps even some Windows Mobile).

    Second, we know that there were about 19.9 million smartphones in Q2 2011.

    Third, Canalys published an estimate that Bada grew by 355% y/y.

    So if we knew how many Bada phones shipped in Q2 2010 we could derive the current Bada shipments and also realize how many of the nearly 20 million smartphones from Samsung were actually Android.

    The clue is in an estimate from December last year that suggested that there would about 5 million Bada shipments in 2010. Coming close to the end of the year, and from Samsung directly, we can be pretty sure the figure is accurate.

    Taking this 5 million and spreading it over four quarters could give us enough of an estimate. That makes 1.25 million quarterly units. If we assume some seasonality or increase toward the end of the year, a Q2 figure of 1 million might be more accurate.

    Therefore, applying the 355% growth rate yields a Q2 2011 estimate of 4.5 million Bada shipments and hence about 15.4 million Android devices from Samsung last quarter.

    Considering the increasing importance of Bada to Samsung, it should be clear that Android is not the only source of growth for the company and its transition of feature phones to Bada as well as Android is a key strategic driver for differentiation vis-a-vis low end entrants.

  2. Apple share of phone revenues increased to 28%

    Research · 21 comments

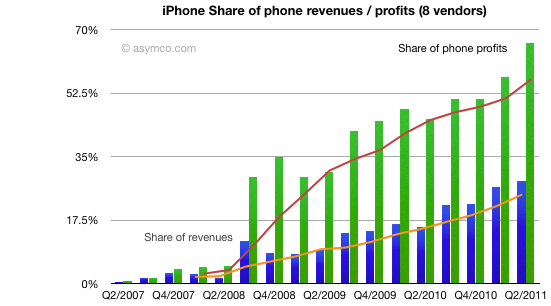
    As previously pointed out, Apple reached two thirds profit share in mobile phone vendors among the eight vendors I track. The following charts shows the historic growth in that share and the share of revenues (including 4 quarter trend line). Revenue share increased to 28% in the last quarter.

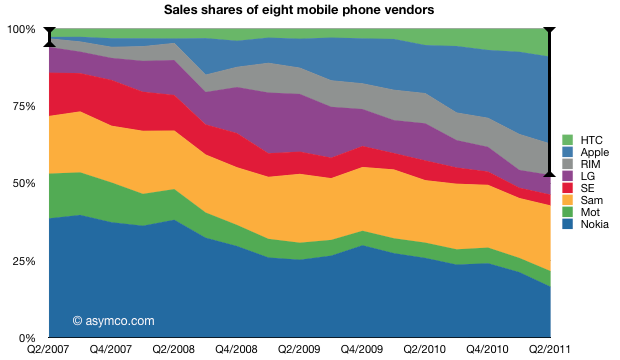
    The share doubled from Q4 2009. I should also point out that it was the highest of all the competitors. The following chart shows the split over time:

    The dedicated smartphone vendors (highlighted with segment bars) are now at 47% of total sales, a significant increase from the 6% share they held four years ago. Another remarkable show of entrant power and incumbent weakness.

  3. The end of easy growth in smartphones

    Research · 176 comments

    At the end of last year I was saying that the smartphone boom was a tide that lifted all boats. That is no longer the case.


    But the big story is that there has been a clear non-seasonal counter-cyclical decline in Nokia and RIM's smartphone performance. RIM's steady rise has come to an abrupt halt. Nokia's decline has accelerate precipitously. So much so that Samsung and Apple have overtaken Nokia and RIM and it looks like HTC will overtake RIM within one quarter and perhaps Nokia as well.

    The fortunes of vendors is now clearly tied to the fortunes of their platform choices. Android has a spotty record with Samsung[1] and HTC having accelerated growth with Android, Motorola and Sony Ericsson have not rallied to a similar degree (though they did remain operational). But it's at least very clear that BlackBerry OS and Symbian are now a burden to their owners.

    The fact that not all vendors benefit from a boom indicates that the early, happy days are over. People are noticing that there is a difference between smartphones and are not buying any and all. An era of competition will follow. I hinted that such a shift would happen when a "tipping point" was forecast and that point has been reached in several mature markets.

    The consequences are that weaker platforms and vendors will come under increasing pressure.

    ---

    Notes:

    1. Samsung decided to stop reporting the number of smartphones they sell. They also refuse to report the break-down between different platforms--they sell Windows Phone, Bada and Android devices. The figure I gave to Samsung is 19.9 million units, higher than 19.0 and 19.3 million from other analysts.
  4. The Profit/Phone x Phones Sold Chart

    Research · 28 comments

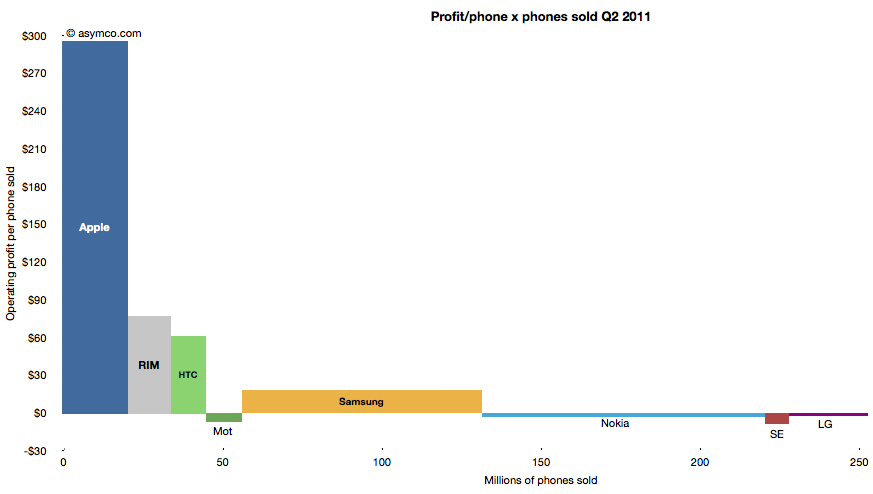
    The following chart shows the current profit distribution between phone vendors with an eye toward identifying volume dependencies. The vertical axis represents operating profit per phone and the horizontal axis the number of phones sold.

    The area of each vendor bar is therefore the total operating profit that vendor captured. A vertical (portrait) orientation implies high profitability with relative low volume while a horizontal (landscape) orientation implies a high volume/low profitability focus.

    The other important observation is that bars can also be negative. Those vendors' names are listed below the bars rather than within them.

    You can also compare the chart with the one from last quarter:

    The Rawr Chart | asymco

  5. Apple captured two thirds of available mobile phone profits in Q2

    Research · 81 comments

    The major publicly traded phone vendors have all reported results for the second quarter. Based on the data available so far we can begin putting together a picture of the market.

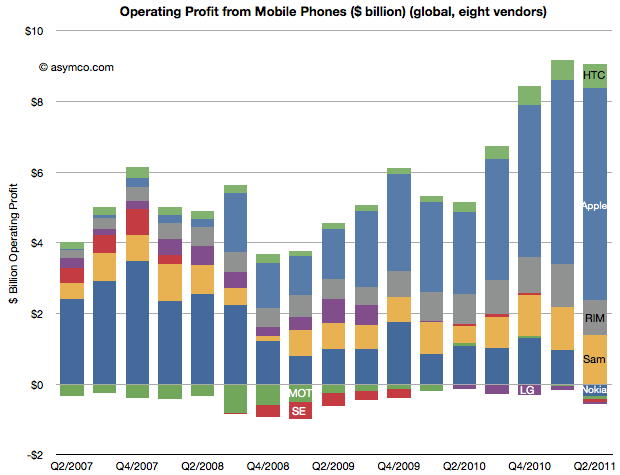
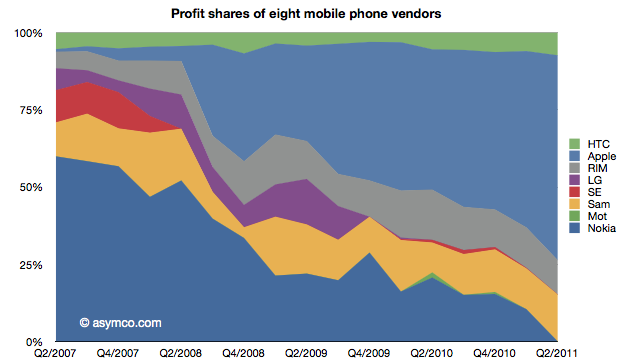
    The first picture I'll draw is usually the last: profitability. The following chart shows operating profit from the sale of mobile phones among the eight vendors I follow (Nokia, Samsung, LG, Sony-Ericsson, Motorola, HTC, Apple, RIM).

    This quarter saw a slight sequential decline in overall profit for the sector, but four vendors did not manage a profit from selling phones. Nokia, Motorola, Sony-Ericsson and LG all saw losses. The other vendors split the slightly decreased pie with Apple getting two thirds of it (66.3%)

    This share is up from 57% in Q1 and 50% in Q3 and Q4. Samsung's share went to 15%, though that's not a peak level historically. In Q1 2008 the company was at 21%. RIM was at 11%, a level in a range that has been unchanged for three years. Finally, HTC captured 7.4%, a new high and an increase from 6% since last quarter.  The profit share chart follows:

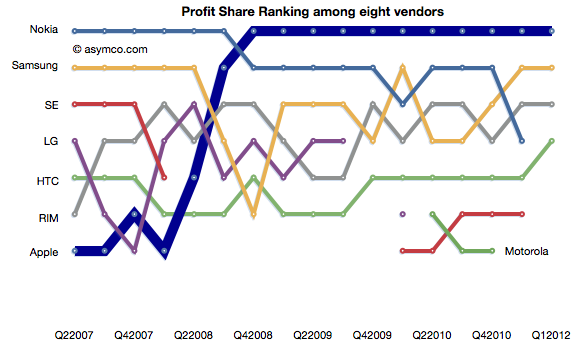
    The ranking chart for profitability follows:

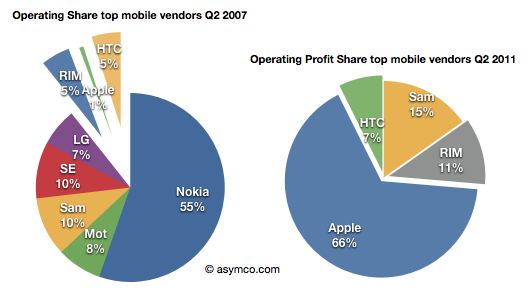
    Finally, the "before-and-after" view of profit capture showing the change in profit share over a four year period.


    The story remains largely unchanged from last quarter: Three companies which captured 11% of the profits before the modern smartphone era started (four years ago!) now capture 84% of the profits. Only one global brand phone vendor selling non-smart voice-oriented feature phones is still profitable however, as we shall see later, the only reason profits still exist for any vendor is due to the strength of their smartphone portfolio.

  6. The iPhone at four; growing up or just growing?

    Research · 74 comments

    Ever since the iPhone launched four years ago (to the day), the question on everyone's mind has been: When will Apple expand the portfolio to reach into all market segments? I remember thinking in 2007 whether it would be in six months or a year that they would create a "mini", "nano" and "classic" line-up which served them so well with the iPod.

    Apple however took a different approach. To their credit, they focused on the platform and built a consistent experience around a fixed screen size to nurture an ecosystem. They also improved the power of the device so that experience would improve to be better and more robust. In other words, they treated every iPhone as not being good enough, needful of every megahertz of power, every pixel of screen and every minute of battery life. They polished the OS constantly and added APIs by the thousands.

    In other words, they acted like a computer software company, not like a "device vendor" or like a handset manufacturer which was everyone's (including mine) frame of reference.

    Having expanded from iPhone to iOS and built the platform into non-cellular centric computers like iPad and iPod touch, they clearly showed a nonchalance about the operator channel and the amplification power it offers (an amplification which comes with a hefty price of dependency and strategic illusion.)

    But the mind always wonders back to the question of portfolio. Now that the product is maturing, the hardware is getting nearly "good enough". Perhaps even Apple might now consider letting go of the "frontier" of what's technologically possible and consider expanding its reach to the broader audiences it has willfully kept out of reach.

    And broad they are.

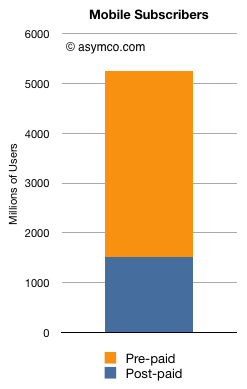
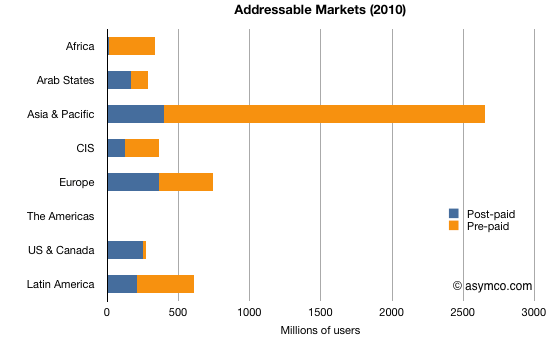
    Based on data published by Deutsche Bank and the ITU, we can calculate roughly how many customers Apple's current iPhone positioning has left unserved. I chose to use pre-paid/post-paid split as a proxy for unaddressed/addressed. This is an imperfect proxy but a pretty good one as most pre-paid subs see a full price for the iPhone (retail around $700 to $1000) vs. post-paid customers seeing a price of $200 or below. The $200 happens to be an important psychological price inflection point where volumes increase dramatically.

    The first chart shows the global split between pre-/post-paid subscribers as of 2010. Roughly 1.5 billion are post-paid and 3.7 billion are pre-paid. That means that nearly 70% of the world is not being addressed by the iPhone as it currently stands. Put another way, a shift in positioning might result in a 250% increase in addressable market.

    Tim Cook alluded to this in the last conference call when he said pre-paid markets, especially in China, are huge with share figures "starting with a nine". He also said separately that they would not be ceding any market--a hint if there ever was one, given the broadening of Android into previously feature-phone price bands.[1]

    We can even see the situation more clearly on a regional scale. The following chart shows the same pre-/post-paid split by region.

    You can visualize the iPhone having spent the last four years penetrating into the blue areas of the chart through the expansion of carrier agreements. With half the US & Canada area being finally filled in this year, most of the blue is now more-or-less within reach.

    Given the constraints on production, and given the improvements in the product and the improvements in the hardware (learning curves and price points) it may mean that Apple could finally be turning its attention to those orange areas.

    The time may be soon at hand that maturity coupled with limits of organic growth are leading the four-year-old iPhone to finally be re-defined as more than a post-paid skimming entrant. It may be time for the iPhone to more than just grow. It may be time for it to grow up and take on the whole market. Five billion people are waiting.

    ---

    Notes:

    1. Contrary to a commonly held belief, Apple does not shy away from market share. In the case of the iPod and even the original Apple 2, the company sought and obtained the top share ranking. In fact, the decision to pursue share vs profit is "context sensitive". Steve Jobs, at least, thinks so.
  7. Apple could buy the mobile phone industry

    Research · 75 comments

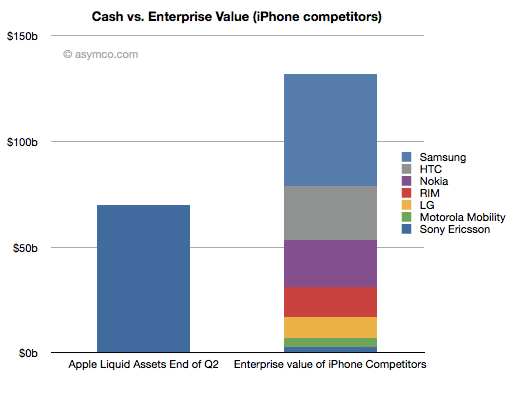
    The second quarter ends in less than two weeks. When it does, I expect Apple will have over $70 billion in Cash, Cash Equivalents, Short-term marketable securities and long-term Marketable Securities. That figure has been growing predictably.

    Also predictable has been the decline in value of Apple's mobile phone competitors. Most spectacularly Nokia and RIM. The enterprise values of the public companies selling 75% of all phones sold world-wide are as follows:

    • Nokia $22.6b
    • RIM $13.8b
    • HTC $25.4b
    • Motorola Mobility $4.2b

    The values of the profitable phone-making subsidiaries are a bit more difficult to estimate but we can use multiples of trailing operating profits. I generously use the multiple applied to HTC (14).

    • Sony Ericsson $0.21b x 14 = $3.0b
    • Samsung $3.76b x 14 = $53b

    That leaves valuing LG's phone business which has not been profitable in the last four quarters. I assume a nominal value of $10b. These data points are shown in the following chart:

    Given the current valuations, it would not be difficult for Apple to acquire every phone vendor except for Samsung with cash alone.

    The more remarkable thing is that as market values of phone vendors continue to decline, Apple's cash will continue to grow dramatically. Indeed, a time may soon come when Apple's cash will be worth more than the entire phone industry.

  8. iPhone liquidity: Why an unlocked Phone in the US matters

    Research · 93 comments

    The iPhone is now available in the US unlocked. Judging by the lack of reaction to the news, one would assume that this is not a significant event. I would argue however that it's a very significant event.

    What is unappreciated is that the iPhone is a very restricted product. Unlike any of Apple's other products (iPod, Mac and iPad), the iPhone is designed to be hard to get. Apple did not make it easy in the one dimension of ease that matters most: its purchase.

    Consider that many people in the world cannot buy an iPhone because it's not available locally. In case it is, in most cases you need to sign a contract and commit to a long-term relationship with a company other than Apple. In those cases where you don't sign a contract, you cannot use it with a service provider other than the one (arbitrarily) chosen for you.

    A few have been able to buy iPhones unlocked if they lived in a few countries (UK, France, Australia, Belgium, Hong Kong[1]) but those phones could only be purchased online if sent to a local address or in an Apple retail store--of which there are not many.

    Consider that in Europe alone, the following countries do not have iPhone distribution: Albania, Armenia, Azerbaijan, Belarus, Bosnia, Georgia, Iceland, Kazakhstan, Serbia and Ukraine. The populations total over 100 million people. In Asia the number of countries without iPhone distribution outnumber those with distribution. Add in Africa, Latin America and the Middle East and the unaddressed market begins to look very large.

    If you contrast this with every other phone platform out there, Blackberry, Android or Symbian, the iPhone is extremely restricted and the number of people that are permitted to buy it much more limited. The number of operators supporting Blackberry outnumber the iPhone at least by a ratio of two to one.

    Then there is the matter of distributors. This is a channel that iPhone does not leverage. Distributors account for more than half of Nokia's volumes. They buy in bulk and resell (sometimes illegally or in violation of contracts) vast quantities of phones.

    By offering unlocked iPhones in the US, the restriction on distribution is lifted to a large degree. What's different is that these phones can be purchased in 200+ retail locations. Many of these locations are in tourist hubs where there are large diaspora communities rotating continuously back to home countries. iPhones can now be purchased with cash and become as good as cash.

    And this is not a new phenomenon. When the original iPhone was available, Apple had to restrict buyers to 5 per person and stopped accepting cash because of the huge grey market demand. The same thing happened with the original iPad and with iPad 2 lines are still forming for it because distribution is so restricted. Consider also that sales in Verizon stores pale in comparison with those for GSM products.

    The way to think about it is that the iPhone has just become more "liquid" and it can now flow to parts of the world where it has been difficult to acquire. The iPhone was already liquid to some degree with unlocking and sales through Hong Kong/UK, but the US market's retail footprint and the lower costs that result will boost liquidity dramatically and probably increase volumes substantially.

    ---

    Note:

    1. According to Apple, the following 27 countries offer phones which are not "locked to carrier" : Belgium, Czech Republic, Finland, Germany, Greece, Italy, Luxembourg, Russia, Slovakia, Turkey, Hong Kong, India, Indonesia, South Korea, Macau, Malaysia, New Zealand, Singapore, Taiwan, Thailand, Vietnam, Bahrain, Kuwait, Qatar, Saudi Arabia, United Arab Emirates, South Africa
  9. Android developers are more prolific but less persistent than iOS developers

    Research · 29 comments

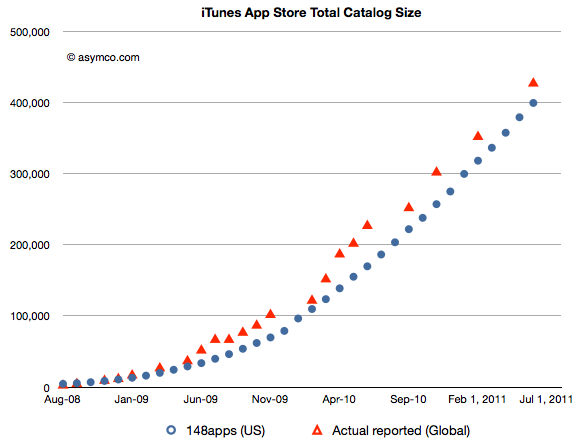
    According to 148apps.biz, the App Store has seen over half a million apps since inception. The number of available apps, according to Apple, is now 425k. (148apps claims 402k apps available in the US store.) The history of the App store catalog is shown in the following chart (showing both US and World-wide measures).

    In an interesting new post by Appsfire, APPtrition - or why app store size does not matter that much... Ouriel Ohayon makes a good point: available is very different than accepted. When comparing catalogs it's important to distinguish between these measures. Apps are published and then unpublished for various reasons. He calls this app attrition and details the reasons it might happen.

    What makes this interesting is the contrast between attrition rates on Android's Market and those on Apple's App Store. About 80k (or 16%) of Apple's catalog has been removed while nearly a third of Android apps have disappeared from the catalog. (By another measure, the submission total is tracked here and shows nearly 375k apps while Ouriel points out that there are 206k available. An apparent attrition rate of 45%.)

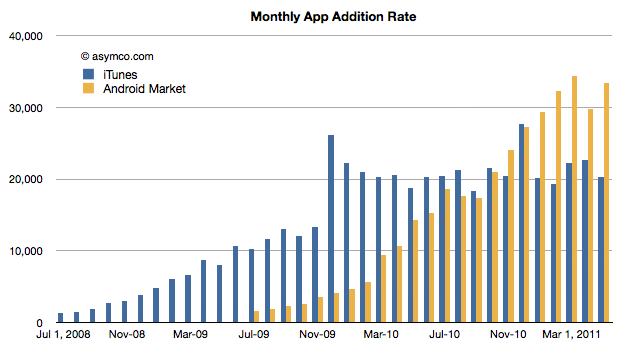
    We can compare how the two marketplaces are adding apps here:

    (The iTunes data is US only)

    This data would indicate that the iTunes App Store has plateaued at about 20k apps per month while Android is still growing and adding at about 30k per month. The challenge for an observer is to reconcile the growth in Android submissions with the apparently far higher attrition rate.

    In other words, Android developers and producers seem to be more prolific but less persistent.  With few if any constraints on submission it's understandable that there will be more apps thrown into the catalog. But why would they be so rapidly removed remains a mystery. Maybe economics, maybe policing, maybe something else altogether explains this.

  10. Peak RIM

    Research · 37 comments

    In their monthly survey update on US phone usage, comScore reported that by the end of April 74.6 million people in the U.S. owned smartphones. In the same period a year ago only 48.1 million did. The percent of smartphone users out of total phone users has reached 32%.

    The following data points can also be deduced:

    • 2.1 million or 474k people/week became smartphone users during April.
    • 62% of smartphones in use in the US are either Android or iOS. The sum a year ago was 37%.
    • There are about 20 million iPhone users and 27 million Android users in the US today. A year ago there were 12 and 6 million respectively.
    • RIM's US user base peaked at 22 million in Sept 2010. It is now 19 million and dropping.
    • Usage of Microsoft mobile operating systems in the US is in steady decline dropping from 7 to 5 million users in one year.
    • During April 475,000 people abandoned their Blackberries.
    • Android and iOS gained 3 million users in April. One million switched from other smartphones and 2 million switched from non-smartphones.

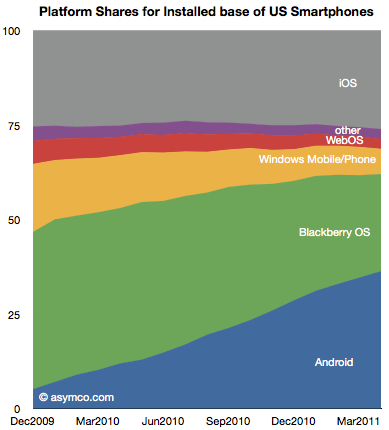
    The following chart shows the evolution of installed base share of platforms among users of smartphones in the US.

    The impressive share gains for Android are apparently at the expense of RIM and Microsoft. Over the period shown, Android gained 25 million users while RIM gained only about 2.8 million.

    Although perhaps comforting to see some growth overall, the situation for RIM is more grim than that. During the first half of the period (December 2009 to August 2010) RIM had gained 4.6 million users. During the second half (Sept 2010 to April 2011) RIM lost 1.8 million users.

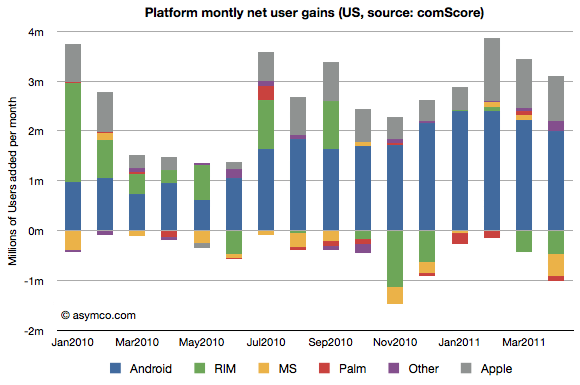
    The net user gains and losses for the various platforms is shown in the following chart:

    Note how RIM (green bars) went from being a consistent net usage gainer to a consistent net usage loser during this 16 month period. In addition, note how Microsoft's platforms (yellow bars) have had a very poor showing with very small gains during four months and moderate losses during the others. The losses in usage even increased after the release of Windows Phone late last year suggesting no traction whatsoever for Windows Phone.

    The other point to be made is that if we assume smartphone users remain smartphone users, then those platform losses are gains by other platforms. In other words, the areas less than zero in the chart above represent smartphone "churn" or switching between platforms (As a percent of all smartphone users that number represents 1.35%.) That number is far lower than the total smartphone gains, so it's safe to say that most of the iOS and Android gains were at the expense of feature phones rather than other smartphones. And since iOS share is consistent (and supplies are constrained), few if any Android gains are at the expense of iOS.

    There are many interesting patterns to observe in the data, but I think the most evocative is the erosion of Blackberry usage. If the Blackberry peaked, and a follower platform not yet in sight, the question is how long will RIM survive?

  11. Is RIM's management the cause of its failure?

    Research · 61 comments

    "Jim and Mike brought the company to where it is ... which is part of the biggest problem they're facing," said Charter Equity analyst Ed Snyder, who has covered RIM since its public listing in 1997, two years before the BlackBerry was launched.

    "They're stuck in the past. They know what worked and keep playing that card and it's not working any more, and they don't seem to have any ideas," he said.

    via BAY STREET-As RIM struggles, talk of a change at top surfaces | Reuters.

    In the case of Apple, the departure of the founder is considered a grave threat to the continuing success of the company.

    In the case of RIM and Microsoft, the continued tenure of the founders is considered a grave threat to the success of the company.

    Clearly, the theory that founders of successful companies can assure continuing success is flawed. Coupled to that implied causality is that departure of founders is always a problem.

    Both are reflections of the idea that companies are predominantly successful (or fail) because of the skill (or incompetence) of a small group of individuals.

    What the idea fails to explain is why companies fail (or succeed) as a cohort. RIM's troubles are similar to Microsoft and to Nokia's. Did they conspire or collude to fail simultaneously? Historically, incumbents fail simultaneously, regardless of who's in charge.

    And what about the problem that a company goes from success to failure (and vice-versa) while the same management is in charge. The "smart manager" theory of company success is as pervasive as the "stupid manager" theory of company failure. The perplexing thing is that while both of these theories are applied within the lifetime of a company, the management does not change.