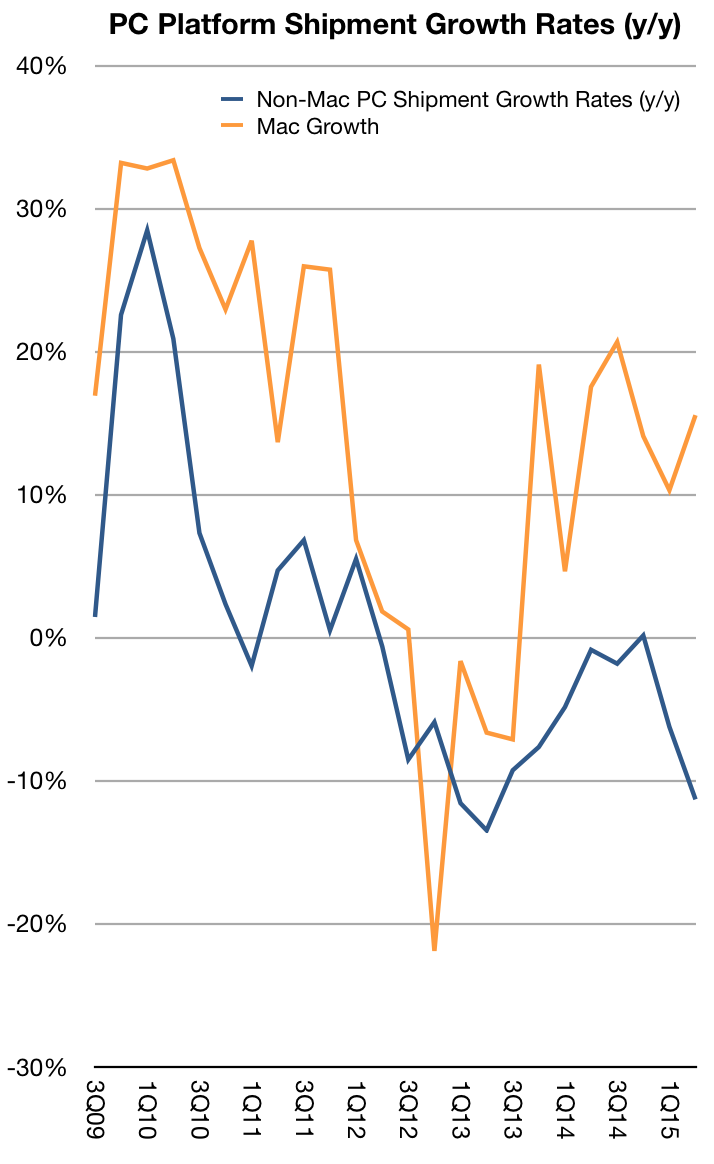
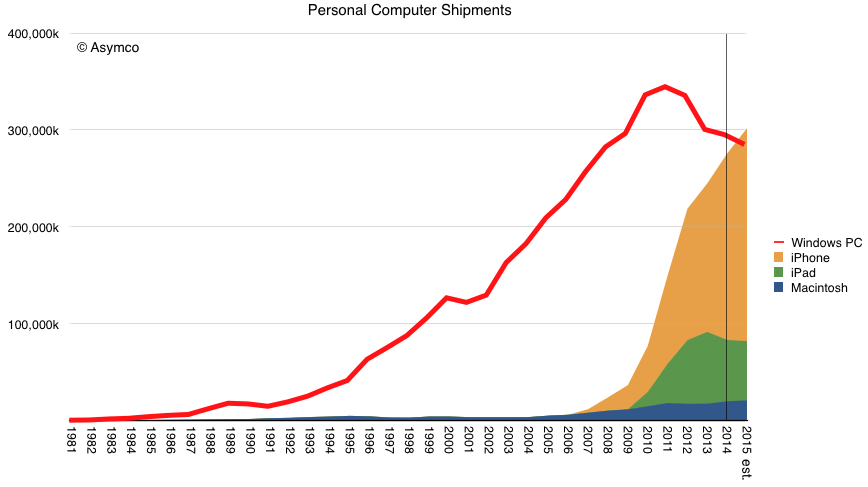
The pattern of Mac growth exceeding Windows PC growth (and overall PC growth which includes the Mac) is old news. It has been observed for at least 40 of the last 42 quarters.
It's a historically interesting contest, but the story of computing has moved on. Starting with building computing, via floor computing, office computing and then to desktop computing and portable computing we are now in the era of mobile computing. ((And as sure as the sun will rise tomorrow we will move beyond mobile computing)). The problem with observing mobility in general is that there are too many mobile computing options. Phones have a wide range of capabilities, tablets and various other form factors are positioned on differing jobs-to-be-done. Platforms and services are also scattered around jobs which have been carved from fixed computing or have been established with no fixed precedent.
So can we pinpoint with any accuracy the moment when the tipping point has been reached? We could point to all mobile phone shipments, or even the vaguely-defined smartphone shipments compared to all PC shipments. We could look at tablets alone. If we could get accurate measurements.
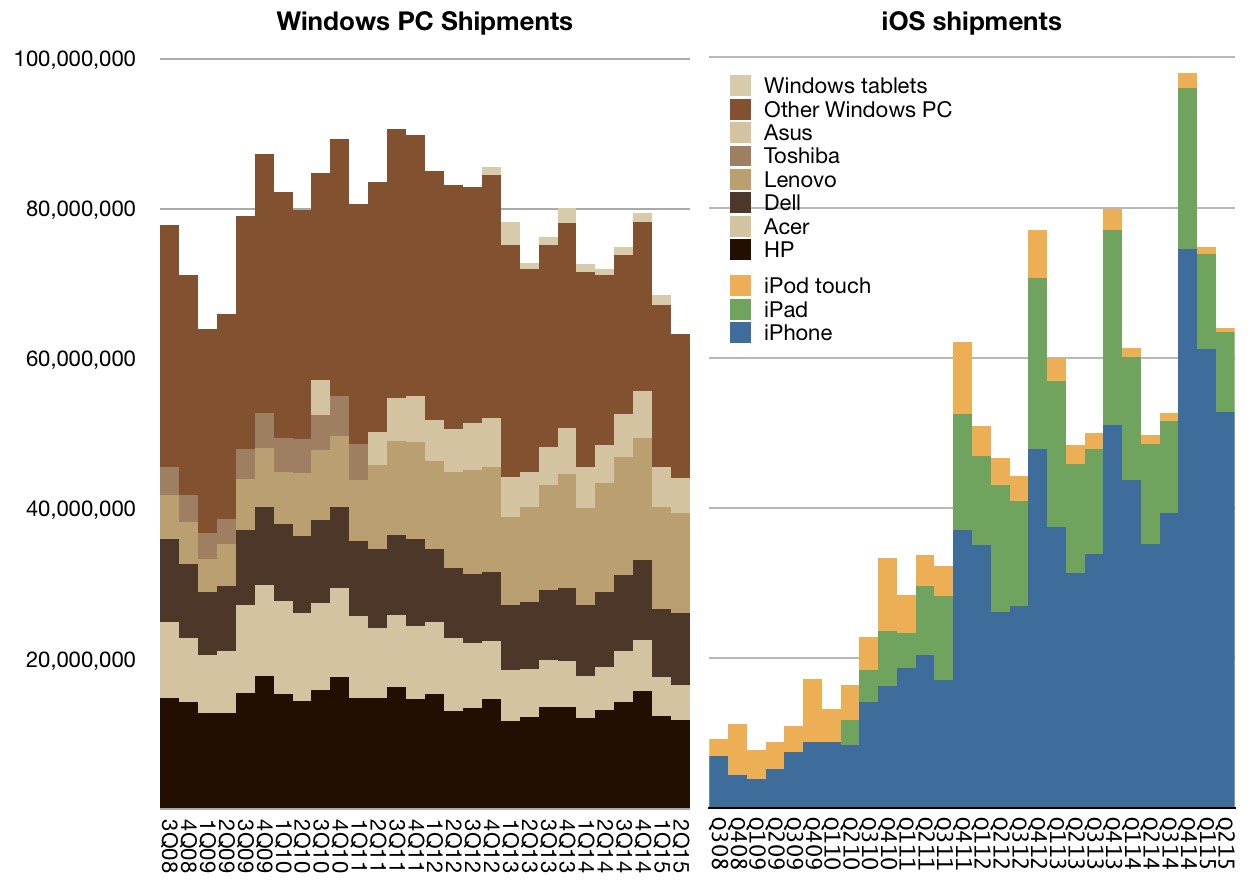
One measurement could be to look at operating systems alone. When comparing iOS shipments (iPhone, iPad and iPod touch) to Windows we can see that combined iOS shipments exceed all Windows PC shipments for all three previous quarters.
Which reminds me. This week Microsoft wrote off the acquisition of Nokia's mobile phone business. The growth of mobile as an alternative to desktop/laptop computing was foreseen by Microsoft a decade before the the data in the graphs above. It began in 1994 with Windows CE development, proceeded with a PDA operating system by 1998 and the Pocket PC brand in 2001 and Windows Mobile in 2004 and Windows Phone in 2009.
After anticipating, predicting and dedicating decades of work why didn't Microsoft participate in its own vision?
The curious thing about disruption is that predictability does not result in immunity. If the new trajectory threatens the current profit formula, the trajectory is not joined with enthusiasm. There is an uncanny unwillingness to self-disrupt.
The exceptions to this rule are so rare that they are seen as magical, enabled only by accident or catastrophe.
ComScore suggests that there are 100 million tablet owners in the US. On a per capita basis that implies penetration of about 30%. As a percent of mobile phone subscribers (above age of 13) that implies 40%. As a percent of smartphone users that implies 43%. As a percent of iPhone users that represents 47%. As a percent of households assuming one device per household that implies 85% penetration. By another measure (Pew) household penetration is around 50%.
Regardless of the difficulty in defining what is the correct "addressable market", the more important question is whether tablets will be an ubiquitous object. Perhaps what we are seeing in the US is something similar to the MP3 player market or video game console markets where penetration saturated at around 50%. Perhaps tablets will reach PC levels which are closer to 80% of population or perhaps they will reach phone levels which are above 90%. The reason we can't answer the question of ubiquity easily is because competing solutions can carve the usage out of a category "disrupting" it with alternatives.
The idea that jobs are the segments into which products fit and not demographics or product attributes is key to understanding this migration. The reason phones have subsumed more jobs onto themselves is because they have a rapid rate of evolution and because they have larger scale of economy and because they are conformable to our life spaces. As phones get better they take on more jobs and some of those jobs are those of tablets. The MP3 did not become ubiquitous because the phone took its job. Same for the video game and same perhaps for the PC and tablet.
But tablets are also getting better. At WWDC we saw how the iPad got a lot better for in terms of multi-tasking, data entry and edits. With the addition of more screen space it will get better still. The improvements will mean that it will possibly be hired for jobs that PCs are still uniquely good at.
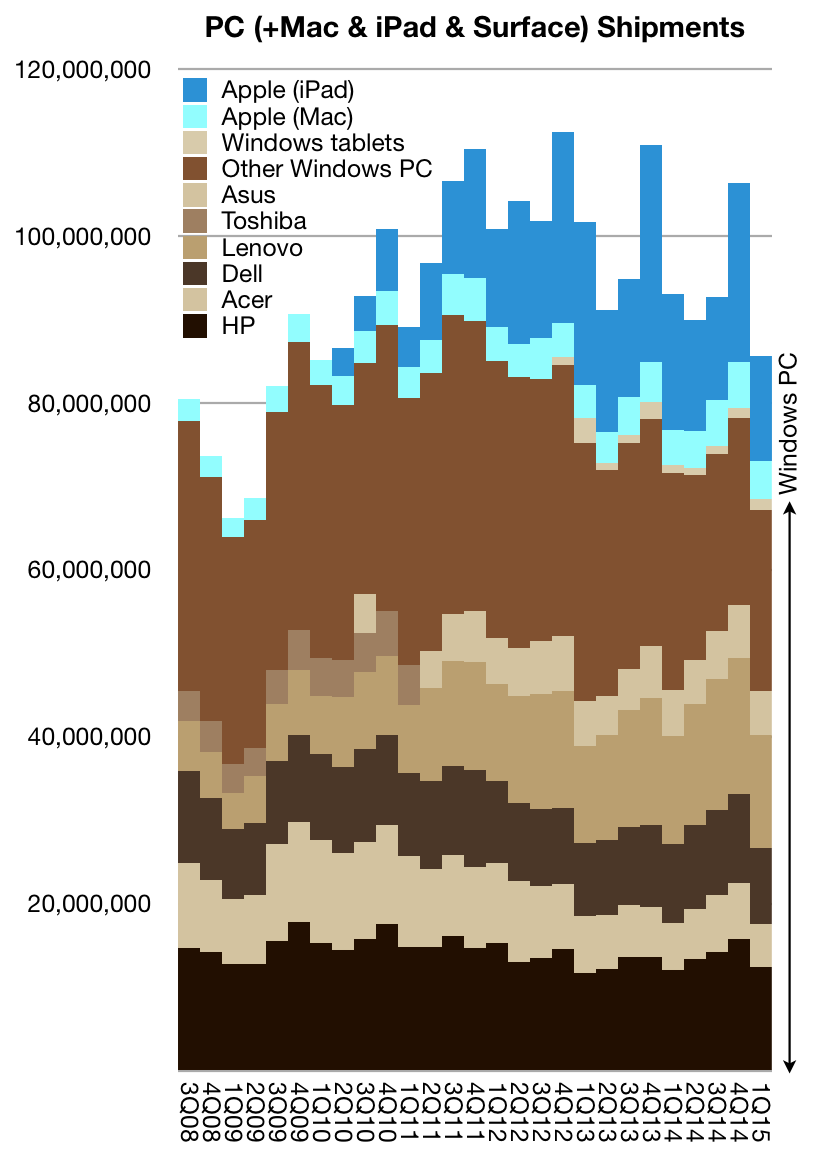
If so then the tablets can continue disrupting PCs from below. As the graph below shows, iPads have captured a great deal of the growth of the overall "computing" market as defined by the PC.
However even that growth has stalled. The combined PC+Mac+iPad market is declining suggesting that "computing" is inexorably being absorbed by the mobile phone.
Apple management remains bullish on the future of the iPad as a PC disruption. That is certainly possible to continue, especially as PC usage in enterprises needs to migrate in order to take advantage of mobile productivity. But before we see progress we need to see the iPad get better in meaningful ways.
The dimension of input and interaction seems to be about to get an upgrade. This is just what the product needs.
At the 2015 WWDC Apple stated that it receives 5 billion requests per week for its maps service. It also said that Apple maps is used 3.5 times more frequently than "the next leading maps app."
These two data points are the total number of data points we have about the global maps market. Neither Google nor Nokia provide usage or share or performance data. Regardless, commentary on the usage, share and performance of Apple Maps has been abundant for the three years since its inception.
The data presented allows us to make a few estimates for the first time and we can hope that additional data can allow a picture to emerge of where maps are going.
With these first two data points we can finally make some estimates. But some assumptions are still needed: We need to assume that the "next leading maps app" is Google Maps. Although there are other maps apps on the iOS platform they are probably insignificant and it's a two-horse race between Google and Apple on iOS.
This means that the 3.5:1 split in usage results in a 78% share for Apple Maps and a 22% share for Google. If we assume that there are about 400 million iOS users of maps ((Note that not all iOS users are maps users. Maps are not used by all users)), it leads to about 90 million Google Maps users on iOS and about 310 million Apple Maps users on iOS. This includes iPad. ((We are excluding OS X use of Maps.))
Given that Google also reported 1 billion downloads in 2014 ((though not necessarily all of these downloads lead to active use, obviously)) we can assume between 25% to 33% Apple Maps "market share" of usage.
At the minimum, 25% share is not insignificant and it's easily sustainable. To understand why, we should note that there is one more data point. In December 2012 I posted an analysis on the the cost of maps. It showed that maintaining maps requires an investment of between $1 billion and $2 billion/yr. With the addition of new features such as 3-D mapping, transit maps and thousands of new cities, the cost is likely to have increased. $2 billion/yr is probably the norm today.
Apple then could be seen as spending about $6.5/user/yr on maps and Google could be spending about $2/user/yr. To be profitable Google would need to find ad revenues of $2/user/yr and Apple would need to find $6 of profit on each phone/yr. Clearly, each of these targets is achievable.
In contrast we can see why Nokia's HERE Maps business is now worth a lot less than it was in 2007. The asset has been for sale for some time and the latest bid has been for $3 billion, making the $5 billion lost in market value and $7 billion of investment since seem like a catastrophe. Without a business model the data is worthless--with only 30 million users the cost per user reaches $66/yr. A buyer needs to find an appropriate model for sustaining a $2 billion/yr burn rate.
So the question of where maps are going depends on the business model for maps. In a world where maps are sustained by device value, 300 million users makes it sustainable. In a world where maps are sustained by advertising, 1 billion users makes it sustainable. What else is there?
How about a world where maps are sustained by transportation services?
Uber's and other auto makers' interest in HERE shows a third business model. Accurate maps are a key to making vehicles autonomous. More so even than the value of the algorithms, precise imaging of roadways enables vehicle autonomy and the value of location gathering systems should grow to meet that future.
It's highly likely that Google's maps efforts are going to continue because they are fueled by a business model. That is also true for Apple's maps efforts, though they are fueled by an entirely different business model. Each of these business models fuels the improvement of the maps product but also of the maps gathering process. As these processes are expensive and licensing options are few there is little incentive to share the data. As a result the processes remain integral to the businesses.
This integrated-while-fueled nature means that maps makers will find it compelling to pursue adjacent business models, i.e. transportation services. It's not a matter of whether they will or won't. It's only a matter of when and where.
To the analyst, the car industry is a wonderfulstudy. Unlike some other "high technologies," whose market births and deaths are separated by a few changes of the seasons the automobile industry has been around for well over a century. It has been sustained through dozens, perhaps hundreds of innovations. Almost everything about the car of a century ago has been improved.
Not only improvements to the product itself but improvements to the infrastructure that supports it: roads, gas stations, services, insurance, regulation. At the same time, its numbers have increased steadily as the car has spread to all corners of the world through waves of increased production and distribution. Although invented in Europe, the production system that allowed it to reach the mass market took hold in the US. That production system was then exported to Europe then to Japan and then to Korea and now to China.
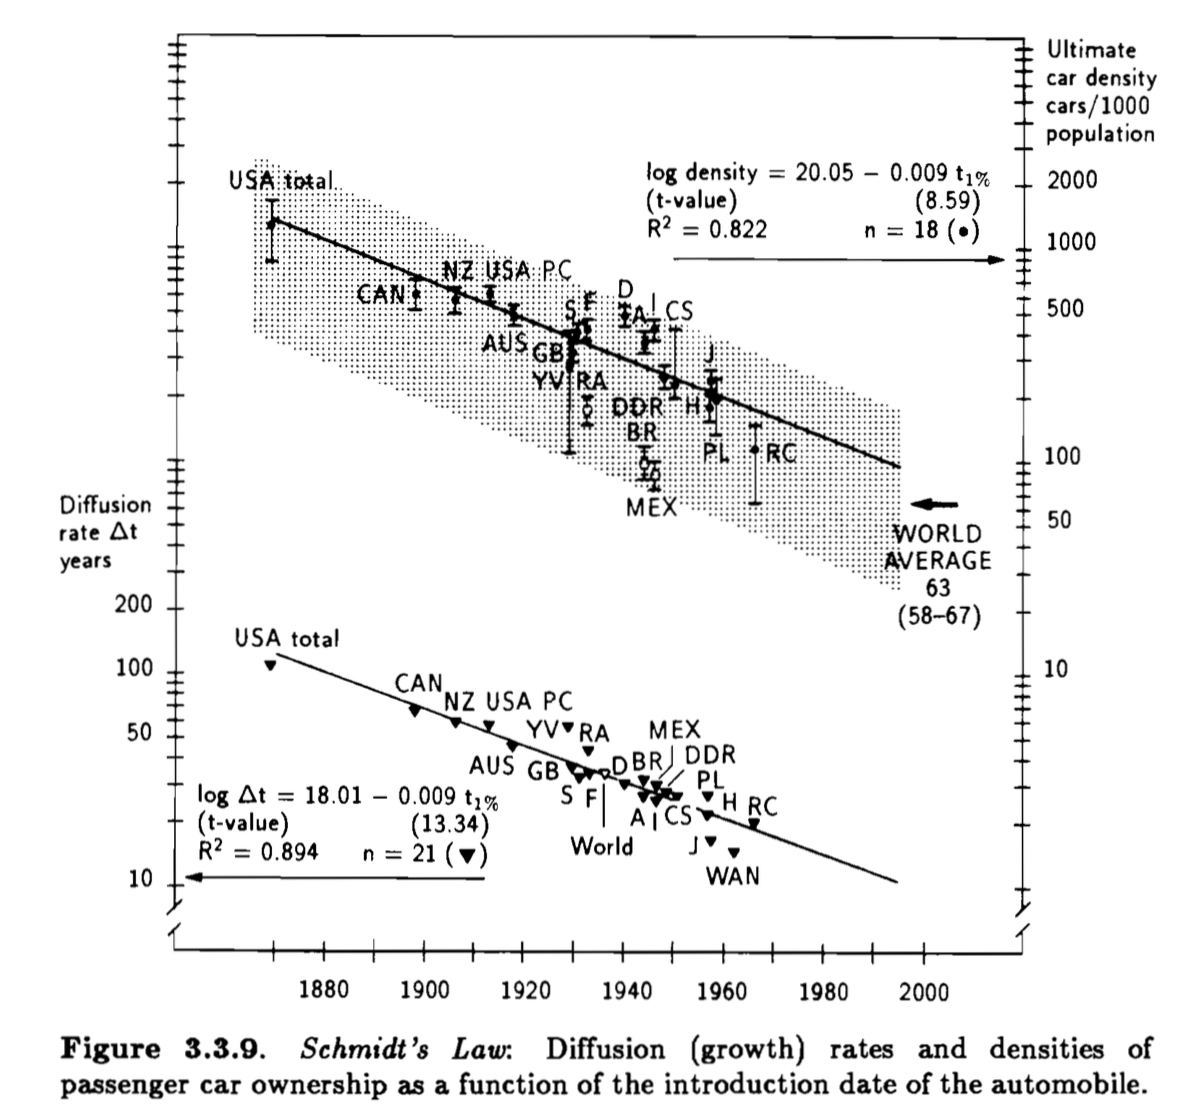
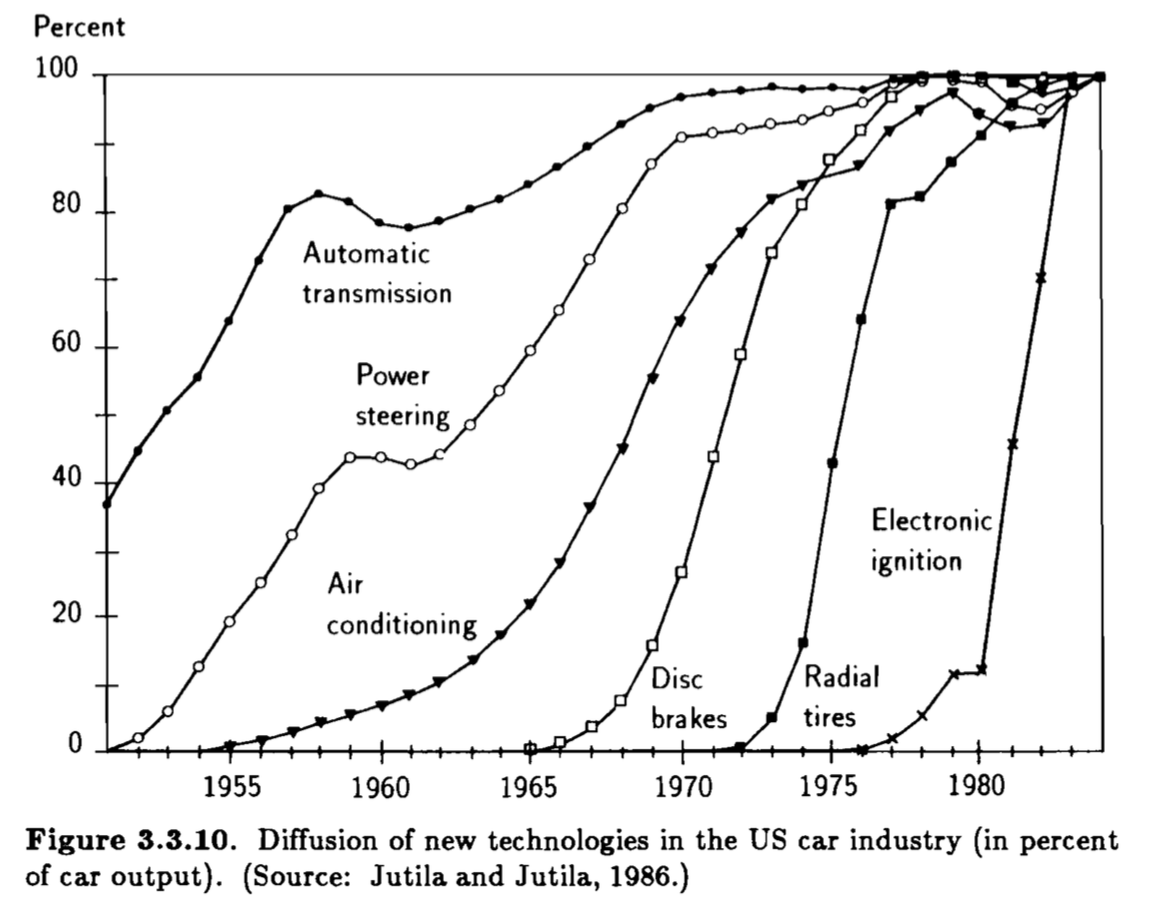
Figures 3.3.9 and 3.3.10 from Arnulf Grubler's The Rise and Fall of Infrastructures
However, throughout this century of improvement, the business structure—the way money is made—has not changed. Even with the arrival of Volkswagen in the 1960s and Japanese automakers in the 80s, the network of incumbents has not been displaced. Newcomers have taken share, but there have been few exits suggesting that classical disruption has not taken place.
When we look at the reasons for the share displacement that did take place, we see innovation in production systems and distribution as the core causes. We see new manufacturing processes and competition against non-consumption. What we don’t see is new technologies. We don’t see diesel engines or anti-lock braking or crumple zones or fuel injection or radial tires or airbags or automatic transmission or air conditioning or electronic ignition or safety glass, or any of the other hundreds of technologies that have been adopted as causing any change in market share.
Every innovation tends to diffuse rapidly throughout the industry, being widely adopted by all manufacturers. Production systems such as the ones from Ford and Toyota have been much slower to be adopted which has offered those innovators an advantage for a few decades, but they too have eventually been widely copied and created normative behavior. The opening of new markets like Asia, Eastern Europe, Latin America, Africa and China have created opportunities for local manufacturers but eventually those advantages too have or will be diminished with time.
So, given this, we have to ask if the the availability of new power storage technologies would allow an early mover to displace and move aside these established makers. To answer in the positive would imply that the challenger has an asymmetric business model—one which causes the incumbents to flee in the opposite direction. But Tesla is manufacturing cars using the same JIT processes and ramping quite slowly. Toyota-style process-driven innovation does not seem to be even in the works. There is no shortage of manufacturing capacity, indeed there is too much.
Furthermore, Tesla is selling cars in established markets competing against existing consumption. Volkswagen Beetle or Model T style competition against non-consumption does not appear to be on offer.
Tesla's product introduction rate is relatively sedate, so a higher rate of product development which might let them “turn inside” the incumbents, does not seem likely.
Finally Tesla is introducing products priced well above average appealing to the wealthiest of customers, again causing us to ask how this might cause a luxury company to look at their solution and exclaim “Not for us!”.
Looking from every angle I am unable to find the way that Tesla is asymmetric. Disruption theory suggests that whatever causes it to survive or prosper will be embraced and extended by competitors precisely because it will also cause those competitors to survive and prosper.
The auto industry may be a lot slower than the computer industry to respond. But once the industry embraces battery-based power, it will convert a world-wide production and distribution system to sustain itself.
That does not mean Tesla is a bad business. They may carry on with Porsche-like or even BMW volumes for a long time. But that’s not a disruptive outcome, it's a niche strategy.
There is one more point. As Tesla has chosen to share its intellectual property and as Elon Musk has stated publicly, they welcome others to build the same cars they do. So by their own admission the company does not seek to disrupt. Disruption is a competitive stance.
Unicorns typically are valued on the basis of number of users. While they are not yet monetizing those users, their growth and engagement metrics are expected to be off the charts. As there are no revenues (or profits) the $billion valuation hinges on a nominal value of $/user. That figure is based on comparable companies (e.g. Facebook) which do monetize their users.
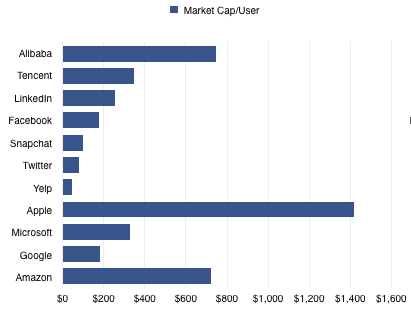
Since the unicorn's capitalization/user defines its valuation, which company should be considered comparable? Unfortunately they range widely. There are many alternatives. The graph below shows a few Market Cap/Mobile User rates ranging from $45 for Yelp to $747 for Alibaba.
Note that I've also added companies which may not be considered as unicorn comparables because they are not usually valued on a per-user basis. Apple, Microsoft, Google and Amazon are priced by product sales, typically. However, most of them operate and self-define as service organizations. Microsoft has been "monetizing users" for decades using a recurring revenue model. It has a "SaaS" business logic for most of its revenues. Google ((Google users are estimated at 2 billion active Android/GMS devices)) likewise. Amazon reports its active users every quarter and obviously is measuring itself by that metric.
Apple ((The assumption here is that Apple has 520 million active users which is based on iOS devices in use estimates)) is the least likely to be seen as a company whose value is a function of user base. Nonetheless it behaves entirely on that basis. The company's entire strategy depends on satisfying its customers and building its brand which can only have one outcome: loyalty and repeat purchases. The services and software they offer can be seen as supporting that brand loyalty which is converted to profit through an above-average selling price.
Being mature of business model therefore does not exclude a company from being valued like all the kids are these days.
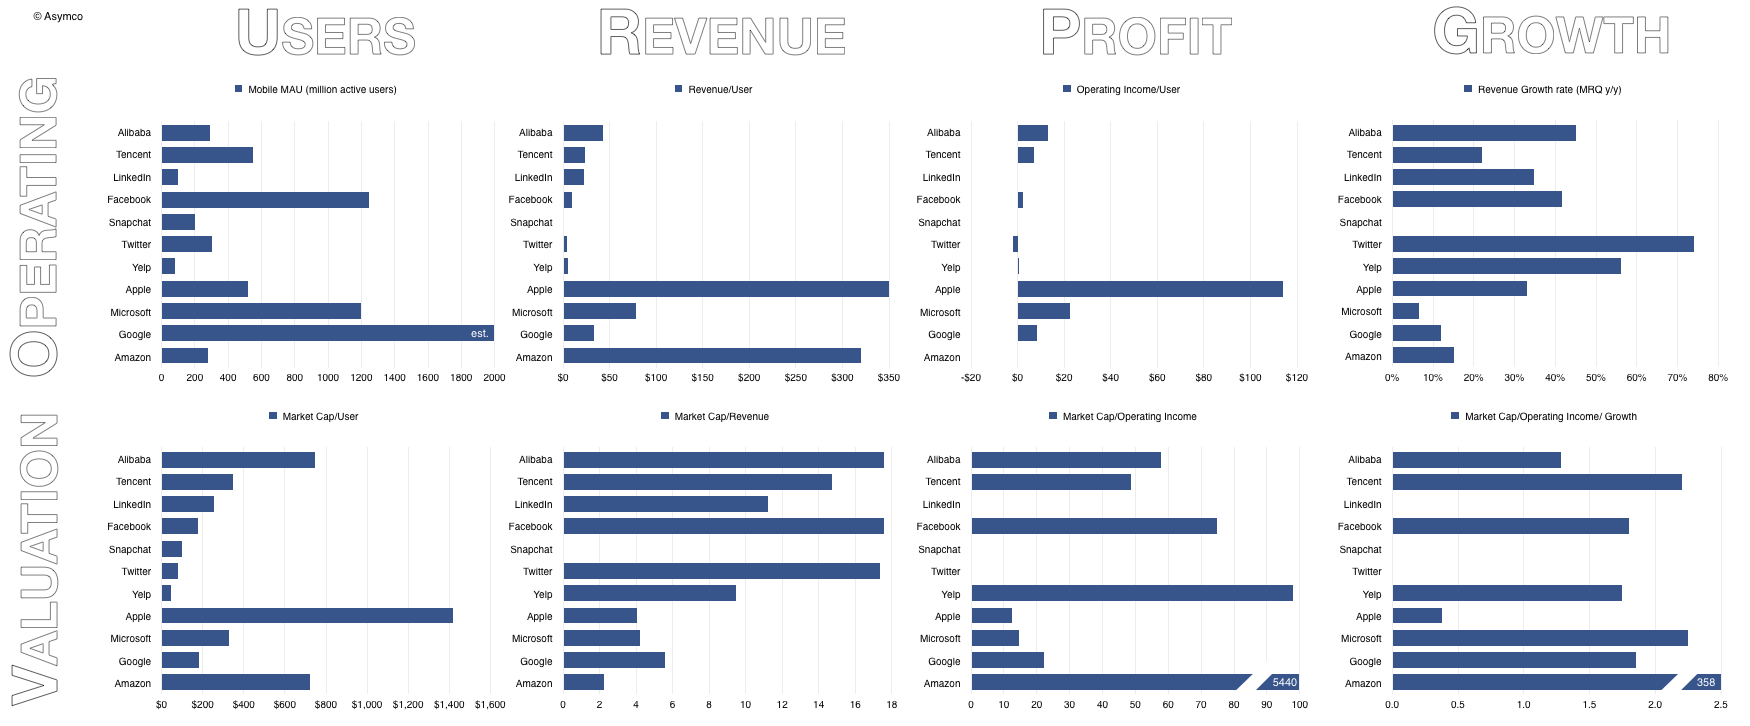
So, if we do look at the value/user metric we might as well look at the revenues, operating profit and growth data.
Unicorns are therefore characterized as having negligible revenue or profit but significant growth. The growth of Alibaba, Tencent, LinkedIn, Facebook, Twitter, Snapchat and Yelp should be seen in the 50% y/y range. The growth of mature companies is more modest: Microsoft (<10%), Google (12%), Amazon (15%).
Apple is an exception with recent growth in the 30% to 40% range.
Markets therefore value internet services at multiples of 10 to 20x revenues and 50x at least in terms of operating income. These multiples don't yet apply to Unicorns, since they typically don't have revenues, but the expectations are typically in this range once they do.
Mature product companies are valued more cheaply with 2x revenues for Amazon (a retailer with zero margins) up to Google with near 6x. Apple and Microsoft are in the middle at 4x revenues.
Mature company value as a function of income is also much lower ranking from about 12 for Apple to 22 for Google. Amazon's multiple is astronomical only because it has almost zero income.
Finally, when considering growth and income together ((When seen into the future this is the PEG ratio or Share Price/Earnings/Growth. When seen into the past, this is the PETG or Share Price/Earnings/Trailing Growth)) both emerging services and product companies are priced between 1.3 and 2.5. The outliers are Amazon due to its lack of income (PETG of 358) and Apple with its enormous income (PETG of 0.4).
This last ratio has had a "rule of thumb" of 1.0 being the "fair value" with <1 being seen as under-valued for growth and >1 being over-valued. Alternatively it can be seen as either pessimism about sustainability or optimism, respectively.
Clearly Unicorn Mania (or Unicornia) is a reflection of an optimism around new market disruptions in many industries where software has suddenly become ingestible. Old-school software companies are seen as less exciting in this context. If only they could take part in these new market creating opportunities then maybe they too could benefit from this optimism.
Searching for "iPhone killer" returns millions of hits. It's hard to remember any phone/product/service/platform/initiative/merger/startup which was not at some point considered an iPhone killer. A sampling is offered here.
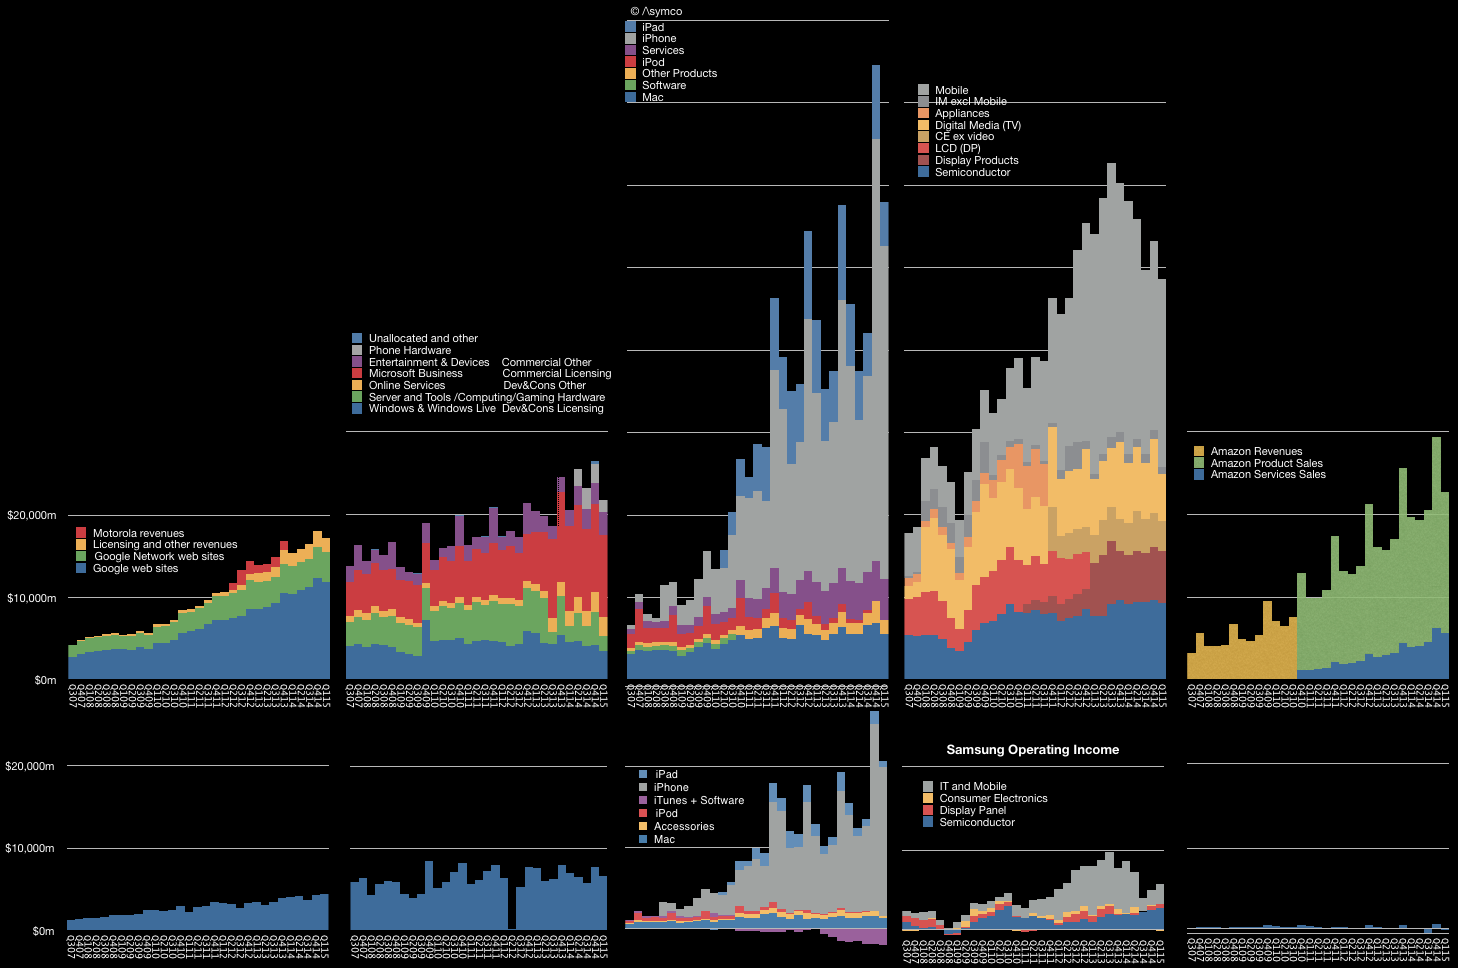
In reality, the killers seem to have all faded away while the iPhone continues. We could just shake our heads and move on, but a deeper analysis is possible. Take a look at the graph above. Note that iPhone's (and hence Apple's) ascent has not caused decline in its nominal competitors. When seen in the context of the graph above, the success of the iPhone has in fact been complementary to those companies who would be its killers.
Consider that the iPhone drives a large portion of Google's revenues as it is the home to many Google services and engagement through the iPhone is higher than any other platform, including Google's own. iPhone users tend to make better customers. In exchange Google pays a great deal for traffic acquisition on iOS devices. The placement of search on Safari is probably the biggest single cost item on Google's income statement ((Estimates are a few billion dollars a year.))
The iPhone example drew Google to build Android as a facsimile and that, coupled with Brobdingnagian spending on marketing, led to Samsung's Galaxy success. That success seems to have peaked and the brand is now a victim of low-end disruptors which copied it and the iPhone in turn. However, Samsung electronics benefits from the iPhone in terms of its semiconductor division. Apple is Samsung's biggest customer and the semiconductor division is now the largest source of operating profits.
The explosion of Android has led to IP licensing revenues for Microsoft and now Microsoft is extending its software applications to iOS, hoping to participate in the iOS ecosystem rather than competing with it. The time may come when Microsoft shows growth from the iPhone.
Finally, although it may seem oblique, Amazon is benefiting from the iPhone. Instead of killing it with the Fire ((presumably as a low-end disruption)), the iPhone and iPad offered much more mobile shopping opportunities to the Amazon store. Data shows that iOS leads in shopping traffic and order size precisely at a time when Amazon obtains its largest volumes. Amazon's AWS also handles a great deal of iOS-originated traffic.
This alternate reality shows that the benefits from the iPhone revolution are broad and deep. It's not just the direct revenues (($25 billion paid so far)) from app sales on the App Store but also the creation of entire new communications modalities (Instagram, Snapchat, WhatsApp) new services (Uber, Airbnb) and the multi-billion dollar accessories markets. These benefits are largely unmeasured and therefore not visible in accounting systems. They are perceivable however.
Users perceive the value, developers perceive the value and, in the end, the only account that matters, the brand, accrues these perceptions to grow in value.
As the brand flourishes, the perception of vulnerability dissipates and the narrative shifts from Apple getting killed to killing it.
It's taken eight years and 500 million loyal users but, perhaps, just perhaps, this change in perception is entering the collective consciousness.
In the fourth quarter of 2013, mobile phone sales in mature regions fell due to weaker demand."Mature markets face limited growth potentialis the markets are saturated with smartphone sales, leaving little room for growth with declining feature phone market and a longer replacement cycle," said Anshul Gupta, principal research analyst at Gartner. "Lack of compelling hardware innovation has further exacerbated replacement cycles for high-end smartphones in 2013 because consumers don't find enough reasons to upgrade." - Gartner
Anshul Gupta's assertion of market saturation was not the first. IDC also cited "a number of mature markets nearing smartphone saturation" in late 2013.
Shortchanging the smartphone market is nothing new. It was happening very early in the market's formation when initial growth was not as rapid as expected. I recall Nokia managers disappointed with sales growth losing faith in smartphones in 2004. Eleven years later, the market is still growing.
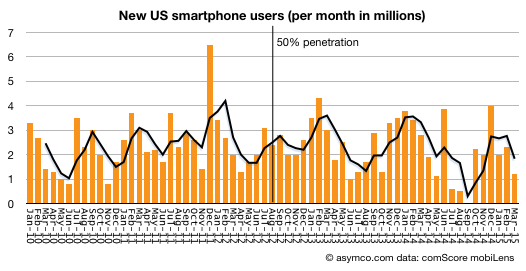
comScore reported that during the first quarter of 2015 the US market was adding over two million new smartphone users every month. These are not two million units sold every month but two million new users who began using smartphones for the first time ever, every month.
Since the end of 2013 when both IDC and Gartner declared the onset of saturation in "mature regions" ((The US is the most mature by penetration data)) 31.5 million new-to-smartphones Americans adopted the product. That's an addition of 11% of the sampled market.
And the sampled market is just a subset of the addressable market. comScore only counts 'primary phones' in use and excludes company-purchased devices and any users below age 13.
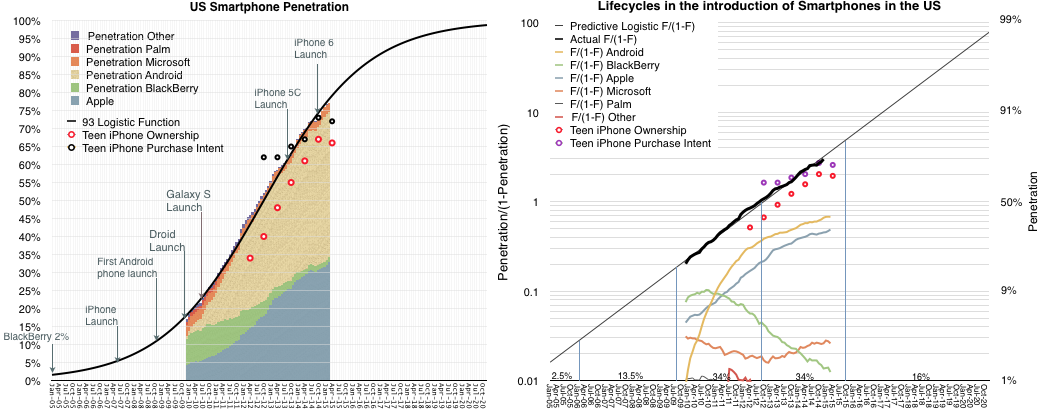
So according to comScore's data, the US market is at 77% smartphone usage. My assumption is that saturation would come at the earliest at 90% and could be 100%. ((Of the market comScore measures)) The fact that conversion to smartphones is still proceeding at roughly the same rate it has been for five years, makes this assumption pretty safe.
The pattern of growth fits a diffusion S curve (Logistic curve) as closely as ever:
Note that the curve continues to rise even into 2020, and that this is the US only.
The US is the most highly penetrated market but it's not the biggest. That would be China. So it's not surprising that two years after declaring US growth was over, IDC claims "China's smartphone market has reached saturation".
Chinese penetration is far below the US. It was estimated at 43% by the end of 2014. If we assume Chinese users are no less hungry for information than US consumers, then why should Chinese stop adopting the technology at less than half of US levels of use?
That would be risky.
This understanding of the maximum potential of a market — its highest level of user adoption — is crucial for product development. Paying attention to short term sales trends blinds you to the power of the job your product is hired to do. Your product's purpose is not to be sold, but to be hired. If your product is powerful enough, it can be hired for universal jobs and it should be desired by all consumers, not just the fickle.
Being patient for growth means that you can release features when the majority of users can absorb them, not just when early adopters choose to play with them. Often, early adopters offer feedback which is off-putting to later, mainstream adopters. In engineering and design one has to always make compromises. The right balance at the right time avoids overshooting a market or under-performing against competitors.
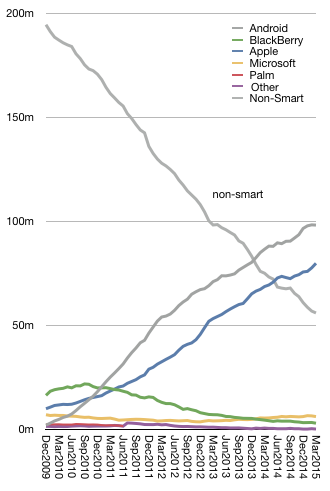
There are plenty of examples of getting it wrong (see the graph on the right above).
At this stage in the US market, the iPhone has more than 80 million (sampled) users. Android has about 100 million. It's still a growing market so apart from BlackBerry, ((Three million BlackBerry users in the US remain.)) the churn between the smartphone platforms is still minimal. The two main platforms are still harvesting non-consumers.
This will change of course. And when it does, the competition will shift from winning against non-consumption to winning against other-consumption or over-consumption. That post-saturation competition will be decided by brand loyalty as much as anything else.
---
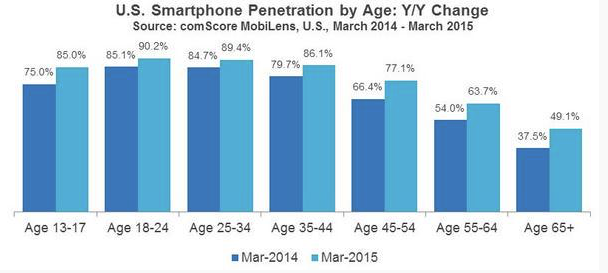
Update: comScore just published US Smartphone penetration by Age which offers some clues where smartphone hiring is still going on. (Note: <13 ages are not shown).
The history of the Personal Computer market (since 1981) is shown below:
Note that I added a forecast for 2015. Data from Gartner shows Windows PCs declining at a 6% rate in Q1 with a full-year forecast of -2.4% (including OS X). Assuming 20.7 million Macs, the Windows PC market will decline to 285.6 million units (from 295 million in 2014). My estimate is that iOS and OS X combined shipments will total about 302 million.
If this rather conservative forecast is correct then in 2015 Apple will ship more iOS and OS X computers than all Windows PCs combined ((This excludes iPod touch, Apple TV and Apple Watch. PC data is from public Gartner press releases.)) .
Paying for TV has been a curious consumer phenomenon. There was a time when TV was free to consumers. It was delivered as a broadcast over-the-air and paid for either by commercials (US mostly) or by taxes on viewers (Europe mostly). The consumers were delighted with the idea as it was far better than radio and radio was delightful because it was far better than no radio.
The process of convincing consumers to pay for something that used to be free was quite interesting. The first benefit to be articulated was that the quality of the picture would be much better. It would, in essence, be noise-free. ((This was in fact the birth of cable TV: a shared antenna for a community in an electromagnetic shadow))
The second benefit was an increase in the number of channels. VHF and UHF television would cover about three and 5 channels respectively while cable could offer dozens, many specializing on specific types of content like the Home Box Office (HBO) offering movies and ESPN offering sports only and MTV music videos and CNN news only.
The third benefit was fewer (or no) commercials for some of the channels. This was especially valued by fans of movies whose interruption by commercials was often detracting from the immersive value and continuity of the cinematic experience.
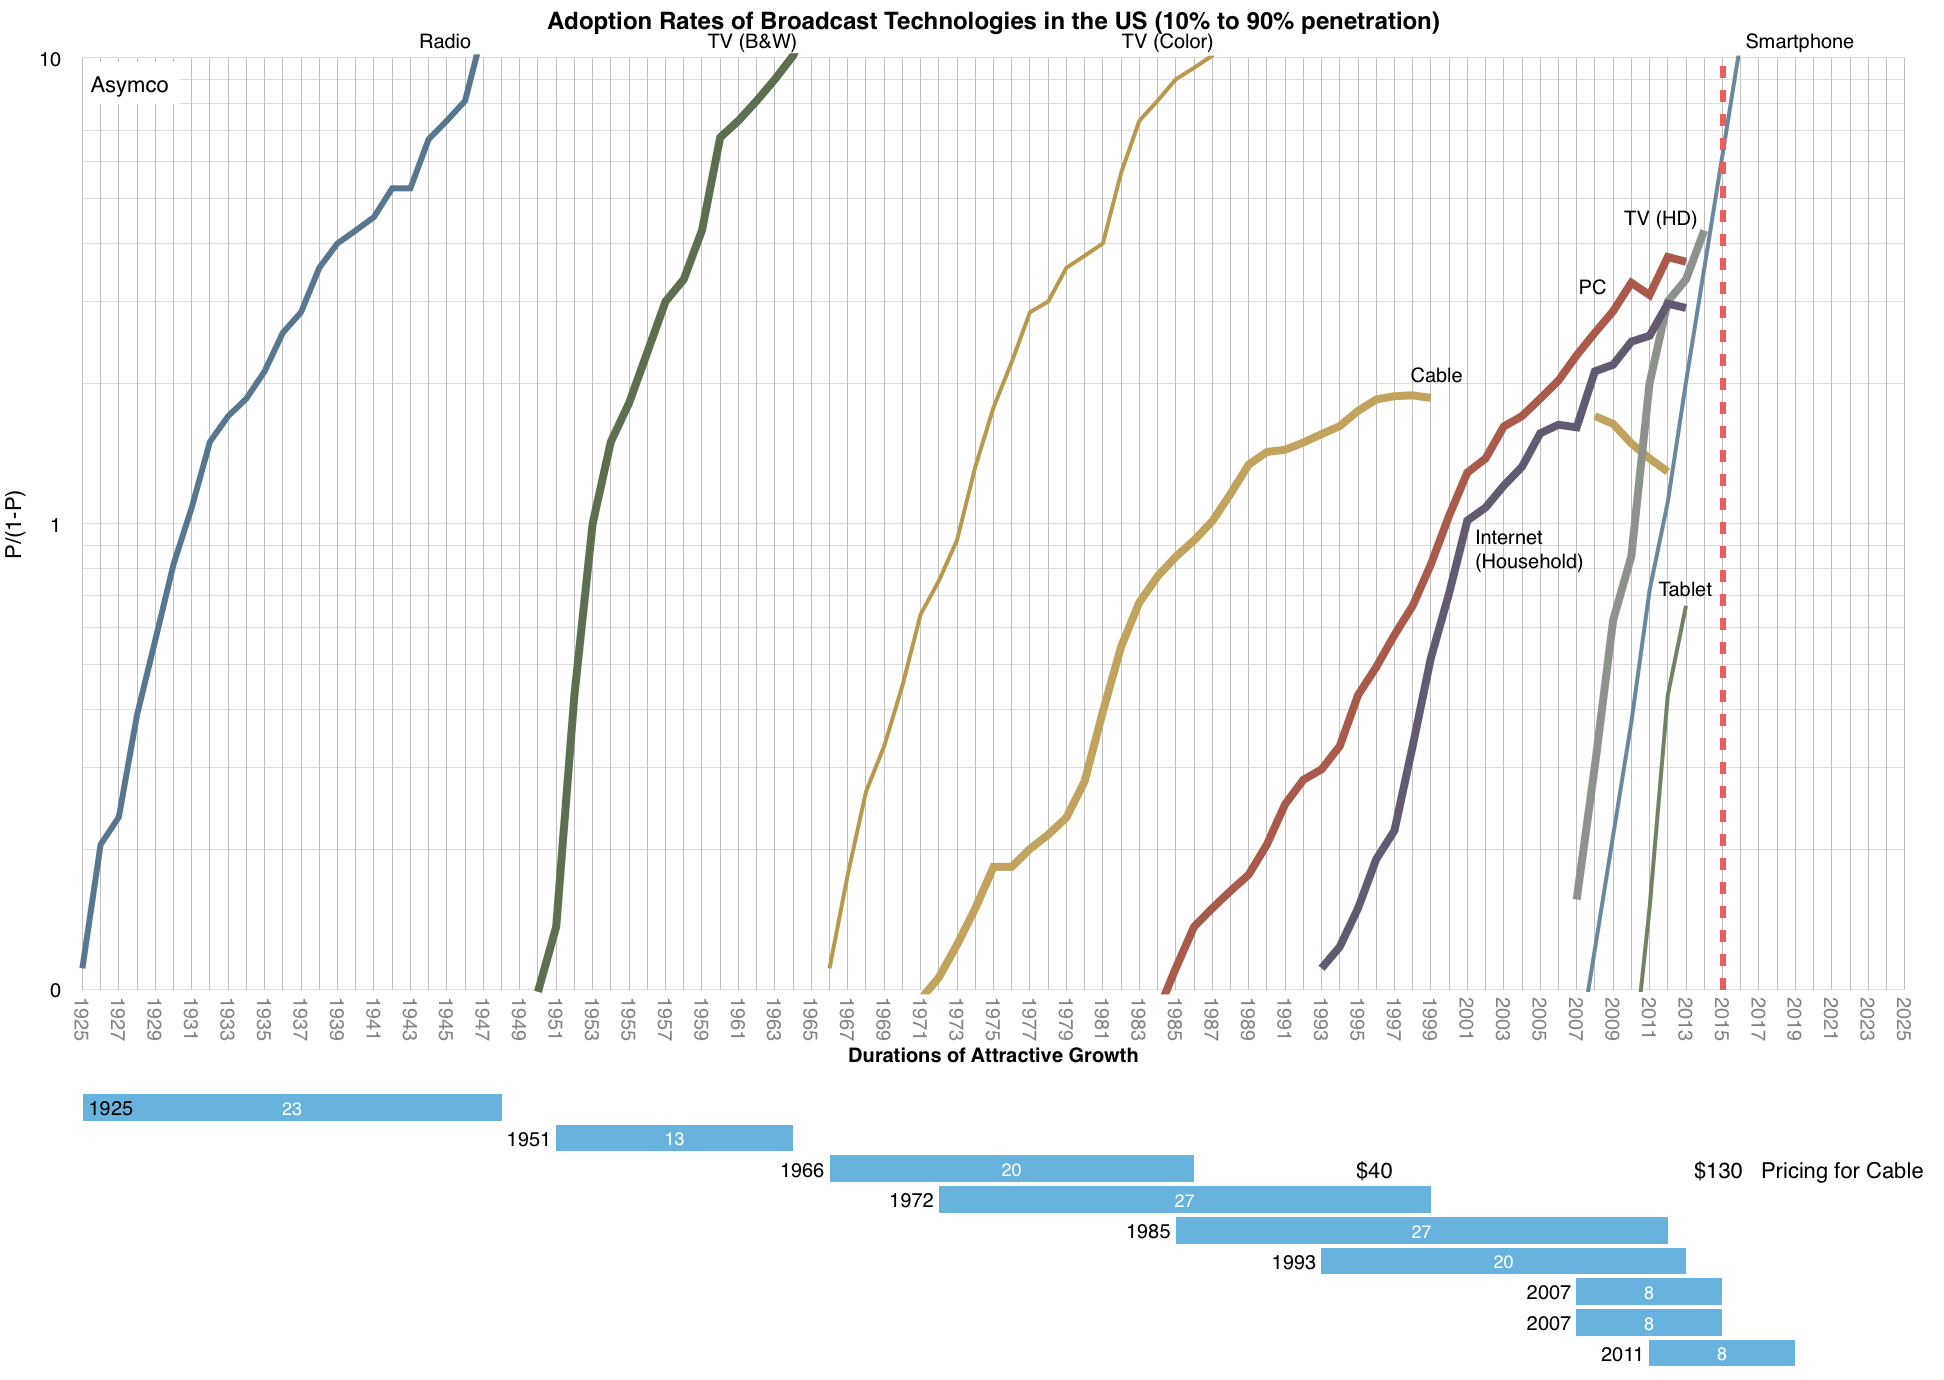
These benefits were very attractive during the 1980s, to the extent that about 60% of US households adopted cable. An additional group later adopted satellite-based pay-TV as the technology became reasonably cheap.
These benefits were priced modestly but as the quality and breadth of programming increased, prices rose. An average cable bill of $40/month in 1995 is $130 today ((a 6.1% compounded rate of price growth vs. a 2.4% rate of inflation)). Some of that revenue went into upgrading the capital equipment in use (the plant) and some into paying for the higher production values. Yet more went to the sports leagues and their players whose business models increasingly depended on broadcast rights.
And so over a period of about 40 years, watching TV went from free to quite expensive. More expensive even than a family's communications costs (i.e. telephone service.) That's quite an achievement at a time when technology diffusions caused huge price reductions in other goods and services. Consider that the TV set used to watch the programming improved dramatically while decreasing in price over the same period.
Meanwhile, some of the benefits began to be less relevant. Commercials are more abundant than ever. Ad buyers spend about $60/month per household to deliver ads ((Implying that the TV "business" has a $200/household/month revenue model)) The quality of the TV picture is actually worse due to compression than one might get with over-the-air digital broadcast. Finally, the abundance of channels is beyond anyone's absorption rate. Those channels which used to be "pure" became polluted and undifferentiated as each tried to be the other. ((A pursuit no doubt driven by seductive but toxic market research))
On top of these paradoxes is the fact that actual penetration of the service has been declining. As the graph above shows, Cable TV has declined (though Pay TV much less so). The industry has reached saturation decades ago and has not offered anything meaningful in terms of innovation.
Disruption theory suggests that once a product over-serves on meaningful bases of value creation (and underserves on value) it opens the door to disruption. Which leads me to ask not whether cable is past its prime but rather why it's still around?
The answers are usually immediate and plentiful: conspiracies of monopolists, lobbying, back-room deals, lock-in of content and all kinds of other misdemeanors. To which I would say: You can fool some of the people all of the time and all of the people some of the time but you can't fool all of the people all of the time.
So again, why have all the people been fooled all this time? Twenty years have passed since the industry reached saturation and prices keep rising. Today the average cable bill is projected to rise to $200/month by 2020.
My answer is that disruption is predictable. Users are cutting cords, the "uncabled" or "never-cabled" are a significant portion of the population. 13.5% of broadband households with an adult under 35 have no pay-TV subscriptions. 8.6 million US households have broadband Internet but no pay-TV subscription. That's 7.3% of households, up from 4.2% in 2010. Another 5.6 million households "are prime to be among the next wave of cord-cutters," according to Experian.
The same phenomenon occurred with mobile vs. fixed telephony. For several years it seemed that mobile was sustaining to fixed or that fixed was immune due to lock-ins. The fixed telephone incumbents insisted that the data was inconclusive. Then the trickle of abandonment turned into a deluge. The quality of service for mobile kept increasing and, with data, it became clear that the mobile devices could unleash unfathomable functionality and value.
And so it goes. A business dies first slowly then quickly. (('How did you go bankrupt?' Bill asked. 'Two ways,' Mike said. 'Gradually and then suddenly.' -The Sun Also Rises (1926) Ernest Hemingway)) The exact timing is tricky because of the non-linearity of the phenomenon. It's also hard to declare end-of-life since business zombies are very common. What is clear however is that the economics will change dramatically and the alliances between talent and distribution will shift to entrants and away from incumbents. The point when we will look back and say that cable was finished will probably come by the end of this decade.
The Auto Industry is significant. With gross revenues of over $2 trillion, production of over 66 million vehicles and growing ((The industry continues to grow, registering a 30 percent increase over the past decade, mainly due to Asia and China in particular)) it seems to be a big, juicy target. It employs 9 million people directly and 50 million indirectly and politically it must rank among the top three industries worthy of government subsidy (or interference). Indeed, in many countries--the US included--government interference makes it practically impossible for a producer to go out of business, no matter how poorly it's managed or how untenable the market conditions.
But this might be the tell-tale sign that danger lurks. Theory suggests that incumbents going out of business is an essential indicator of industry health. Without their exit, entrants are never allowed to bring disruptive ideas to bear and innovation simply stops. Is this interference with mortality the only indication of entrant obstacles? Are things about to change? Is there pressure for innovation? Can we spot other indications of a crisis in this industry?
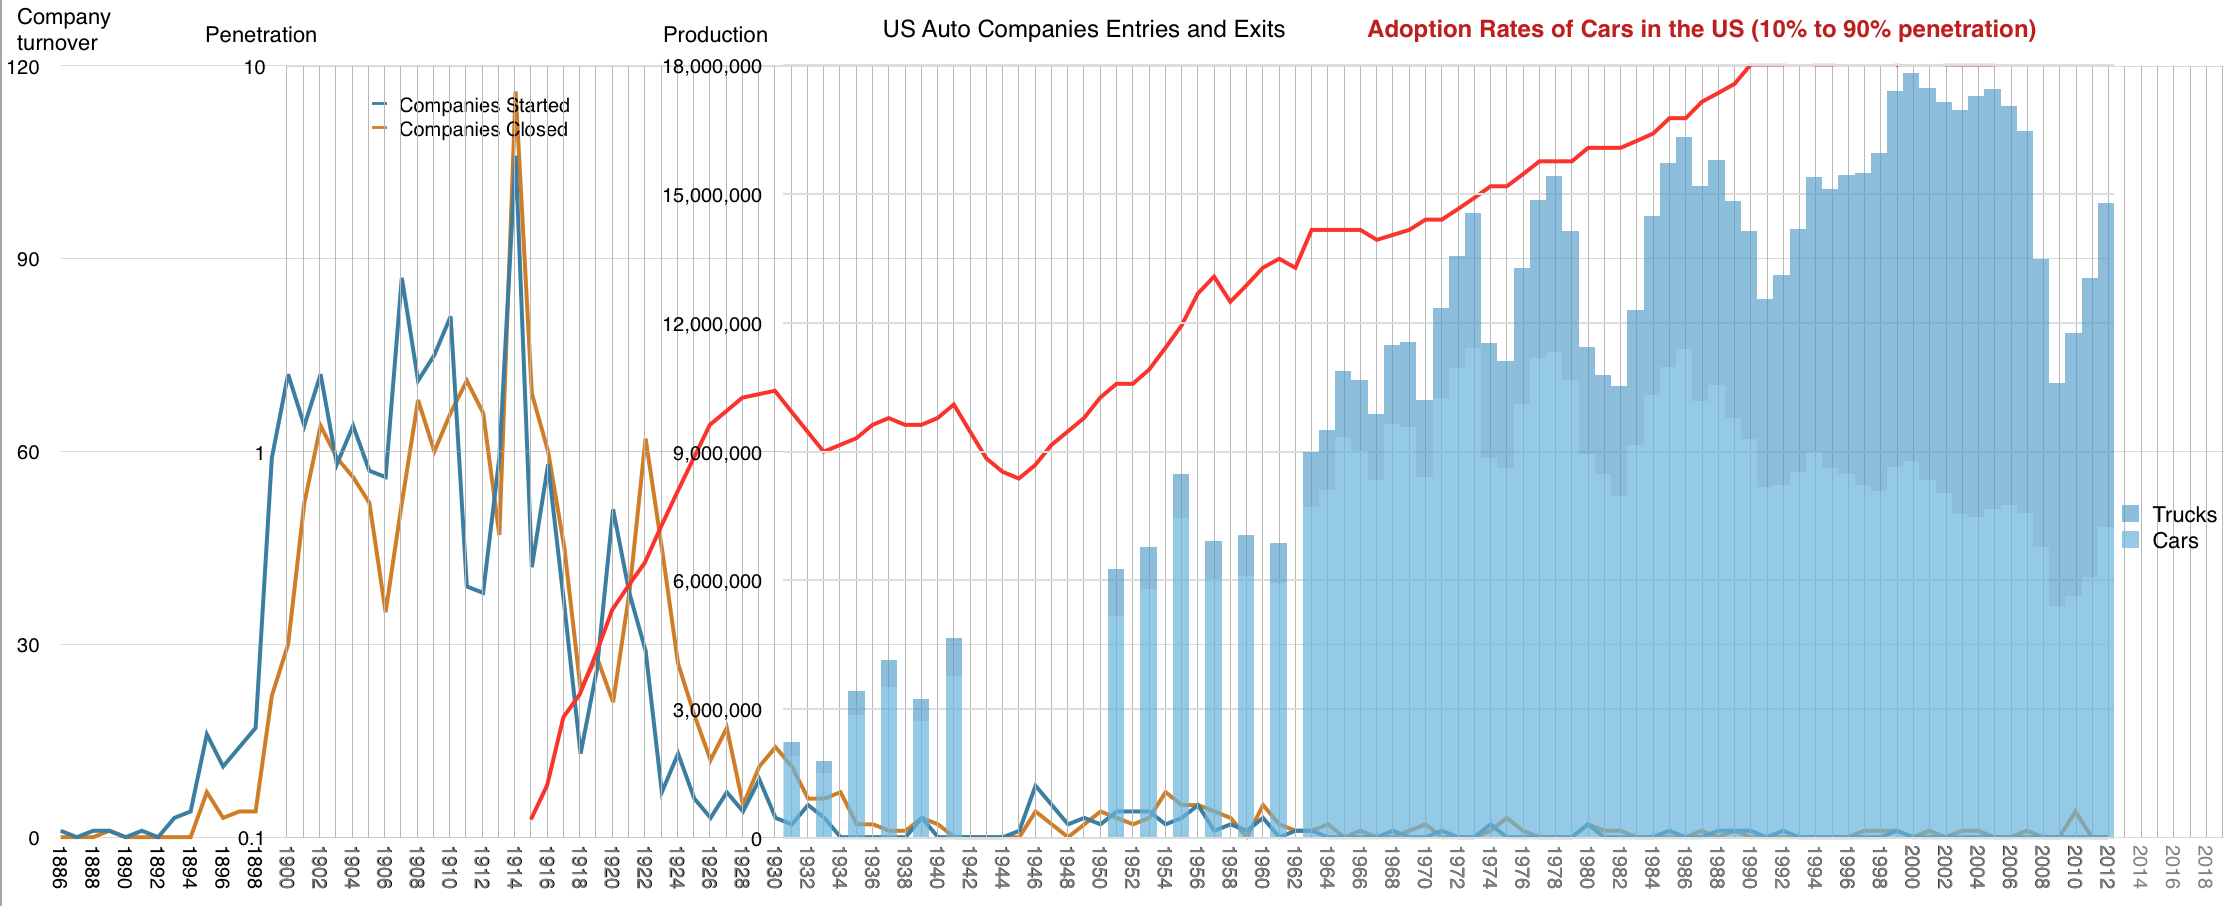
Taking the US as a proxy, here is a graph of the number of new car firm entries (and exits):
The total number of firms ((counted as brands)) that entered the US market is 1,556. The blue line graph shows the entries and the orange line shows the exits. This sounds impressive, but note that the year when the peak of entries took place was 1914, exactly 100 years ago.
1914 was also the year when penetration of the market first reached 10% and the rapid slope of adoption was joined. You can follow this adoption rate as the red line in the graph above ((The line is on a log graph and shows the P/(1-P) where P is the penetration of households)) ((Note that all line graphs have the same x-axis but have different y-axes.))
The first analytical task for the entrant today is therefore to ask why there have been so few others succeeding in the last century. In the last half-century 14 tried and all failed.
One clue is the third set of data plotted above: production figures. The blue area represents the production total for the industry on a yearly basis. ((The graph is split into cars and trucks. You can plainly see the recessions and the patterns of war and peace)). Note that all three data sets have some relationships to each other: Production growth is dependent on new demand growth and that on a household basis demand ceased growing in 1990. Production and penetration accelerated when entries ended. Given the economies of scale in manufacturing, a consolidation occurred and barriers to entry exploded when volumes became significant.
This leads the casual observer to conclude that production is the predominant consideration for participants and that the entire industry revolves around this measure.
Indeed, production is everything. Capacity utilization is the first priority for an auto manufacturer. Capacity is why firms are not allowed to die and entrants are not allowed to enter.
But you don't need the data to tell you this. There are other clues. I will summarize these observations in the following "ten commandments" for the industry:
It's easier ((read: cheaper)) to design and build a Ferrari than a Ford. At its logical extrapolation of this rule one can observe that a Formula One team is a trifling hobby compared to the effort needed to build the shabbiest of hatchbacks.
Low-end disruption happened early in the adoption curve. The very first cars were luxuries, but the Model T from Ford set up the Ford production system as a template for all and it was a low-end disruption. It happened 100 years ago. The Volkswagen Beetle and the Toyota Tercel were also low-end and they built non-US concentrations for production in the 60s and 70s. Same can be said for Mini, Fiat, Renault and Citroen. More recently Korean and Chinese entrants have appeared but they have not been disruptive.
Almost all meaningful innovation occurs in the production system (not the vehicle). The improvements in vehicles are many but they have not been meaningful in the sense of shifting any of the power in the industry. Certainly not to new companies. The production system innovations of Ford, GM and Toyota allowed them to establish what is to date an unassailable power base of production. If you want to find the next "big thing" in automobiles, look for a new production system.
To understand how cars will or won't change, study roads. There were roads before cars, but not paved and not for going far. Road construction and the deep understanding of safety, capacity and economic impact took 50 years between 1920 and 1970 in the US. ((Thanks to Steve Crandall for many of these insights. He further notes via Twitter that ~1.5% of the US land mass is paved for transportation)) The cars pay for the roads and, as a result, they pay for the logistic system that allowed all forms of powerful businesses to emerge. Walmart, McDonalds and Amazon and the entire retail, food and agriculture sectors owe their existence to the roads that car adoption paid for. Furthermore, the real-estate and entire living structure of many countries depends on roads. If you want to change the car you have to also understand how the roads need to change. ((Hint: for cars to improve through the reduction in the need to be driven, an understanding of their environment--roads--is mandatory. This is an information problem mainly but it's also a regulatory and tax problem.))
There has never been a disruption based on drivetrain innovation. Everything to date has been sustaining. Since 1886, the internal combustion engine has been dominant. Even though there have been diesel, natural gas, all-wheel drive, front wheel drive and electric drive, none of these innovations have changed who controls the profits in the industry. Hydrogen fuel cells won't either. The reason is simple: incumbents can easily adopt/buy any improvement/innovation as it sustains their production-oriented profit formula. Entrants with drivetrain innovation can't build a business model moat around the idea without a production base.
China is the largest producing (and consuming) nation. The global center of production shifted over the years and tends to follow consumption. As a new middle class emerges, the fact that China is leading now should not be surprising. As each new producing center was built, it created an opportunity for local entrants, however they did not displace the incumbents rooted in other markets. This is mainly because they were protected and they were protected because of political considerations including jobs, taxes (roads), etc.
Almost all car companies own each other. There is a vast cross-ownership network and a disinterest in independence. This is again due to production-led thinking. The spreading of over-capacity or under-capacity risk leads firms to disregard product or market considerations and enter into joint ventures and partial acquisitions. Portions of manufacturers are bought and sold by competitors almost as regularly as they are bailed out by governments. Competition is therefore perverted if not prevented.
For most motorists, congestion is a bigger problem than any deficiency in the vehicle. We think people want better cars, but they don't. Cars stopped getting "better" and started becoming worse when congestion became common and congestion became common when saturation was reached. We can't build more roads (see Commandment 4) and as populations grow, the traffic becomes unbearable. The vehicle's role switches from freeing to constraining. The industry is adding cupholders to alleviate the problem.
Contract manufacturing is nearly non-existent. Unlike other industries which modularized long before saturation, automobile manufacturing is largely inter-dependent. You can't buy your chassis from one maker, the body from another and fit the electronics, user interface and engine from a few others. All available configurations come from one brand. This is symptomatic of the production system leading to innovation insufficiency.
It's easier to make a car go fast than to make it go far. This rule is partly corollary to the first rule (Ferrari vs. Ford) but it is also alluding to fuel and energy considerations. Fuel has always been seen as a handicap for the industry. Crises of availability have been around since the 20's. Somehow demand has led to supply but there are new, unpriced costs to bear. For the industry to continue it needs to solve its own range problem.
All these topics and much more have been discussed in Asymcar, the podcast for those interested in entering the automobile industry.
As technology companies listen to the siren's song they should contemplate the basis of survival in the industry. Whether your approach and innovation sustains the hegemony or changes it will largely depend on your business model being asymmetric to the incumbent. Determining what is and isn't symmetric should be the first step in your analysis.
Horace presents the next class in The Critical MBA. Having too much of a fundamental footing could be a disadvantage when evaluating what theory might apply to a given situation. Could this be why so many fail to understand Apple? In the second half of the show, Horace and Anders discuss Amazon as retail goes online.