Asymco

Asymmetric Intelligence

Industry

  1. Citizen Publisher

    Research · 11 comments

    In March this year Richard Stengel, managing editor of Time magazine, was speaking about the iPad.

    For a while many movies were more like filmed plays, until directors really learned to take advantage of the opportunities of the medium. For the iPad “The medium is waiting for its Orson Welles.”

    The idea that a new medium needs a new media is not novel. The implication that the new media needs a new genius to define it also follows naturally. However, the implications of new media for the creative industries that are built around them are more difficult to perceive. How are the structures of these industries shaped by disruptive innovations?

    Disrupting theater

    To see just how disruptive cinema was, consider the plight of acting talent. In the early years of the cinema (1890s–1900s), performers were not even identified in films. In other words, they were not in the "credits" and far from being "billed". The reason was that stage performers were embarrassed to be in film. Silent film was considered pantomime and since one of actors' main skills was their voice, they were concerned that appearing in films would ruin their reputations.

    Early film was also designed for the working classes, not for intellectuals. With peep shows as the original presentation format, followed by nickelodeons, film was seen as only a step above carnivals and freak shows. Clearly not something that an aspiring actor would want to be associated with.

    So here we have a classic disruption: The new medium was of a far lower quality than live theater. Even lower than the Vaudeville and Burlesque shows. It was, as many other disruptions are pronounced, a toy.

    However, it had a market--a profitable market. Over time, the product improved and within a few decades completely drained the profits from theater, leaving it to serve only the most demanding customers willing to pay high ticket prices and satisfying only their high brow tastes.

    So going from Theater to Cinema involved more than technological or technique innovation. It required business model innovation. Specifically, Cinema technology brought about the "Hollywood" industry, or more specifically, the Star System and the Studio System.

    The Star System was a branding technique designed to signal quality to the public. It remains a basic and fundamental innovation: celebrity as product. The Studio System was a production and value chain innovation.

    The integrated producer

    By the 1930s technological change led to a new value chain: vertical integration, ownership and effective control of distribution and theaters.

    During the Golden Age (early 20s to early 60s) eight companies constituted the Hollywood studio system. Of these eight, five were fully integrated conglomerates, combining ownership of a production studio, distribution division, and substantial theater chain, and exclusive contracting with performers and filmmaking personnel.

    The studios’ efficient, top-down control over all stages of their product enabled a new and ever-growing level of lavish production and technical sophistication.

    Readers may recognize this as the "inter-dependent" business architecture model.

    The studio system allowed iteration and innovation and factory-like efficiency in production. This architecture held sway as the technology remained relatively stable and the market for content expanded to cover most of the world's population.

    In the late 60s and 70s, modularity emerged as a more practical alternative and control over production was separated from distribution. (Theater ownership was removed by anti-trust action). The system that emerged gave more power to producers and directors (e.g. Kubrik) and the talent became independent of the studios.

    The new Welles

    Which brings me back to Orson Welles. Welles' masterpieces were the product of an industry that allowed innovation to happen. They were the product of an era. An era defined by integrated innovation and inter-dependent value-creating business with common ownership and control.

    So when print publishers today think about their future in the era of the iPad, they should consider their value chains and business architectures. Could the new Welles create the new iPad genres to jump off the screen if he worked in a regular publishing firm that outsources practically everything? Or will he emerge from a firm that operates an integrated value chain. A firm like Amazon that owns the device, the publishing system, the retail store and maintains direct relationships with readers?

    It's my opinion that before there is an Orson Welles of iPad there needs to be a Studio System and a Star System for iPad apps. The Star System is nearly there with the current App Store, but it needs discovery and a systematic way of promoting talent. The Studio System has yet to emerge.

    This does not bode well for traditional publishing houses aspiring to embrace the iPad. They are not in a position to create these Systems around this new media and hence to nurture the next Orson.

    It's perhaps ironic that Orson Welles' masterpiece "Citizen Kane" (1941) was the story of a publisher.
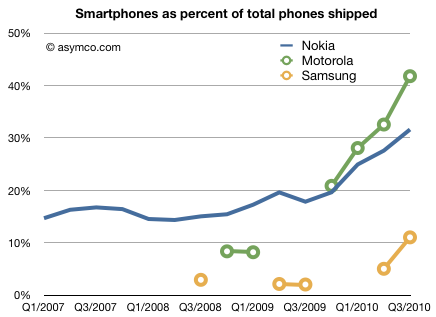
  2. Samsung's smartphones make up 10% of total sold. Nokia is at 30% and Motorola is over 40%.

    Research · 14 comments

    Today's chart: the percent of smartphones as part of the total phones sold for three vendors vendors that have traditionally sold a large portion of voice-oriented phones.

    As these vendors switch to a higher mix of smartphones, their distribution network will ensure a continuing surge in overall smartphone penetration.

    Most of Samsung's increase has come in the last two quarters. Note also the rate of growth in Nokia's mix. Motorola and Samsung owe it all to Android.

  3. How much profit did vendors capture from Android-powered phones?

    Research · 84 comments

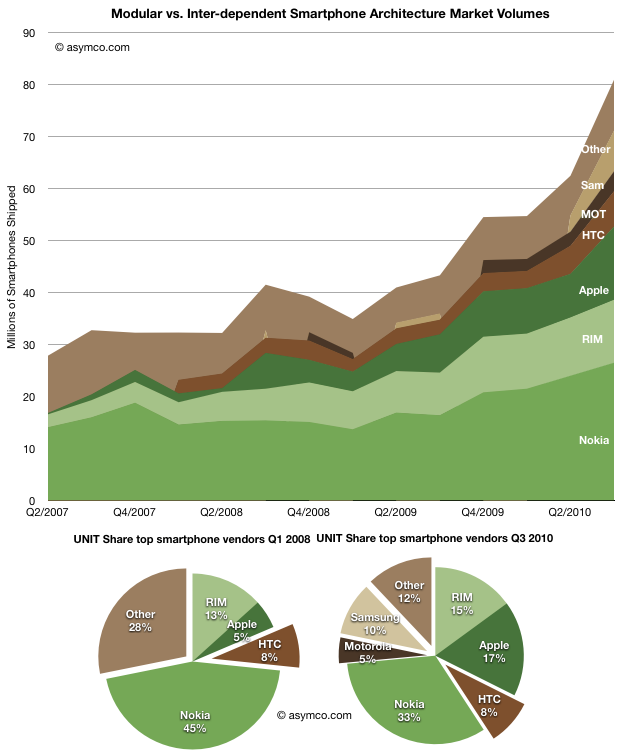
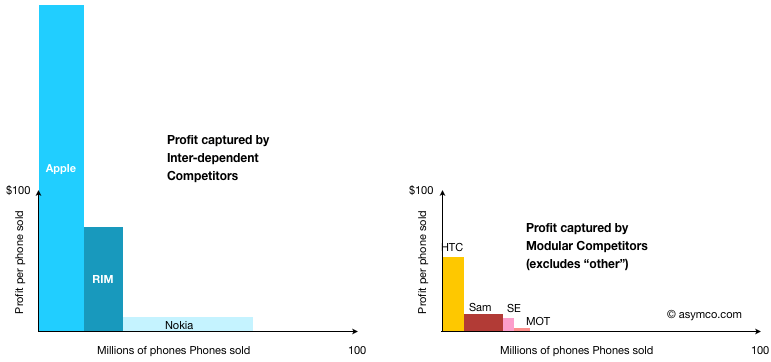
    Following-up on the profitability discussion for the top eight vendors, I built a chart to show estimated profit capture from smartphones, further dividing the vendors into inter-dependent (own OS) and modular (licensed OS)[1].

    The areas shown represent total profits by vendor and architecture. The totals:

    • Inter-dependent: $3.83 billion
    • Modular: $0.59 billion

    Most of the modular profits came from selling Android devices.

    [1]  Samsung and Nokia profits from Smartphones are not directly available and are estimated.

  4. What do you have to believe for an Android dominated future?

    Research · 56 comments

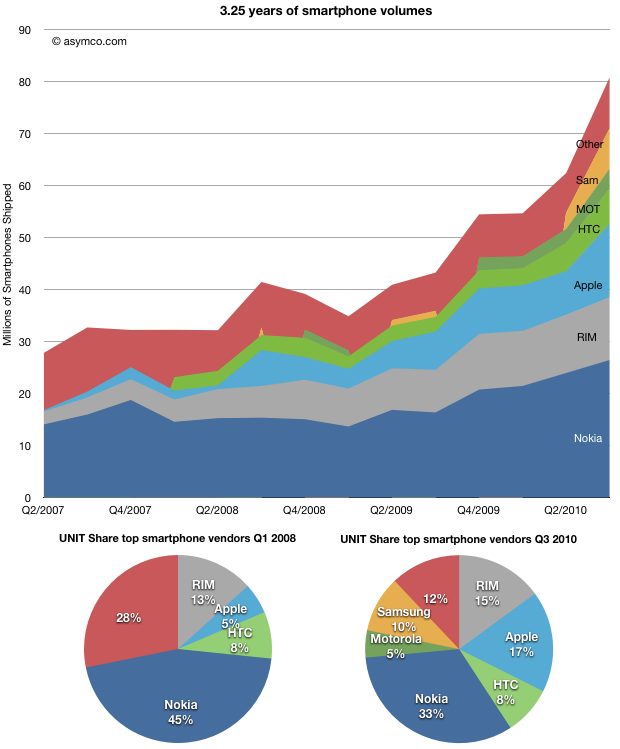
    If we look at the growth of smartphones independently from all phones, the category looks impressive:

    Smartphones are now almost 24% of all phones, up from 10% three years ago.

    What's also impressive is all participants in the market grew their volumes. The rising tide did lift all the boats.

    For this reason it's somewhat perplexing to hear absolute statements about the imminent death of certain smartphone competitors. The non-smartphone market is still 76% of the total phone market. And it's the biggest and easiest target for all smartphone competitors. The data shows that, for the time being, calling the end for vendors or platforms in a market that's doubling every three years is premature.

    But what I really want direct attention to here is a subset of the market: modular platforms.

    If you recall from the modular vs. inter-dependent dichotomy discussion, modular architectures are a way to implement products by licensing core components rather than keeping an integrated development model. I stated that modularity tends to be the better approach when markets are mature/over-serving and inter-dependency is the better approach when markets are young and the products not-good-enough.

    Looking at the chart above you should note that the market is growing extremely quickly so it's not "mature" in that sense, implying a healthy future for inter-dependent players.

    So how are modular vendors faring at this stage of the market and what are the prospects of module suppliers (i.e.  mobile operating systems).

    To help clarify, rather than looking at vendors individually I grouped them by architecture. I took the charts above and changed the colors so that modular vendors (in shades of brown) are represented separately from inter-dependent vendors (in shades of green).

    When looking at the market this way we can make some important observations:

    1. Even though the overall market grew, the share of the market held by modular architectures is smaller than that for inter-dependent. It's also not increasing. In 2008 modular players held 36%, in late 2010, they held 35%.
    2. The suppliers to the modular market changed over the same period, so to a large extent they are fungible. During 2007, the vast bulk of the brown area above was using Windows Mobile. The vast bulk in 2010 is using Android.
    3. The addressable market for Android is constrained to the modular market. Therefore the growth potential depends on whether that brown area increases dramatically relative to the green.
    4. Vendors don't change architecture easily. My knowledge of the competitors makes me believe that none of the green players will change from Inter-dependent to modular, and even if they wanted to change  it's not a simple thing to do. Conversely, changing from modular to inter-dependent is enormously challenging. Company processes, competencies and priorities must change dramatically.

    So what's the bottom line?

    For an Android dominant future, several conditions must be met; one will need to believe all of these to be true:

    • The addressable market for modular solutions will have to grow much faster than that of inter-dependent vendors. [The chart shows in-line growth--again due to the overall growth of the market. The green guys above won't just roll over.]
    • The split of licenses between Android and Windows Phone within the addressable market must favor Android. [Again, this is unlikely as "politics" will interfere. (I won't even touch IP issues.)]
    • The current modular vendors will not become inter-dependent or the current inter-dependent vendors will become modular. [Now why would they tear themselves apart if they are growing?]
    • The profitability of Android vendors must be high enough to make modularity sustainable [more about this later.]

    Talk of Android (or iOS) "domination" is still wishful thinking. With the acceptance of Windows Phone within the value chain (device vendors, operators, developers), the brown area above will be served by two very powerful and motivated competitors. Politics and lawsuits will add drag on growth. Established brands are important to consumers and new brands (like ZTE and Huawei) will have a hard time joining the top tiers with or without Android. Established integrated vendors like Nokia, RIM and Apple don't have modular DNA but do have massive distribution.

    In the end, the real limitation is that the brown area itself is not going to get disproportionately large. Android is limited by its addressable market and that market is a lot smaller than the whole market.

    Looking at the world through modular/inter-dependent lenses lets you see that mobile platform dynamics will not evolve as they did in the PC era. At least not for the foreseeable future.

  5. Absolute value: the handset market stacked

    Research · 18 comments

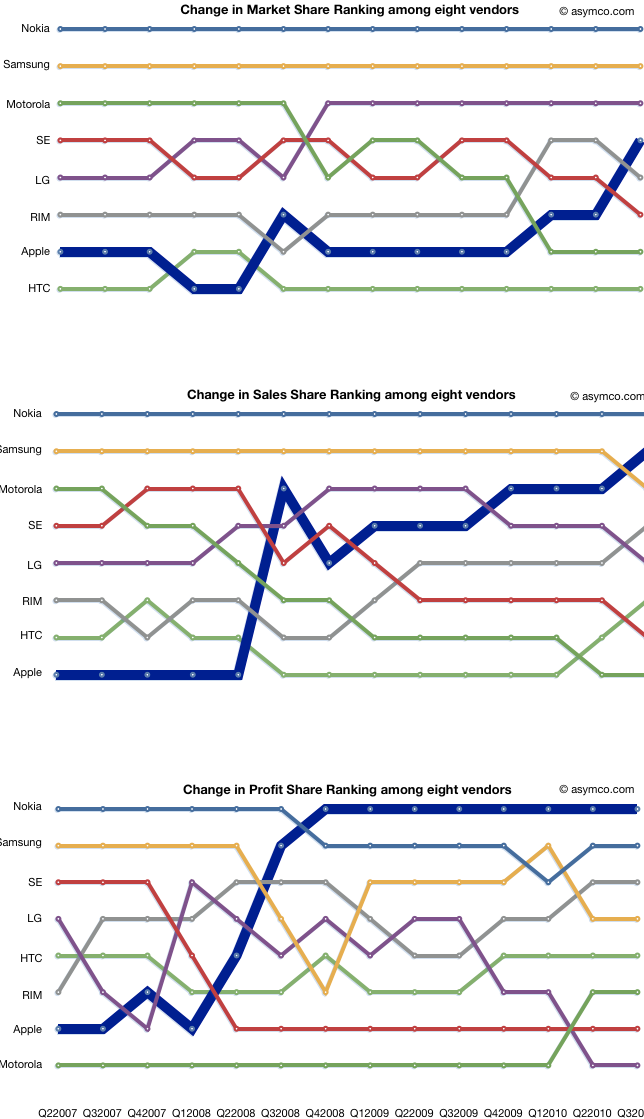
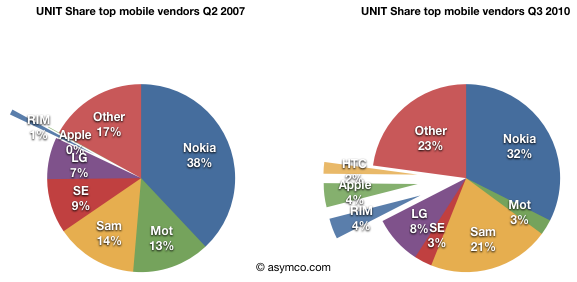
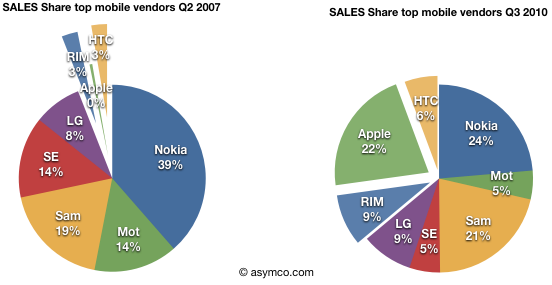
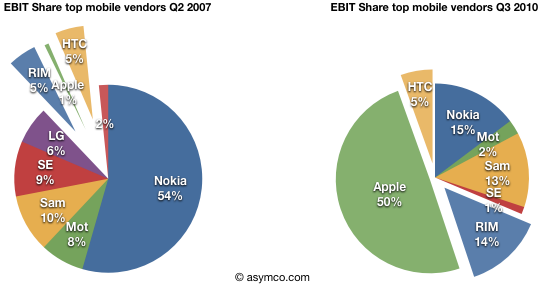
    In previous posts I detailed shares for units, sales and profits. I also offered different ways to look at the data like rankings and profit "area" maps.

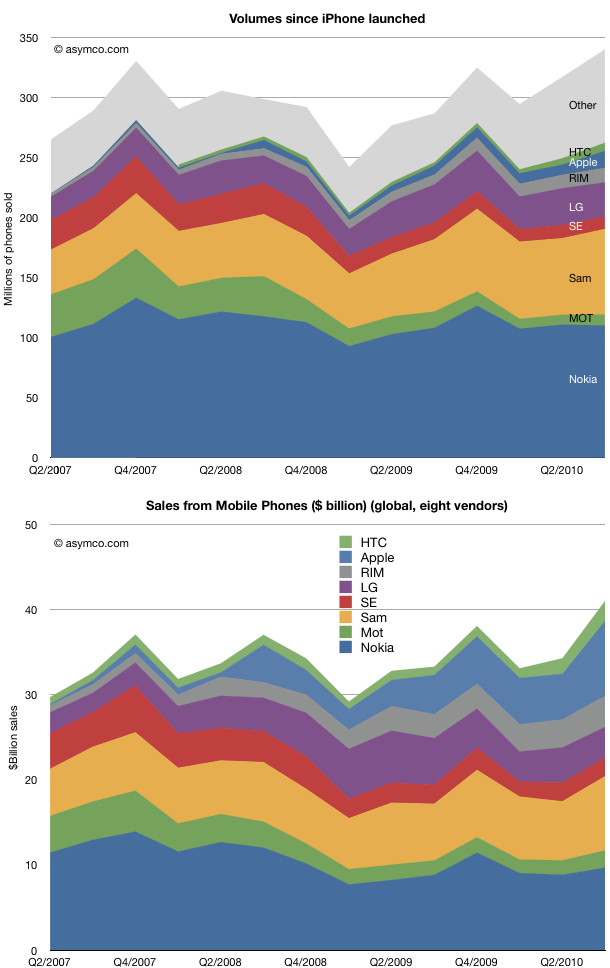
    This article is about the absolute numbers. What is the total market in terms of units sold, sales and operating profits.

    The time frame remains from the second quarter in 2007 to the third quarter of 2010. The same eight vendors are analyzed (with "Other" available for units analysis only).

    The first observation is that the market grew to new heights in Q3. 340 million phones in the quarter means that we might be looking at a very good holiday season. The market was range-bound due to the recession and its over-hang, but there seems to be a good indicator of macro-level recovery

    On an individual competitor basis, the share snapshot pictures we saw earlier gave a good summary of the condition of competitors. Here we see the evolution of absolute units and sales over time. It's instructive to scan the two charts as a pair to see how units and sales are affecting the positions of the participants.

    I clustered the "pure smartphone" vendors at the top of the charts so you can visually separate them from the broader portfolios of the others.

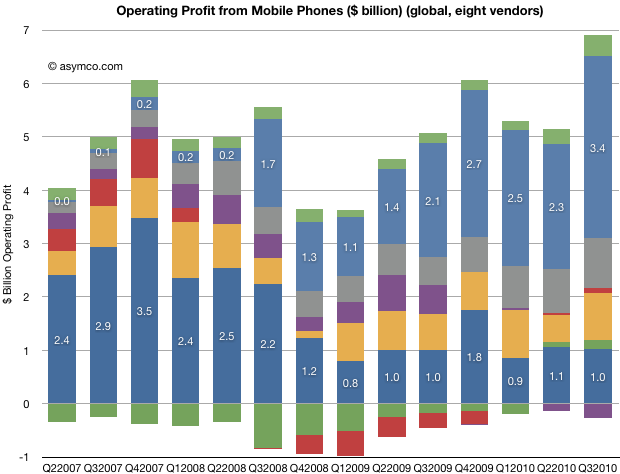
    Finally, here is the evolution of total profitability (operating) for the participants. I annotated Nokia and Apple for calibration.

    (note the color coding legend in the pervious charts).

    What is most impressive is how LG, Motorola and Sony Ericsson seem to be in the same boat. At the same time, Apple, RIM and HTC are outstanding in performance. And Nokia and Samsung are stuck in a dilemma. On the other hand, every vendor is different in many ways, and it's inaccurate to paint them with the same brush.

    Overall, we see a pattern of increased absolute value in the market. All but one vendor is profitable, and sales are increasing. A large part of the growth is due to the transition of the market to smartphones.

  6. Estimating Android market share for the third quarter

    Research · 10 comments

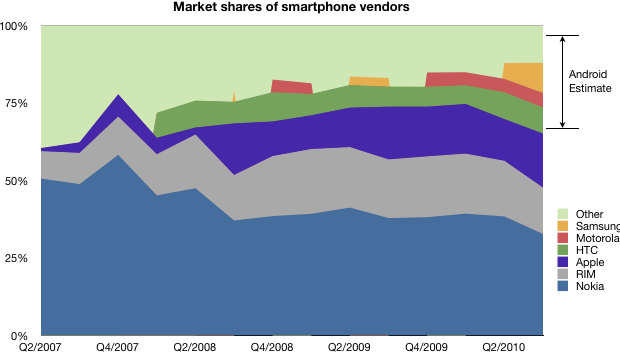
    Take a look at this chart. It combines the known shipment data with the total market size for smartphones as defined by Canalys.

    Knowing the platform/vendor make-up we can estimate the percent of the market that was Android.

    Note that the major unknown is still how much the platform hedgers (Samsung, Other) split their volumes between Android and Windows Mobile (yes, it's still being sold).

    Given this information, I would estimate Android share was around 30% globally. Canalys estimates 25%, which makes this analysis look reasonable.

    On a platform basis, Android gains were mostly at the expense of RIM, Symbian and Windows Mobile as we know that the iPhone share remained steady.

    Note that in years past the licensing vendors predominantly opted for Windows Mobile, a market that Microsoft wants to regain.

  7. iPhone's smartphone share continues to rise

    Research · 7 comments

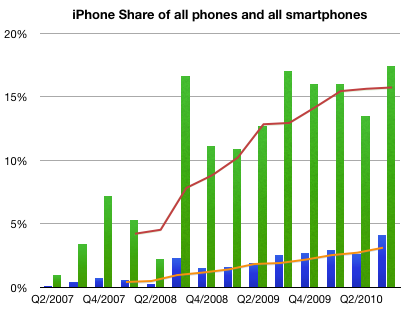
    There is some confusion with the latest Canalys teaser press release. The implication is that Apple has lost smartphone platform share due to the Android surge.

    Using the published data, it's easy to see that Apple has continued to increase share in both smartphones and handsets as a whole.

    I used green bars to represent quarterly share of smartphones and blue bars to represent quarterly share of all phones.

    I used orange line to show trailing four quarters (TTM) share in regular phones and red for smartphones.

    Here are the Q2 to Q3 changes in share for the vendors whose data is published:

    1. Nokia 38.4% to 32.7%
    2. Motorola 4.32% to 4.7%
    3. Samsung 5.11% to 9.71%
    4. RIM 18% to 15%
    5. Apple 13.5% to 17.4%
    6. HTC 8.65% to 8.41%
    7. Other 12% to 12%

    Sequentially, Nokia lost 5.6% of share, Samsung gained 4.6%, RIM lost 3% and Apple gained 4%, Motorola, HTC and Other remained largely unchanged.

  8. What's the opposite of price erosion?

    Research · 44 comments

    In the mobile phone industry, and indeed, in most technology sectors, price decline is a fact of life. Component prices tend to drop while their performance increases. This rapid obsolescence drives prices down constantly. Competition also plays a part as undifferentiated products are rapidly imitated.

    This phenomenon has its own term: price erosion. It's built into most business plans and forecasts.

    But how real is it? What are the implications in terms of market share if one accelerates price erosion or reverses it?

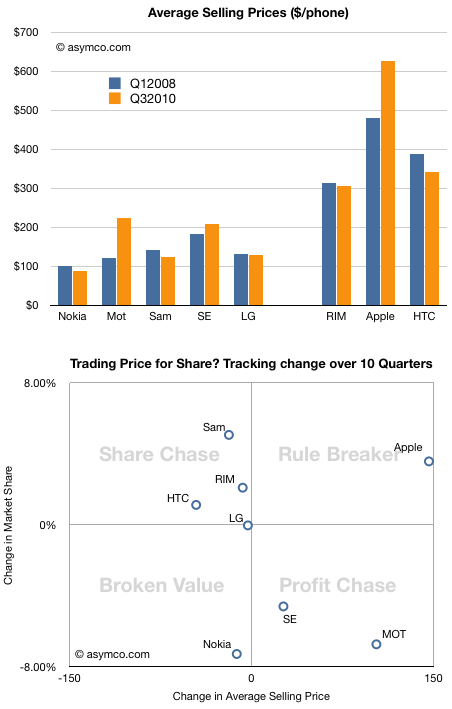
    This chart shows the average selling price for all the vendors whose data I maintain over a period of time.

    Normally, a drop in price is followed by an increase in share, and an increase in price by a drop in share. To test this hypothesis, I tacked on another chart that shows how share and price have been traded off in the market over the last ten quarters.

    Note how prices have dropped for all but three vendors. Two of those vendors (Motorola and Sony Ericsson) have lost share. One, Apple, has gained share. The rest, whose prices did drop, had increases in share, very roughly in proportion to the price drops. Again, we have one exception, Nokia, which suffered both price and share loss.

    Except for these two anomalies, the vendors are placed on the -45 degree diagonal that would show expected price elasticity in the market.

    I took the liberty of breaking the chart into four quadrants, and gave them names suggesting the strategies of the companies.

    Lying along the traditional trade-off axis are either Profit chasing or Share chasing strategies. Anomalies off the axis are either Rule Breakers or Broken Value propositions.

    This view of the companies allows us to abstract and think about market evolution.

    It would be interesting to think how these players will evolve over time.

    It's quite possible that LG will move into the profit chasing model (as they already indicated they would by building more smartphones). These strategies are typical of companies squeezed from the bottom and the top. I once called this group "the biggest losers" and suggested that they are the best target for Android.

    It's also possible that Nokia will move into the same quadrant, though their profit algorithm favors share above all else.

    The biggest question is whether Apple's rule breaking is sustainable. It's not clear whether they are interested in share as that does not have all that much to do with their definition of "greatness". But a platform strategy begs for volumes.

    This remains the biggest puzzle facing observers of this market.

  9. Making it up in volume? How to view unit profitability vs. volume in handsets

    Research · 35 comments

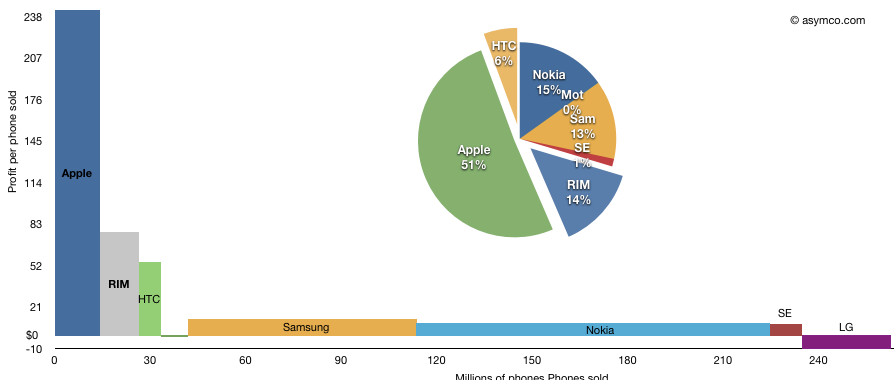
    The following chart shows the third quarter's profitability of eight top phone vendors as a measure of phones sold multiplied by profit per phone.

    I've added the pie-chart showing the rectangular areas as a percent of available profit in the peer group. Note that LG losses are excluded from the pie chart but included in the area chart.

    The total area represents total profit. This representation shows how the largest vendors make relatively little profit per phone but the large unit profit for Apple and RIM gives them a significant share of total industry profits.