Asymco

Asymmetric Intelligence

Industry

  1. That Competition Thing

    Research · 62 comments

    Bill, I think the smartphone market has always been competitive. [Only] the names have been changed.

    Tim Cook responding to Bill Shope's question on the competitive landscape, April, 2013.

    Indeed, over the years, the companies considered Apple's primary competitor have been many.

    In years gone by in the phone market there were RIM and Nokia and Palm and HTC. In the iPod era there was Creative and Sony and innumerable others long forgotten (not to mention the tyranny of DRM).

    Even today we struggle to decide whether Apple competes with Google first or Samsung. Or perhaps with the iPad it's with Amazon or  Microsoft. Or maybe iTunes is threatened by Netflix or Spotify. The Mac surely competes with HP and Dell and Toshiba. What about iCloud? Clearly it's Dropbox or Google Drive. iWork? Both Office and Google Docs.

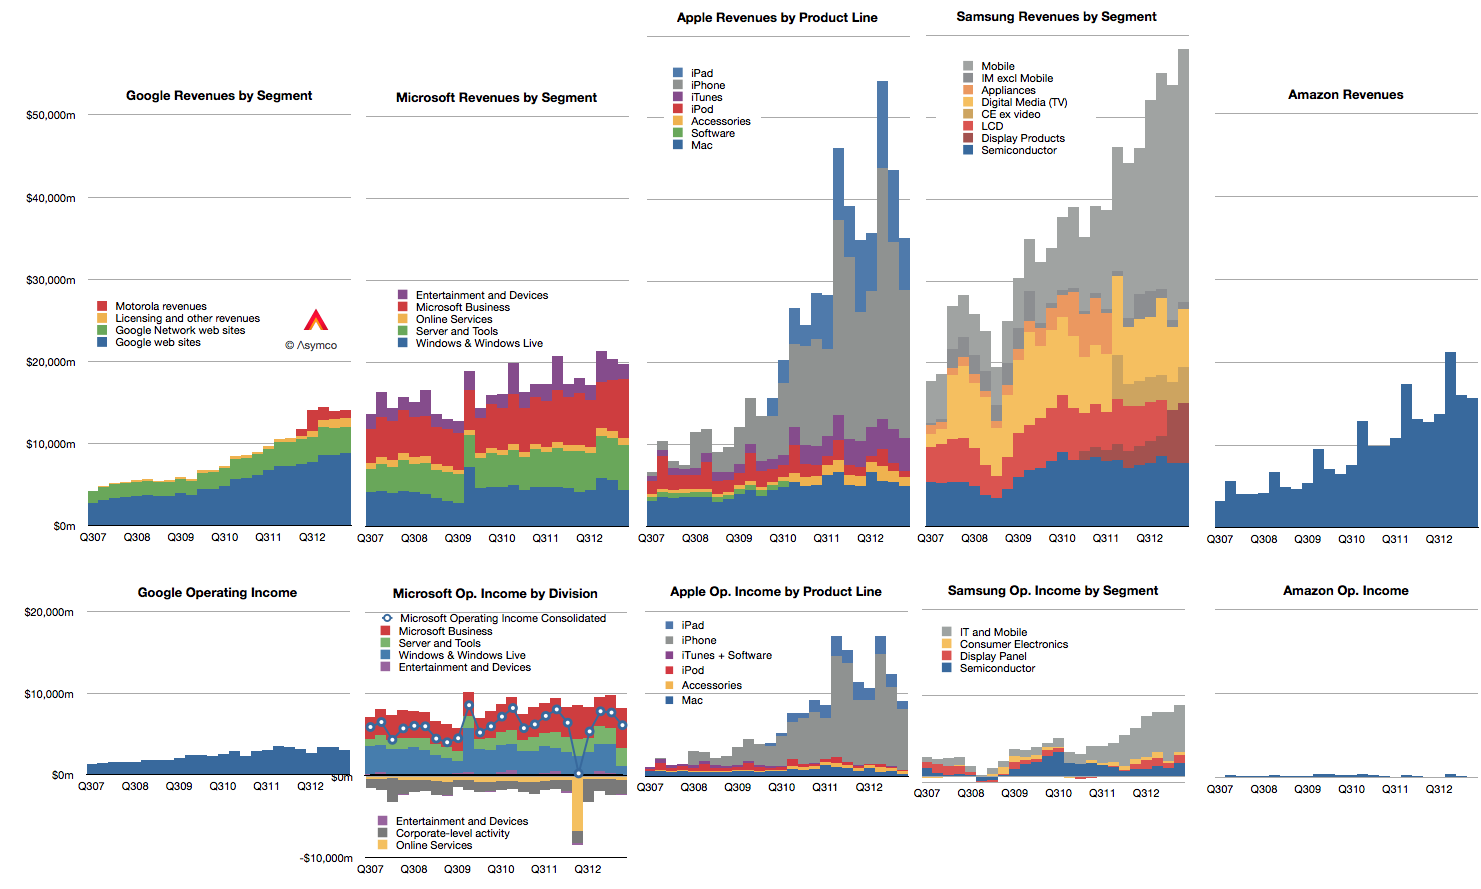
    Doing a competitive analysis for Apple is then mostly a struggle of whom to compare it to. So forgive me that I only track the few challengers shown below.
    Screen Shot 2013-08-13 at 8-13-2.14.59 PM

    Note also that these companies all may compete with Apple to some degree but they may not compete with each other. Competition, it seems, is not transitive.

    There isn't much that I can observe in the data that hasn't already been observed. Google shows steady but not spectacular growth in revenues with decreasing margins. Microsoft shows even more modest growth in revenues with flat earnings. Apple growth is moderating from near vertical while earnings pause. Samsung has great growth but there is a similar set of doubts about its sustainability and finally, Amazon continues to grow the top line by 20% and  has nothing to show for it.

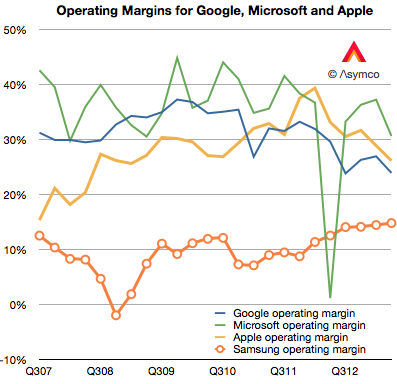
    Operating margins have mostly fallen with the exception of Samsung whose increasing reliance on smartphones has led to a modest increase, though not nearly to the level of the others. (Amazon, lacking in profits, cannot be compared.)
    Screen Shot 2013-07-30 at 7-30-10.54.44 PM


    In summary there is little change to report.

    Except that it's been reported that in the last quarter Samsung managed to "dethrone" Apple from the phone operating profit crown. This is a matter of estimates and for that we need to understand clearly the assumptions.

    I estimate that this is not the case. That indeed Apple remains most profitable phone maker by a wide margin.

    To estimate operating margins you need to estimate gross margin and the allocation of operating expenses (SG&A and R&D) to a particular "division" or product line. The problem is that Apple does not operate as a divisional organization so its marketing and R&D budgets (i.e. people) are not assigned permanently. You have to move them around based on whatever is being worked on at any given time.

    What's more, we need to account for the huge SG&A costs associated with iTunes and Retail. They both consume vast resources which cannot be allocated directly to any product. There are 41,000 people working in retail.  Also, some of the expenses for iTunes are overhead and cannot be considered cost of sales. That's also SG&A. Then there's corp research and design (Mansfield and Ive), which are not allocated to any particular product. When you slice out these costs, there is very little to apply to iPhone, etc.

    So if (and it's a big, sanctimonious if) you want to cast iPhone out as a separate business unit, it would be wildly profitable. There is a huge gross margin of 46% (this assumes a cost per unit of $316) and only another 5% of sales spent on engineering and marketing leaves a 41% operating margin or $7.4 billion. (Why only 5%? Because there's only 10.8% to allocate and after taking out iTunes, Retail you're really only left with 4.49% for SG&A and 3.3% for R&D or 7.79% so 5% is about two thirds of the operating budget).

    If you take all of Samsung's IM division which is PCs, Tablets and phones their operating profit was only $5.6 billion.

    You can see the difference in the grey areas of operating profit in the first graph above.

    Bear in mind that this is still an artificial comparison. The split of profit between product groups is not only an estimate by the analyst, it would be an estimate for Apple itself since it has only one P/L.
  2. Apple's biggest acquisition

    Research · 76 comments

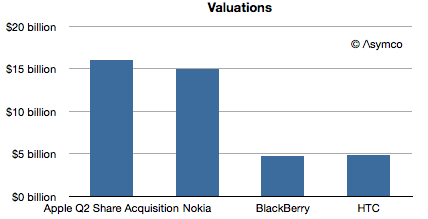
    At the end of the first quarter 2013 there were 946,035,000 fully diluted shares of Apple stock outstanding. At the end of the second quarter there were 924,265,000. The 21,770,000 shares that disappeared were purchased by Apple and retired. Apple shares traded between $390 and $463 during the quarter so it's hard to know exactly how much Apple paid for them, but at an average of $426.5 per share Apple would have spent $9.3 billion

    Management explains:

    In late April we executed a very successful debt offering issuing 17 billion of debt across 3, 5, 10 and 30 year maturities. We paid $2.8 billion in dividends in the quarter and we also utilized a total of $16 billion in cash on share repurchase activity through a combination of a new accelerated share repurchase program and open market purchases. $12 billion of the $16 billion was utilized under a new ASR program initiated with two financial institutions in April.

    An initial delivery of 23.5 million shares was made under this program with the final number of shares delivered in average price per share to be determined at the conclusion of the program, based on the volume weighted average purchase price of Apple’s stock over the program period, which will conclude in fiscal ‘14. In addition to the new ASR, we executed $4 billion of open market share repurchases, resulting in the retirement of 9 million additional shares.

    Later, during Q&A:

    Tavis McCourt - Raymond James: Thanks for taking my question. Peter, first a clarification on the share buyback and can you tell us what the ending basic share count was in the third quarter?

    Peter Oppenheimer: All of that is on the income statement, so you got the ending basic and diluted, but let me give you a couple of points that I think could be helpful for you. During the June quarter, we concluded the first $2 billion ASR program that we started in December and then so we got the final shares in on those, and we did our second ASR program of $12 billion, that started at the end of April and we received 23.5 million shares initially on that. And I went through in my prepared remarks, at some point during fiscal ‘14 that program will close and we will get the final number of shares. We also bought back $4 billion of stock in the open market during the June quarter and received about 9 million shares. So, the impact of those in the June quarter lowered our diluted share count in the quarter by about 22.9 million shares. And as you look forward into the September quarter before any further buybacks or any issuance to employees we would expect to see an additional approximate 11 million share benefit from the things that occurred during the June quarter.

    This is a bit convoluted, but it seems that Apple has committed to buy $16 billion worth of its shares but has not completed the retirements. They see an additional 11 million shares being retired from activities conducted in the June quarter. (Nota bene: when calculating future EPS, take these shares out of consideration.)

    If we add the 11 million yet-to-be-retired to the 21.7 million already retired and assume $16 billion was paid for them then the average price paid was $488.25.

    Not a bad price. Share re-purchases are valuable only if the price paid is low (a determination that is usually beyond the scope of management to make.)

    But what is even more interesting is that if we consider the $16 billion expenditure as an acquisition, then Apple has made what amounts to its biggest. It's more than some familiar companies are worth:

    Screen Shot 2013-07-25 at 7-25-11.38.09 AM
  3. Switcher

    Research · 91 comments

    Nokia's Windows (Smart)Phone performance was drowned out last week by Microsoft's big announcement of the Surface inventory write-off. They are pieces of the same puzzle however.

    First, a look at Nokia.

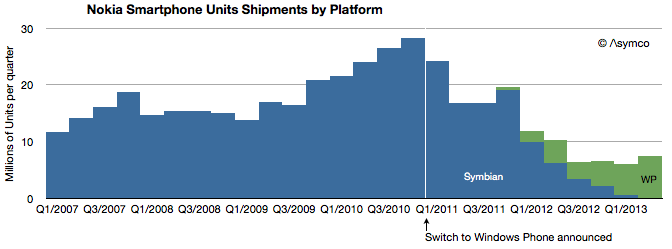
    There were 7.4 million Lumia phones sold in Q2 with 0.5 million sold in the US. Although Windows Phones grew sequentially from 5.6 million the previous quarter, and up from 4.0 million in the same quarter last year, total smartphones are down y/y and nearly flat over the last four quarters. This is of course because Symbian phones have finally disappeared from volume shipments. The following graph shows the history of Nokia's smartphone shipments.

    Although it's tempting to compare Lumia to iPhone (given the premium positioning in the US) the average price of €157 or $206 shows that Lumia is more adequately compared to Android. This is about a third of what Apple gets for its iPhones.

    That's not necessarily a bad thing. Nokia's always had a knack for mass-market phones and certainly that was one reason Microsoft was attracted to them. Presumably, the promise of the relationship was to insert Windows Phone into the Nokia development and distribution pipeline, squeezing out costs and filling up channels.

    Screen Shot 2013-07-22 at 7-22-3.24.21 PM

    The problem for the brand has been that although priced at Android levels, volumes are nowhere near and the gap is widening. At current activation rates, Android is selling 16.5x faster than Windows Phone (assuming 90% of Windows Phones are Lumia).

    So Nokia's problems become Microsoft's problems. As bad as Nokia seems to be doing with Lumia, it's doing a lot better than Microsoft with hardware. Here the story of the great Surface write-off should give pause. Microsoft announced that it would write off $900 million of Surface.  In terms of write-offs this is pretty significant. Compare it with the debacle of the PlayBook write-off when BlackBerry (then known as RIM) wrote off $485 million for tablets it could not sell. Or with Microsoft's own write-off for the Kin which took $240 million out of its shareholder's pockets. The only charge for hardware that I found higher was Microsoft's own Xbox 360 which cost it $1 billion for the "red ring of death".

    But this is not an unusual situation at Microsoft. Besides Xbox, Kin and Surface, Microsoft also declared victory in (read: shut down) SPOT watches, the Smart Display, Tablet PCs and the Zune. This is why when I heard about the Surface I asked who would be Microsoft's Tim Cook.

    By the way, $900 million write-off could amount to over 3 million devices, more if Microsoft is assuming some residual value in the inventory. Misjudging demand to such a degree that more units are disposed of than sold implies a basic failure of understanding of hardware businesses.

    Which brings up the question of what Microsoft will do. They are likely to double down on hardware (also signaled by their re-org) simply because in a device world (read: post-PC) the economics of licensing Windows and Office are evaporating. The price points of EULAs simply don't hold and there are good enough alternatives in use by the hundreds of millions of iOS and Android devices out there already. By withholding Office from iOS and Android, Microsoft has shown a billion people that they can live without it and they already knew they could live without Windows.

    So rather than fight, Microsoft chose to switch. Switching from software to hardware, however, is proving very hard. I'm sure quite a bit harder than management  thought.

  4. The PC Calamity

    Research · 70 comments

    As Intel has improved its products, their demand has decreased. Enormous efforts put into improvements are neither valued nor absorbed. The problem is not with the processors themselves but with the systems within which they are built:

    Screen Shot 2013-07-18 at 7-18-11.16.38 AM

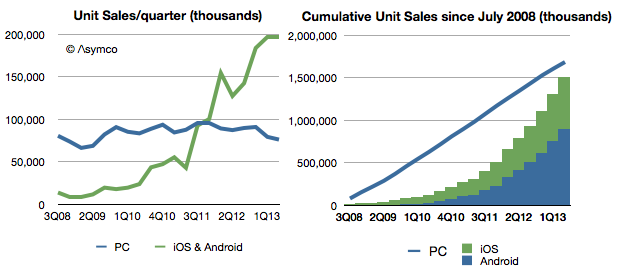
    PC sales fell again last quarter and the contraction is likely to continue. We received affirmation of this as Intel cut sales and earnings forecasts and the crucial capital spending that creates supply in the longer term.[1]

    At the same time, computing device sales have soared.

    Screen Shot 2013-07-18 at 7-18-5.07.35 PM

    Even excluding Android devices which don't register with Google's Play Store (and excluding Windows Phone devices), mobile ARM devices are selling at 2.6 times the rate of Intel-powered devices. Put another way, since the birth of Android nearly as many iOS and Android devices have been sold as PCs.

    In terms of install base, a computing category that did not exist six years ago has come to overtake one that has been around for 38 years.

    The calamity for Intel has been that they have had no part to play in the new category. Perhaps that is because they had every part to play in the old category.

    --

    Notes:

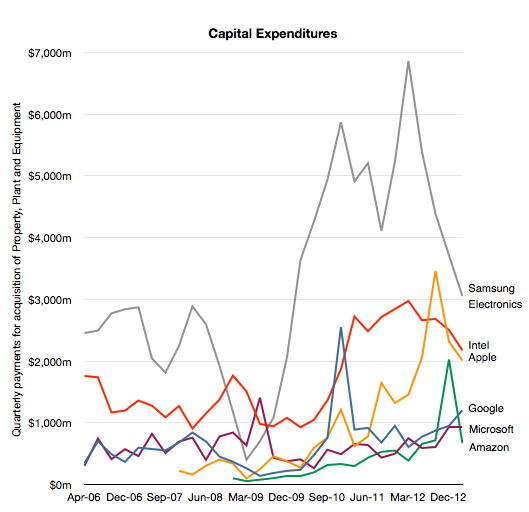
    1. Intel said it was cutting 2013 capital spending to $11 billion. The cut follows a reduction from $13 billion to $12 billion in April. Apple's budgeted capital spending for fiscal 2013 (ending September) was set at $10 billion.
  5. "Everybody has got a smartphone"

    Research · 63 comments

    … says UBS analyst John Hodulik, as quoted by the Wall Street Journal.

    No they haven't.

    According to the latest comScore survey data, 98 million Americans above the age of 13 don't use a smartphone as their primary phone. That's 41% of US mobile phone users.

    What's more, 2.5 million more people first started using smartphones in the three month period ending May vs. the three month period ending in April.

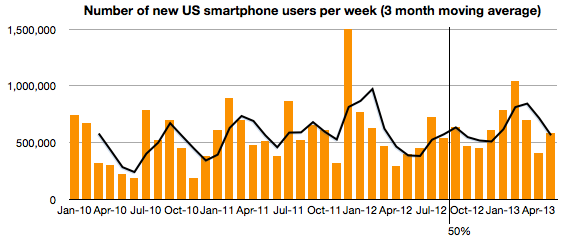
    The switching rate to smartphones is shown below:

    Screen Shot 2013-07-17 at 7-17-10.32.09 AM

    It shows the number of new-to-smartphone users who switched every week. It can be considered the "speed of adoption". The latest figure is 583k/week, above the 572k/week average maintained over the last 41 months.

    [I also added a three period moving average which shows a seasonal change in adoption. I also added a vertical line showing the point when 50% penetration was reached (August 2012).]

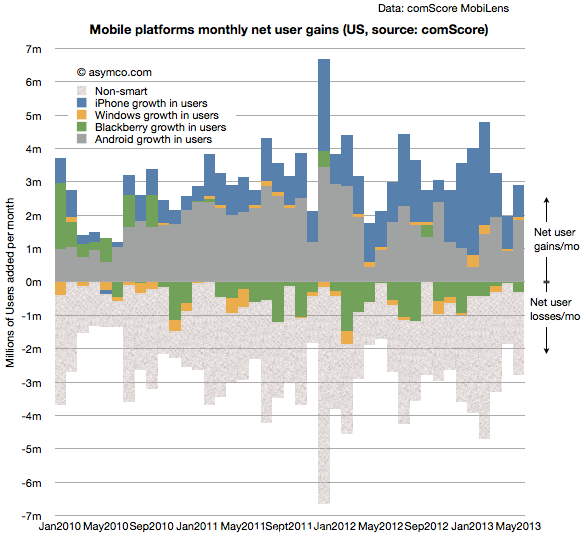
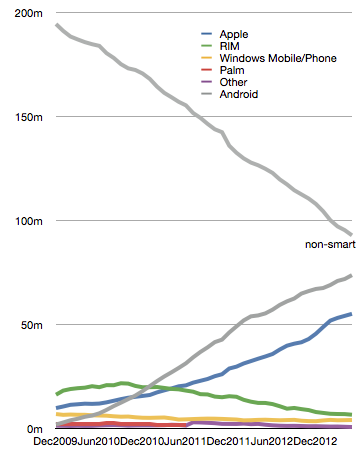
    The switching rate by platform is shown in the following graph:

    Screen Shot 2013-07-17 at 7-17-10.38.54 AM

    The data shows that churn between platforms (except for BlackBerry) is still negligible and that the majority of user losses can be attributed to non-smart devices.

    To summarize, with penetration now at about 60% in the US, the rate of adoption of smartphones is not slowing in any perceptible way.

    So not only is there no saturation, but there is no slowing of adoption of smartphones in the US, the most penetrated large market.

    Globally, the penetration of smartphones is less than half of that in the US. About 4 billion people are about to switch.

    Of course, they may not be willing to switch to what is currently offered to them in the market, but then again, the billion or so who adopted iOS and Android phones did not switch when the alternatives were BlackBerries, Palm, Symbian and Windows Mobile devices.

  6. What's a BlackBerry user worth?

    Research · 50 comments

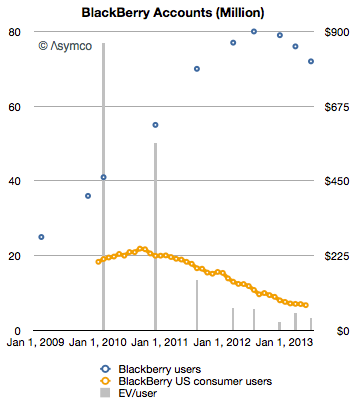
    Last week BlackBerry announced that it had 72 million subscriber accounts. The current market capitalization is $5.4 billion and enterprise value (i.e. excluding net cash) is about $2.8 billion.

    That implies a net present value of about $40 for each account. This is quite a drop from early 2010 when the value was $866.

    The graph of BlackBerry subscriber accounts and EV/account is shown below:

    Screen Shot 2013-07-01 at 7-1-10.09.16 AM

    I've also added a graph showing a derived value of US consumer BlackBerry users (derived from comScore's survey data).

    There are several patterns which intrigue me:

    First, the peak in US consumption seems to have happened about two years prior to global peak (lending credence to the notion that the US is a smartphone market "crucible".)

    Second, that the collapse in value per user occurred in advance to the peak in users. This is, of course, linked to other user base leading indicators such as device sales momentum. But the drop indicates that there was no perceived value in the BlackBerry install base to begin with. As devices went, so did the company.

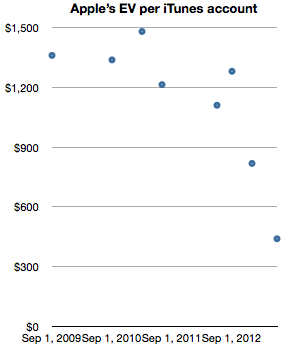
    Third, this same lack of perceived value seems to be present within the Apple ecosystem (see below), where user value was cut to a third within a few months

    . 

    Screen Shot 2013-06-14 at 6-14-1.13.26 PM

    In the case of RIM/BlackBerry, the drop in value per user accurately foretold the drop in user base. Does the drop in value per user for Apple foretell a reduction in users?

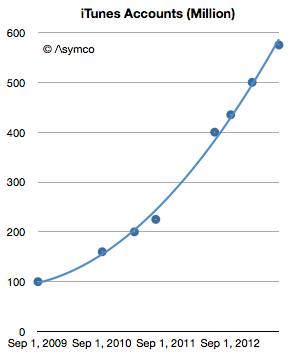
    So far, iOS user base (as proxied by iTunes accounts) continues to expand, even in the US.

    Screen Shot 2013-07-01 at 7-1-10.13.02 AM


  7. What's an Apple user worth?

    Research · 85 comments

    This week Apple announced that iTunes has 575 million accounts. This is the 8th update (that I know of) over the last four years. The history of this data is shown in the following graph.

    Screen Shot 2013-06-14 at 6-14-1.13.02 PM

    The number of accounts has increased by almost a factor of six since late 2009. It amounts to an account growth rate of about 500,000/day or 44% compounded annually. Not bad, but along with this increase what happened to revenues per user?

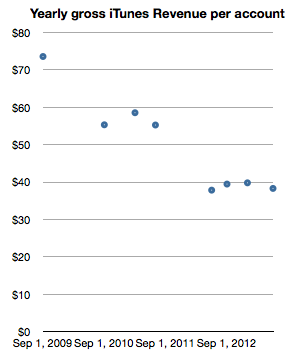
    Looking at iTunes revenue (gross) reveals a picture of revenues/account, shown below:

    Screen Shot 2013-06-14 at 6-14-1.13.11 PM

    This can be read as: "Each of the current 575 million accounts generates about half the revenue of the 100 million accounts of 2009." One would expect such a decline as an user base expands and this approximate 50% decline in revenues per account seems reasonable for a six-fold base increase. In absolute terms the graph shows that an iTunes account generates about $3.2/month in transactions.[1]  Put another way, during the last year, an average of $40/yr of economic value is generated by every iTunes account.

    Stretching further, one could also use the 575 million iTunes accounts as a proxy for "the Apple customer base". The assumption would be that iTunes accounts are attached to some Apple product, be it an iPhone, iPod or Mac. As a bounds check, a total of 865 million Apple devices (which interact with iTunes) have been sold since 2007. Assuming 575 million users does not seem to be a contradiction.

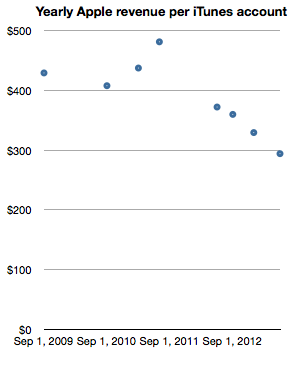
    The logic deployed would be that it's unlikely for a consumer to have an iTunes account without owning or using an Apple product. If we take this leap in logic then it would make sense to measure Apple (not just iTunes) revenues per iTunes account. In order to smooth out seasonality I took trailing twelve months' average quarterly revenues and measured the following company revenues per iTunes account.

    Screen Shot 2013-06-14 at 6-14-1.13.19 PM

    Note again the reduction in revenue per "customer" as the base grows. The reduction is less pronounced however, with about one third lower spending for a sextupling of the base. One can read this graph as "Three years ago an Apple customer used to spend $400/yr on Apple products but as the number of users increased six-fold the spending decreased to about $300/yr per customer."

    The practice of valuing a company by the rate of spending of its customer base is not uncommon, especially when the customer base is relatively loyal. Apple emphasized the importance of customer satisfaction (and, implicitly, loyalty) during its WWDC presentation. It was singled out as the most important metric they track. So perhaps valuing Apple itself on the basis of repeat purchase behavior should be considered.

    When framing the value of of the company itself as a function of users (in the form of iTunes accounts) we get the following graph.

    Screen Shot 2013-06-14 at 6-14-1.13.26 PM

    The graph measures the Enterprise Value (i.e. Market cap minus cash) on a per-customer (i.e. iTunes account) basis.

    It shows that for a number of years—from 2009 until late 2012—Apple's users were valued (implicitly by the stock market) as likely to create a net present value of about $1200 in earnings. The current value is about a third of that, or $440 in earnings. Today's expectation is therefore that each current customer will buy the equivalent of 1.8 iPhones. And nothing more, ever. A few months ago it was expected that each customer would buy three times as much.

    Although the rate of spending of each customer is decreasing, the number of new customers is increasing more rapidly. As this is happening the company's equity is being priced such that an Apple user is considered less than half as valuable as she used to be—from 3.2x revenues to 1.5x revenues. This change in user value has been quite abrupt, happening only within the last nine months. What could justify a drop in user value would be a drop in customer satisfaction or loyalty. So far, I have seen no evidence of this happening.

    --

    Notes:

    1. Note that these revenues include App Store, Music Store, TV Shows, Movies, iBookstore, Mac App store, and Services (including iCloud). Some of this revenue is not reported as part of Apple's statement of operations since some content is treated with an agency model.
  8. Forecasting Windows market share

    Research · 80 comments

    Last week Frank X. Shaw, VP of corporate communications at Microsoft stated:

     ... most of the people around me were using their iPads exactly as they would a laptop – physical keyboard attached, typing away, connected to a network of some kind, creating a document or tweet or blog or article. In that context, it’s hard to distinguish between a tablet and a notebook or laptop. The form factors are different, but let’s be clear, each is a PC.

    Actually this "admission" that iPads are PCs is not something new. Steve Ballmer made the same assertion in 2010 pre-iPad (though calling them slates). Arguably, the notion that tablets are PCs has been dogma at Microsoft for over a decade and Windows running on all form factors has been a strategic guiding principle.

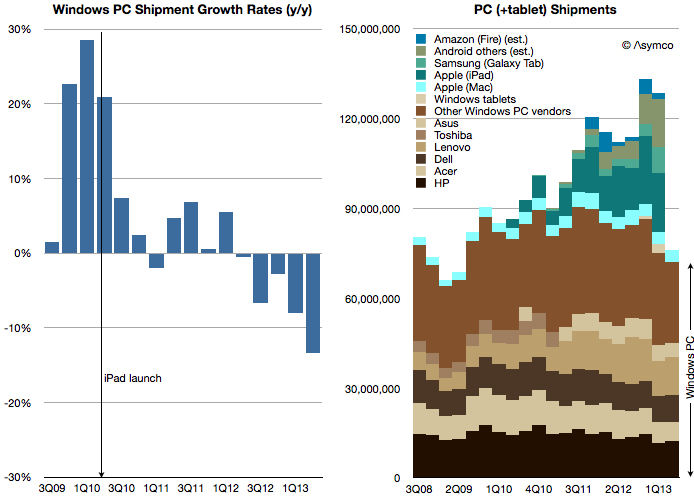
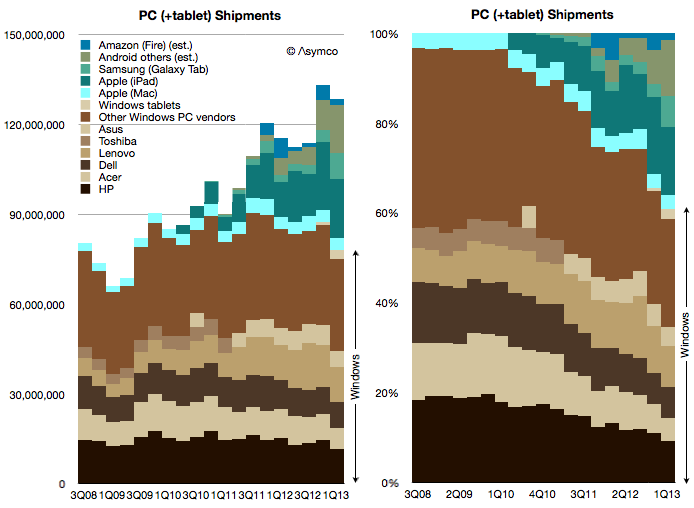
    Which is why I've always added the tablet data to the PC data to create a picture of the "personal computing" market. And this is what that picture looks like today:

    Screen Shot 2013-06-03 at 6-3-5.31.21 PM

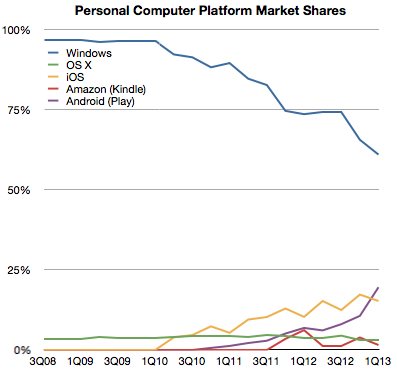
    Note how the share of various platforms has evolved over this brief time span:

    Screen Shot 2013-06-03 at 6-3-5.32.43 PM

    Seen this way, Windows has now reached 60% market share and it's likely to dip below 50% during this year. What happens beyond then is harder to imagine. If Windows tablets start growing as fast as the tablet market overall then Windows could stabilize in share. But if Android and iOS tablets follow their phone brethren in growth then it will be far harder for Microsoft to maintain share. But is that cause for concern?

    Not necessarily.

    The total computing market[1] is likely to expand to over 4 billion users with 1.5 devices per user in the next five years. That expansion implies that 20% share equals more than one billion devices, making such an ecosystem "good enough" for the average developer. It certainly has been good enough for Windows developers to date and they have kept hiring it throughout the new mobile app revolution.

    So even if Windows dips to only 20% of the world's computing market it will still be perfectly "viable" for some time to come.

    --

    1. I define the computing market as the total number of devices which have (a) a CPU (b) a broadband connection (c) a native application execution environment which is open to third party apps. This definition implies the presence of an "ecosystem" which is bound specifically to a platform.
  9. In the weeds

    Research · 55 comments

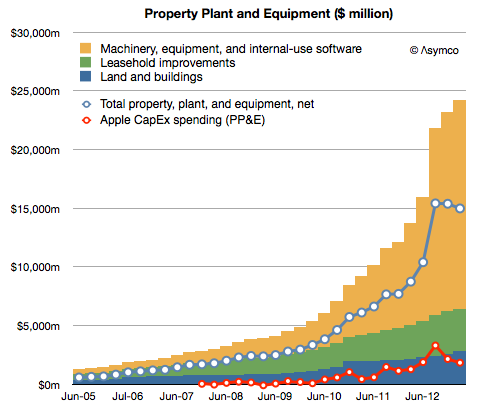
    Although discussions related to how Apple will "use its cash" center on acquisitions of companies, Apple's has been busy acquiring, just not companies. It has been buying capital equipment. Capital meaning (in the original sense of the word[1]) the means of production.

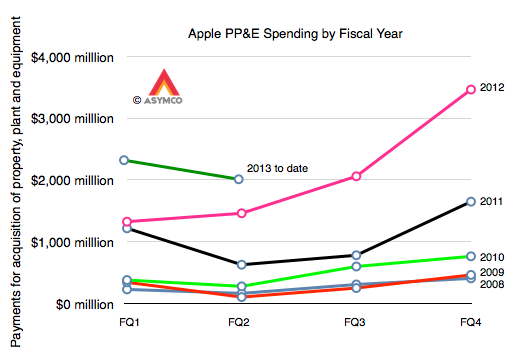
    Since the launch of the iPhone Apple has spent $21.1 billion on the acquisition of property, plant and equipment. The company has already stated that they will spend another $10 billion or so for the current fiscal year. This has been mostly machinery and equipment used in manufacturing.

    The result in asset value is shown below:

    Screen Shot 2013-05-30 at 5-30-6.29.53 PM

    [The Net value, shown as a blue line, is after accumulated depreciation. The red line represents spending as reported on the cash flow statement.)

    The change in spending year/year (fiscal) is shown in the following graph:

    Screen Shot 2013-05-30 at 5-30-6.31.27 PM

    So these are very large numbers, even compared to other capital-intensive semiconductor manufacturers:

    Screen Shot 2013-05-30 at 5-30-6.48.22 PM

    Given this enormous spending one could imagine it's the subject of intense scrutiny. However the only question on the subject that I've ever seen was from Steve Milunovich of UBS to which Peter Oppenheimer, CFO offered an explanation:

    Steve Milunovich - UBS
    …second question would be on CapEx, you spent almost as much Intel does. I think you guys have said you’re not going to become vertically integrated per se but in a sense you are since [you buy] equipment for your partners, could you talk about the strategy here and how much of a differentiator this gives Apple in terms of your ability to ramp new products over time? And maybe a little bit more about how deep you will go in terms of semiconductor components for you, etc.?

    Peter Oppenheimer - Chief Financial Officer
    Sure. Steve it’s Peter. We expect to spend about $10 billion in CapEx this fiscal year that will be up little under $2 billion year-over-year. We expect to spend a little bit under $1 billion in the retail stores. And the other $9 billion is spent in a variety of areas. We are buying equipment that we will own that we will put in partners’ facilities. Our primary motivation there is for supply, but we get other benefits as well. We are also adding to our datacenter capabilities to support all the services that Tim spoke about in answering Ben’s question and in facilities and in infrastructure. So, that’s where the capital is going.

    I would say that this is not a very satisfying answer, which is why I thought it merits further questioning[2].

    Alas, no.

    Whereas there is a constant clamoring for Apple's to use its cash to "acquire" or "buy" something, anything, maybe people not looking hard enough. If you need the satisfaction that comes from knowing that money is being spent, a glance at the Cash Flow statement and Balance Sheet shows that Apple buys the equivalent of one Yahoo! every three years[3].

    The main difference with this type of acquisition is that there is less value destruction. Using the capital to ensure access to capacity, differentiation and hence a high margin is better than writing off the goodwill after a few years.

    --

    1. The term capitalism, in its modern sense, comes from the writings of Karl Marx
    2. I am prepared to be alone in this quest as it seems to merit no mention from others
    3. or 10 Tumblrs every year
  10. Tim Cook's answer to my first question

    Research · 114 comments

    Tim Cook was asked the first question (on the iPhone portfolio). His answer is paraphrased here:

    We haven't so far. That doesn't shut off the future. Why? It takes a lot of really hard work to do a phone right when you manage the hardware and software and services in it. We've chosen to put our energy on doing that right. We haven't been focused on working multiple lines.

    Think about the evolution of the iPod over time. The shuffle didn't have the same functionality as other products. It was a really good product, but it played a different role — it was great for some customers it was strikingly different than other iPods. The mini played a different role than the classic did. If you remember when we brought out the mini people said we'd never sell any. It was too expensive and had too little storage. The mini proved that people want something lighter, thinner, smaller. My only point is that these products all served a different person, a different type, a different need. For the phone that is the question. Are we now at a point that we need to do that?

    …

    At a macro level, a large screen today comes with a lot of tradeoffs. When you look at the size, but they also look at things like do the photos show the proper color? The white balance, the reflectivity, battery life. The longevity of the display. There are a bunch of things that are very important. What our customers want is for us to weigh those and come out with a decision. At this point we think the Retina display is the best. In a hypothetical world where those tradeoffs didn't exist, you could see a bigger screen as a differentiator.

    Full interview here, answer begins around minute 37.

    Here is how I interpret the answer:

    • The iPhone portfolio may still arrive. It hasn't so far because the cost/benefit is not there for Apple. On one hand it would take a great deal more sourcing effort and risk while dealing with constraints in production. On the other it would not not offer meaningful additions to the customer base. At least so far. The economics and the demand may change (or have changed) and the time will come for a broader portfolio.
    • The comparison to iPod is not entirely appropriate because as a music player, the iPod had a relatively small set of jobs to do. It was hired for exercise, escapism, isolation, etc. It was not hired for apps and services which extend the medium itself. In other words it was not a computer. As a computer, the iPhone has a near infinite set of jobs to be done and it's the hundreds of thousands of apps which help it perform them. But as a result the iPhone needs to conform to the dynamics of ecosystems and that means consistency of APIs and user experience. It cannot vary in terms of input methods, or be below minimum requirements of screen size or memory and power.
    • Because of the rapidly expanding job space, Apple believes the iPhone was not "good enough" for all these years. The improvements shipped for each generation were all "meaningful" in that they were valuable and absorbable. Users would use the new features (like better screens, cameras, battery, etc.) and they were willing to pay for them (as evidenced by the sustained high average price).
    • On the question of what the extension might be, changing screen size is one dimension but it has to be balanced by performance gains that don't detract from other dimensions. Engineering is all about compromise and consumers pay Apple to make these compromises in an intelligent way. Apple does not come to an answer to the question of balance by launching many products and seeing what works. It cannot afford to dilute its brand with a long list of failures. Other brands may not be affected by trial-and-error approaches to the market but they are discounted by the customer accordingly.


  11. Apple retail revenues per visitor reach new record

    Research · 42 comments

    In the US, on a sales per square foot basis, Apple retail continues to perform twice as well as Tiffany & Co., the second best retailer, and three times as well as lululemon athletica, the third best retailer.

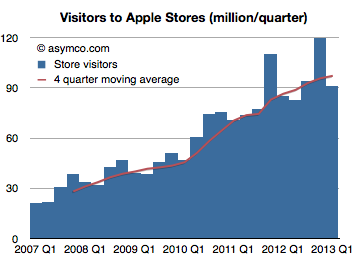
    The latest quarter showed a 7% growth in visitors and a new record revenue of $57.6 per visitor.

    Screen Shot 2013-05-20 at 5-20-12.14.23 PM

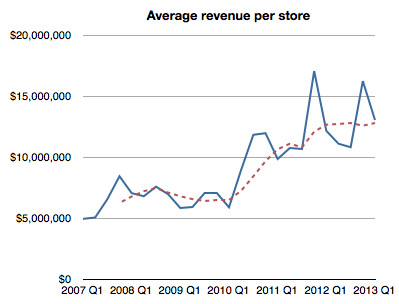
    As a result, the average revenue per Apple store per quarter reached $13 million, the highest level for a non-holiday quarter.

    Screen Shot 2013-05-20 at 5-20-12.16.39 PM

    Here are some additional metrics:

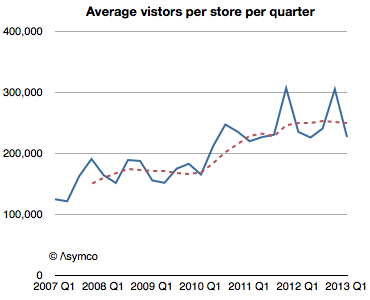
    Average visitors per store has steadied to 250,000 per store per quarter (average for trailing 12 months). This is a quantum increase from about 170,000 per store per quarter in the twelve months ending Q1 2010. The reason for this might be the increase in floor space of newer stores and the renovation of older stores. The new store throughput rate might be an upper bound due to fire regulations.

    Screen Shot 2013-05-20 at 5-20-12.17.38 PM

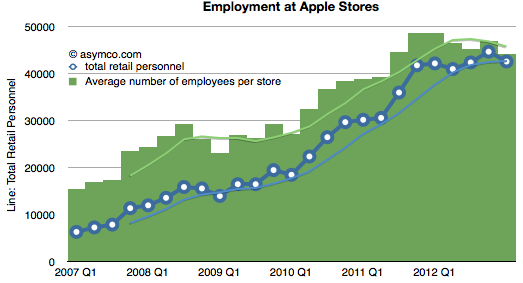
    Employment has steadied at about 110 per store. This is a remarkable increase from less than half this level in 2007.

    Screen Shot 2013-05-20 at 5-20-12.20.12 PM

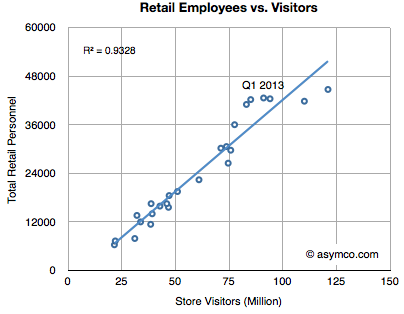
    Hiring remains closely correlated with visits with visitors per employee per quarter holding to slightly more than 2000.

    Screen Shot 2013-05-20 at 5-20-12.21.17 PM

    Profit per visitor also holding steady at about $12/quarter.

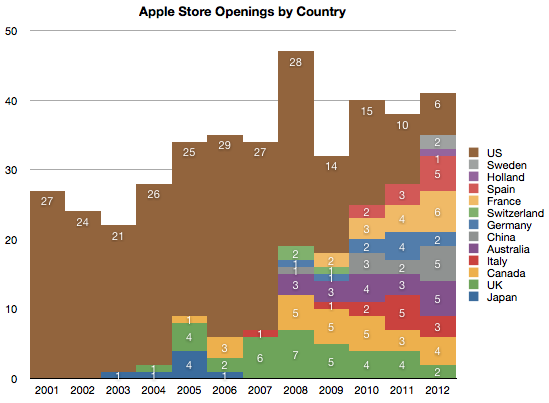
    Retail performance remains constrained by store size (hence maximum number of visitors) and the number of stores. The strategy seems to be expanding US stores while opening new stores outside the US.

    Screen Shot 2013-05-20 at 5-20-12.25.41 PM

    That would allow growth in visitors and hence in achieving the primary purpose of the stores: maintaining the brand's relationship with customers.