Asymco

Asymmetric Intelligence

Industry

  1. The allure of iTunes

    Research · 130 comments

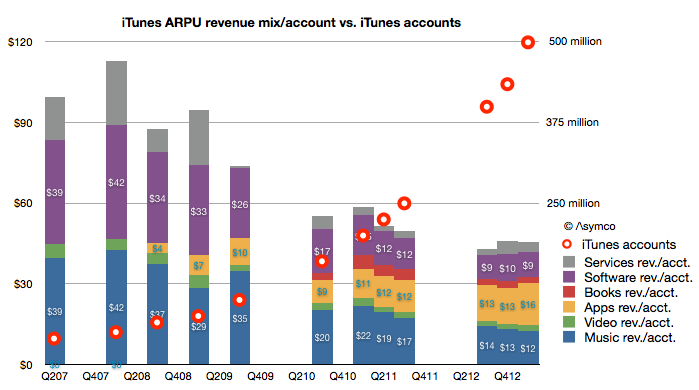
    My estimate of last quarter's iTunes gross revenues suggested a spending rate of $40 per iTunes account. It would make sense to consider how that figure changed over time. The following graph shows the pattern:

    Screen Shot 2013-05-14 at 5-14-9.49.40 AM

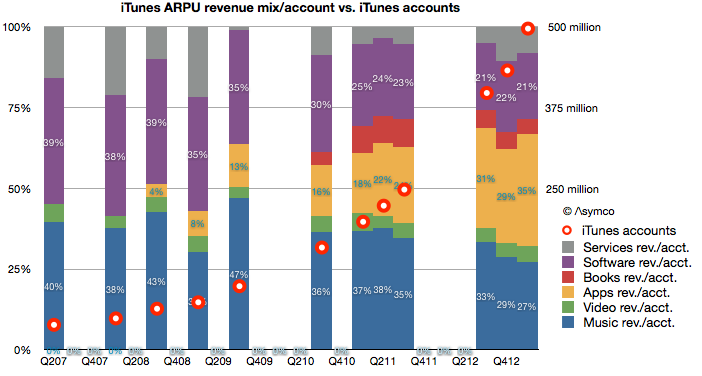
    You can read each bar in the graph as the total "ARPU" or average revenue per iTunes user[1].

    I overlaid a graph showing the total number of accounts as reported by Apple to the (retroactively) estimated revenue structure. Account totals are measured with the right axis and ARPU with the left.  Note that I also broke down each component of iTunes as currently defined (Music, Video, Apps, Books, Software and Services.)[2]

    The time frame covered is from Q2 2007, or the quarter prior to the iPhone launch. A few patterns emerge:

    • When there were no iOS devices (and hence no iOS apps) the revenues of iTunes consisted mostly of music sales. Those revenues were, on a per account basis, roughly comparable with Apple's Software revenues.
    • As iOS devices proliferated, the number of accounts (and users) grew. They doubled in the first two years (2007 to 2009) and doubled again in the following year (2010) and doubled again the following year (2011) and doubled again in the following 18 months. This rate of growth was accompanied by a reduction in the iTunes ARPU of about 50% (from $99 to about $45).
    • The reduction in ARPU has moderated in the last few quarters. ARPU fell 10% from $50 to $45 during the last doubling of accounts (from 225 million iTunes accounts to  500 million accounts.) In contrast ARPU fell 20% from $74 to $58 during the penultimate doubling (from 100 million to 200 million)
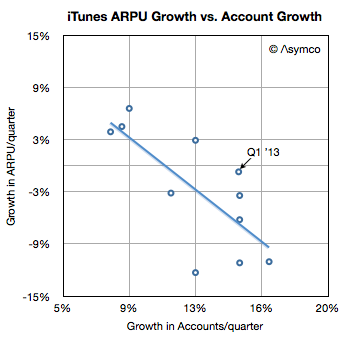
    • However, growth in accounts is broadly inversely proportional to growth in ARPU. In other words, the faster the growth in users the faster the decline in ARPU. The recent moderation in ARPU erosion is also coupled to a moderation in user growth (most recent doubling took 18 months vs. 12 months for previous doubling.) This is as would be expected as a broader, later user base tends to consume less than a narrow, early base. This can be seen in the following scatter plot:
    Screen Shot 2013-05-14 at 5-14-10.35.02 AM
    • When seen as a percent of mix, Apps have grown to be the largest component of iTunes spending. Apps have 35% "share of wallet" while music has dropped steadily from 40% to 27% (or $39 to $12/yr.) This is shown in the following graph.
    Screen Shot 2013-05-14 at 5-14-10.34.45 AM

    As apps have grown to consume more and more of users' time it stands to reason that they should consume more and more of users' wallets.

    And as accounts reach one billion, we can begin to think about the disruptive impact on other media types. Whereas video, books and music are targeted to smaller user bases, apps are broadly consumed. Developers like Rovio or Supercell can offer their products to billions while TV producers can only hope for millions. Apps are becoming the universal medium for entertainment and iTunes the universal distributor.

    Talent is catching on to this faster than those who manage and distribute their work. The inevitable result will be a mass migration of talent away from the established content industries. Old media won't fade due to a loss of users. It will fade due to a loss of talent.

    --

    Notes:

    1. An account is not necessarily a user so perhaps more appropriately the acronym should be ARPA (average revenue per account). Unfortunately that acronym is taken.
    2. The complete model is available for purchase through Asymco Store.
  2. iTunes users spending at the rate of $40/yr.

    Research · 75 comments

    In the latest quarter the iTunes top line grew by 32%. Additional newly reported items:

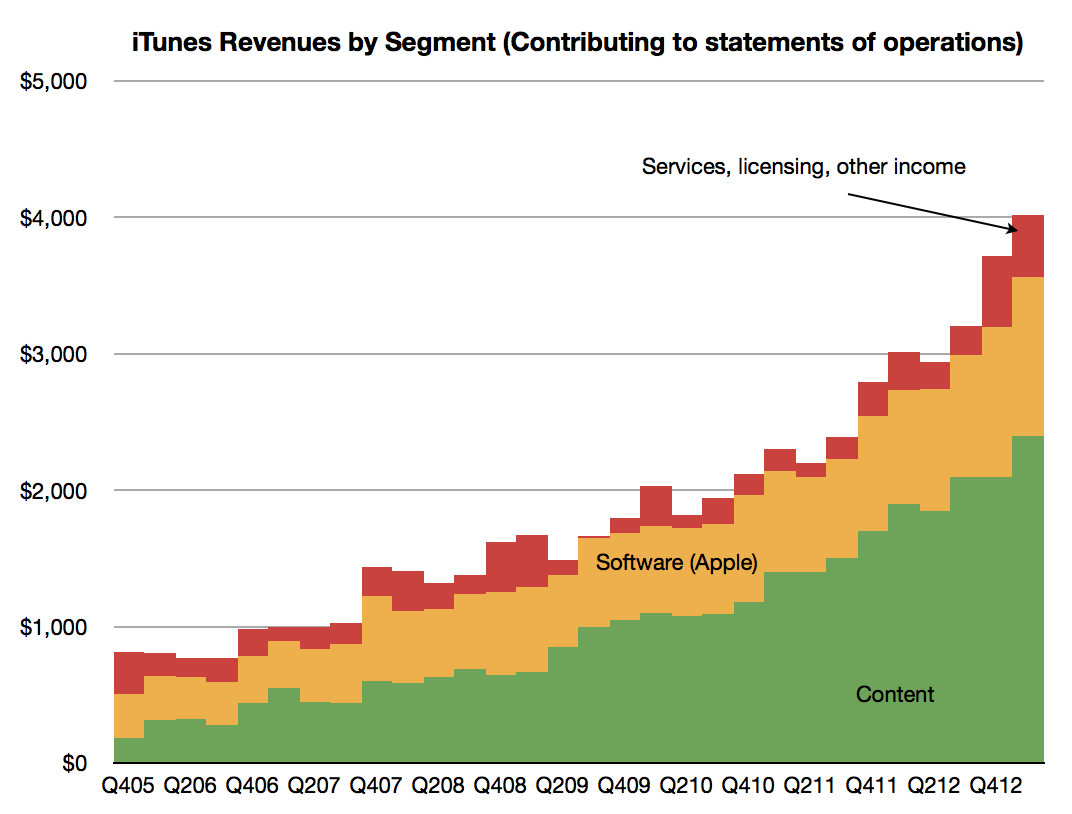
    • Quarterly revenues topped $4 billion (a new high) and the company suggests that this rate is maintainable by stating it has a “$16 billion annual run rate”. The pattern of revenues is shown below.
    Screen Shot 2013-05-12 at 5-12-8.12.30 AM
    • The content portion of iTunes revenues was $2.4 billion, up from $2.1 billion sequentially. Growth into Q1 is not unusual as many holiday iTunes gift cards are redeemed during January.
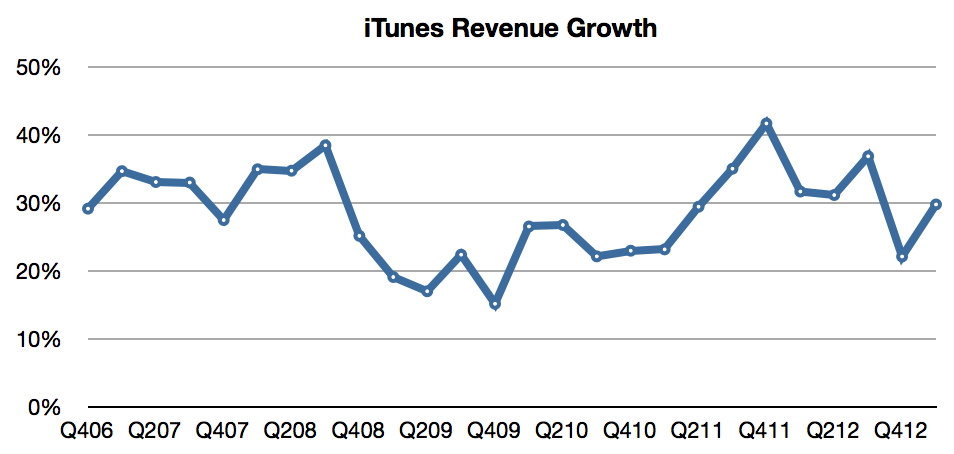
    • Revenue growth has been surprisingly steady, averaging 29%/quarter for more than six years.
    Screen Shot 2013-05-12 at 5-12-8.20.06 AM
    • Music is now available in 119 countries.
    • The Music catalog now consists of 35 million songs.
    • Movies are available in 109 countries. 60,000 titles are offered.
    • iBookstores are present in 155 countries offering 1.75 million iBooks.
    • There are iTunes App Stores in 155 countries whose residents make up about 90% of the world’s population.
    • iOS developers have created more than 850,000 iOS apps, including 350,000 made for the iPad.
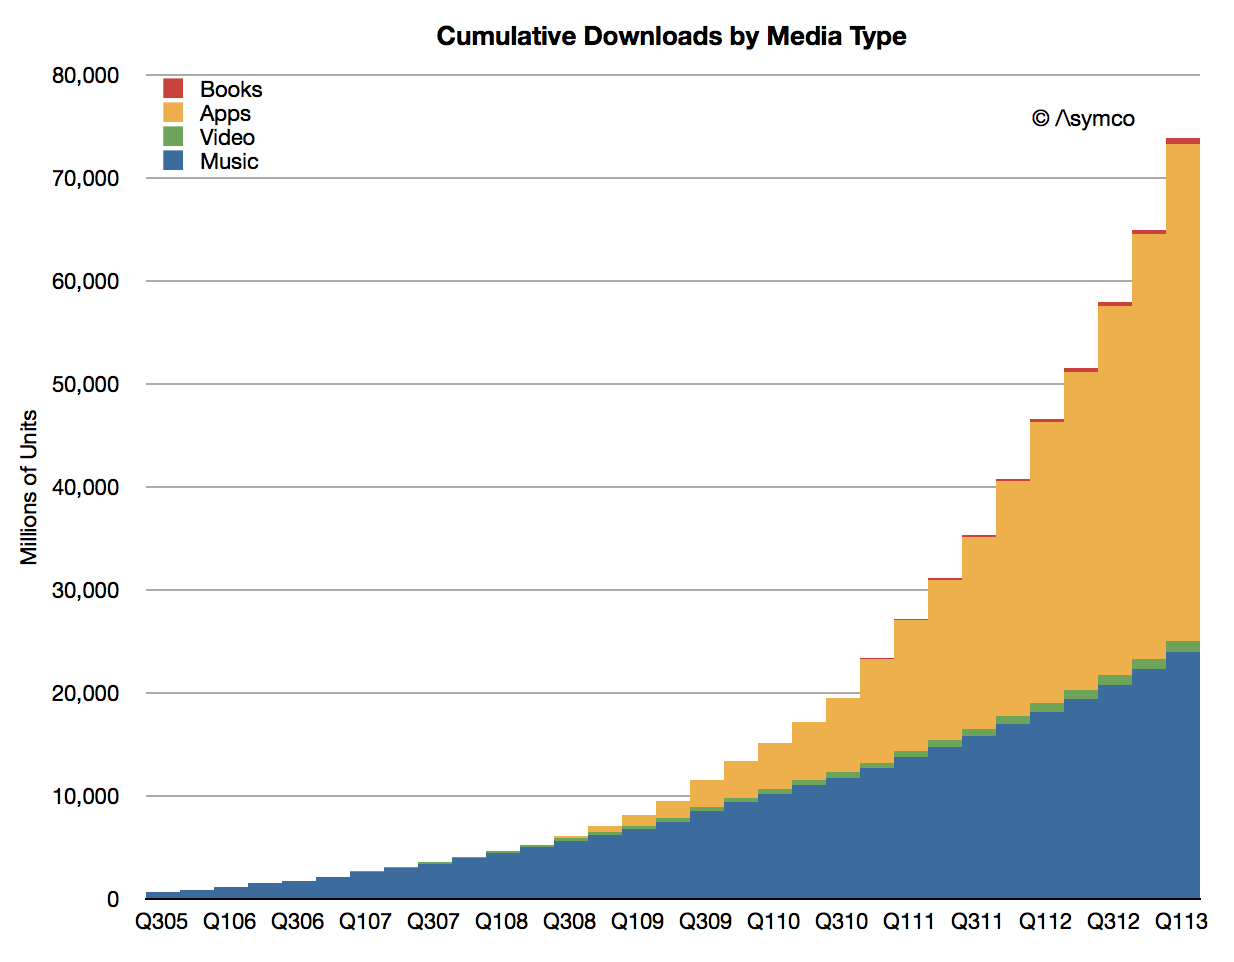
    • Cumulative app downloads have surpassed 45 billion and are on track to reach 50 billion at time of writing (estimated to be reached mid May).
    Screen Shot 2013-05-12 at 5-12-8.21.31 AM
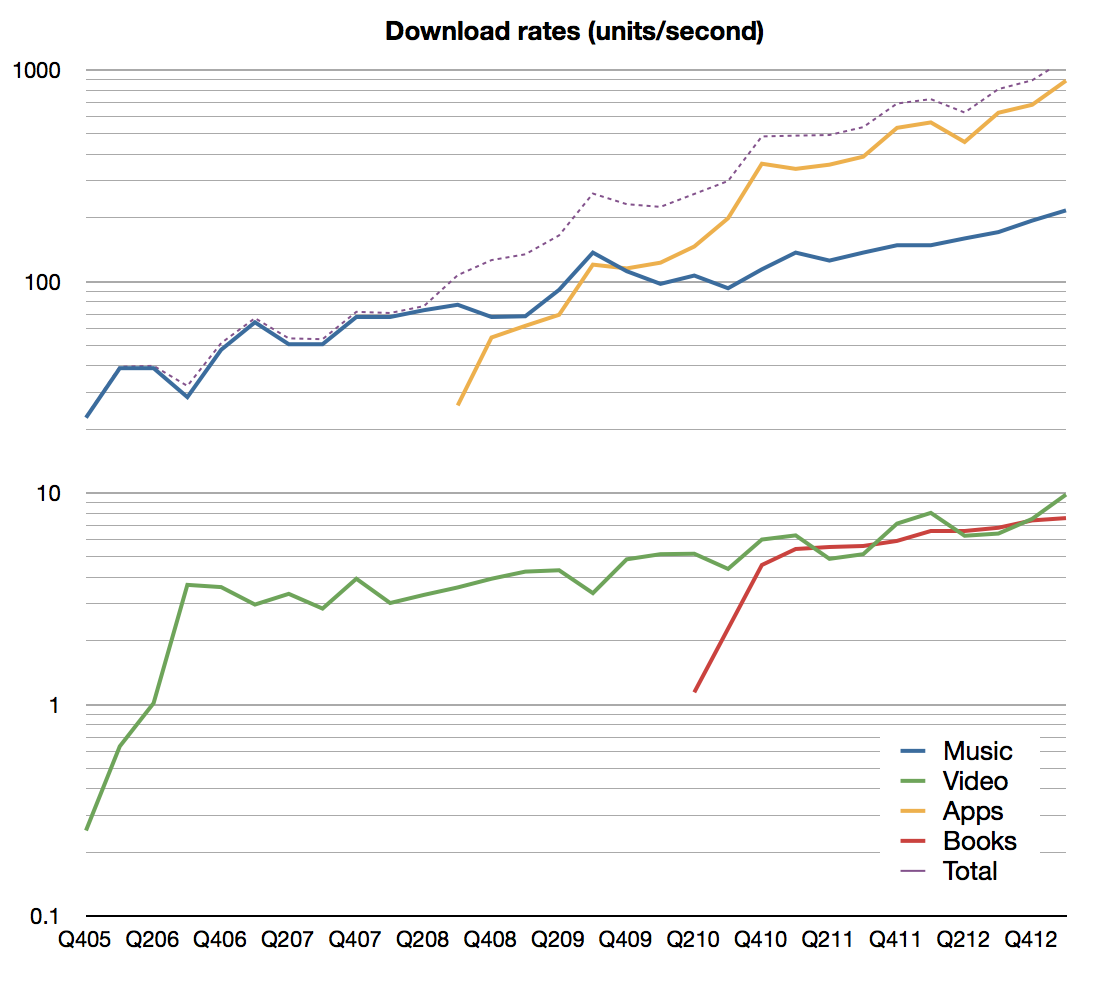
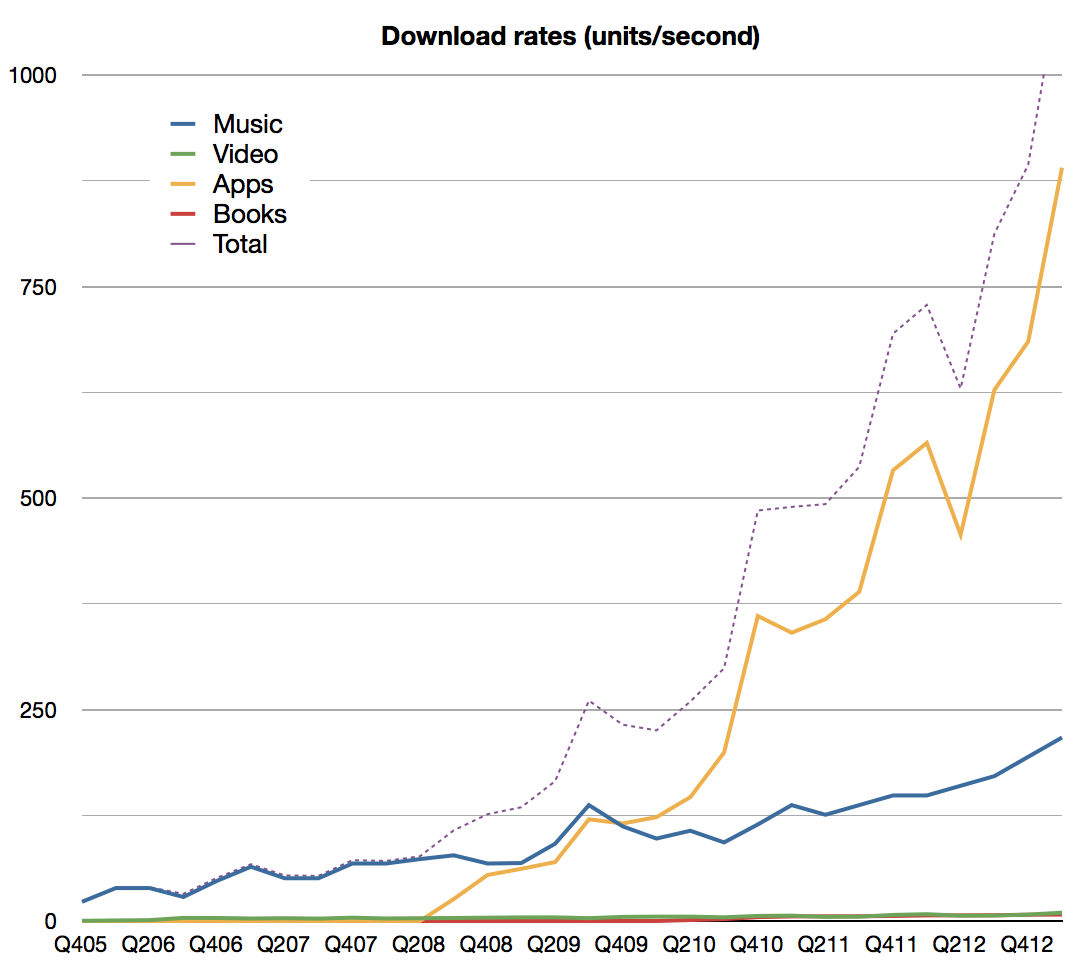
    • The company reports that over 800 apps are downloaded per second. Including all media, the download rate is now above 1000 items per second. Estimated download rates by media types are shown below (note: first graph is plotted on a log scale):
    Screen Shot 2013-05-12 at 5-12-8.34.37 AM


    Screen Shot 2013-05-12 at 5-12-9.07.49 AM


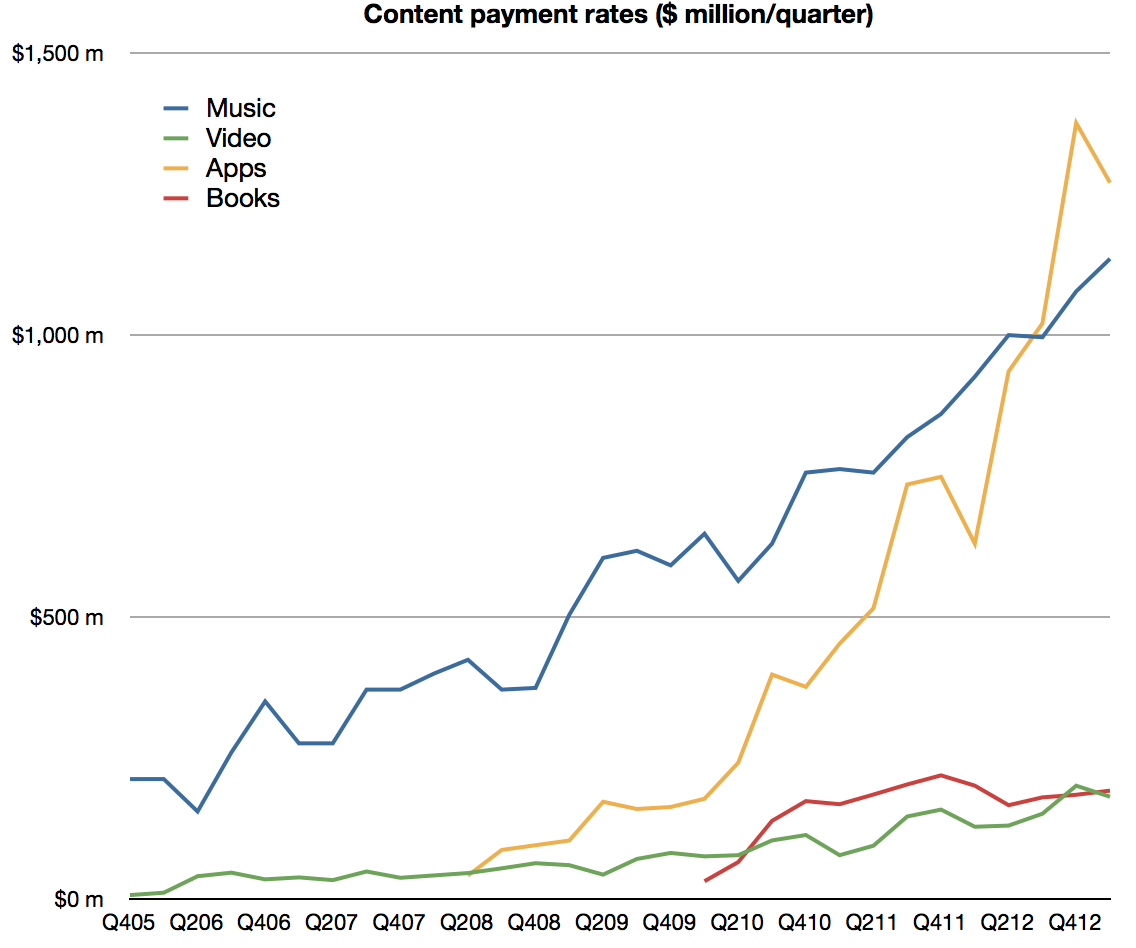
    • App developers have been paid over $9 billion for their sales through the App Store including $4.5 billion in the most recent four quarters. I estimate the split between media types as follows:
    Screen Shot 2013-05-12 at 5-12-9.13.48 AM
    • Canalys estimates that sales from iTunes App Store accounted for 74% of all app sales worldwide in the March quarter.
    • iOS app revenues more than doubled year-over-year.

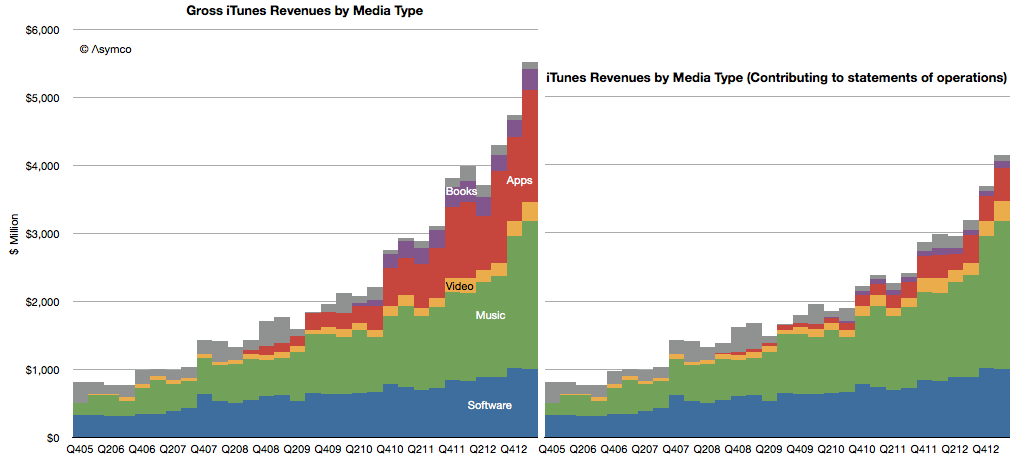
    Including all (gross[1]) content revenues, the sales rate is now nearly $5 billion per quarter ($4.94 billion). Including services, the iTunes consolidated business cleared over $5.5 billion.

    Screen Shot 2013-05-12 at 5-12-9.18.30 AM

    In March Apple reported that they have 500 million iTunes so one way to think about the iTunes business is to say that  iTunes users purchase content and services at the rate of about $40 per year.[2]

    Bless them.

    ---

    Notes:

    1. "For third-party applications sold through the App Store and Mac App Store and certain digital content sold through the iTunes Store, the Company does not determine the selling price of the products and is not the primary obligor to the customer. Therefore, the Company accounts for such sales on a net basis by recognizing in net sales only the commission it retains from each sale. The portion of the gross amount billed to customers that is remitted by the Company to third-party app developers and certain digital content owners is not reflected in the Company’s Consolidated Statements of Operations." From Apple SEC filing 10-K, October 2012.
    2. Apple users spend about $1/day for each Apple device in use making the iTunes franchise an incremental 11% marginal revenue source (assuming one device/user.)
  3. Measuring Platform Churn

    Research · 33 comments

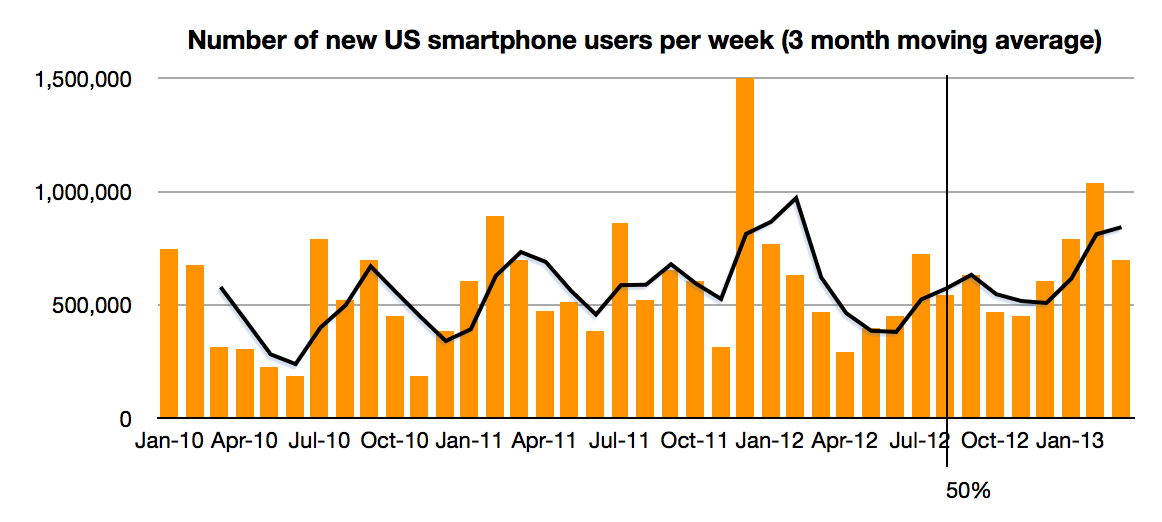
    The latest comScore data shows consistent growth in US smartphone penetration. The rate is now 58.4% of adult consumers who own phones. This is up from 20% only three years ago. The rate of growth remains a remarkable 1.2% per month. That's 700,000 new-to-smartphone users every week. The historic average over 3 years has been 1.07%/month This after having crossed over 50% on schedule in August 2012. There appears to be no slowing.

    Screen Shot 2013-05-06 at 5-6-5.42.50 AM

    The next milestone I have pencilled in is the 80% mark which I extrapolate to be achieved by October 2014. 80% could be considered "saturation" which would signify a rapid slowing of new user addition. However, that might still not happen until 100%, depending on the availability (or lack thereof) of non-smartphones to buy.

    This time frame is important because it would imply that essentially all mobile users in the US (some 234 million) would be a part of one ecosystem in about 2 more years. That's less than the life cycle of the typical mobile contract (and thus the life of one phone). Put another way, by the time a new buyer today is ready to buy the replacement to their phone the market will be saturated.

    This implies the mode of competition will be changing to smartphone replacement rather than smartphone adoption. To some degree this is already happening but as the net user gains data shows only BlackBerry and Windows platforms have had any net user declines in the last two years. "Platform churn" is still a relatively rare phenomenon.

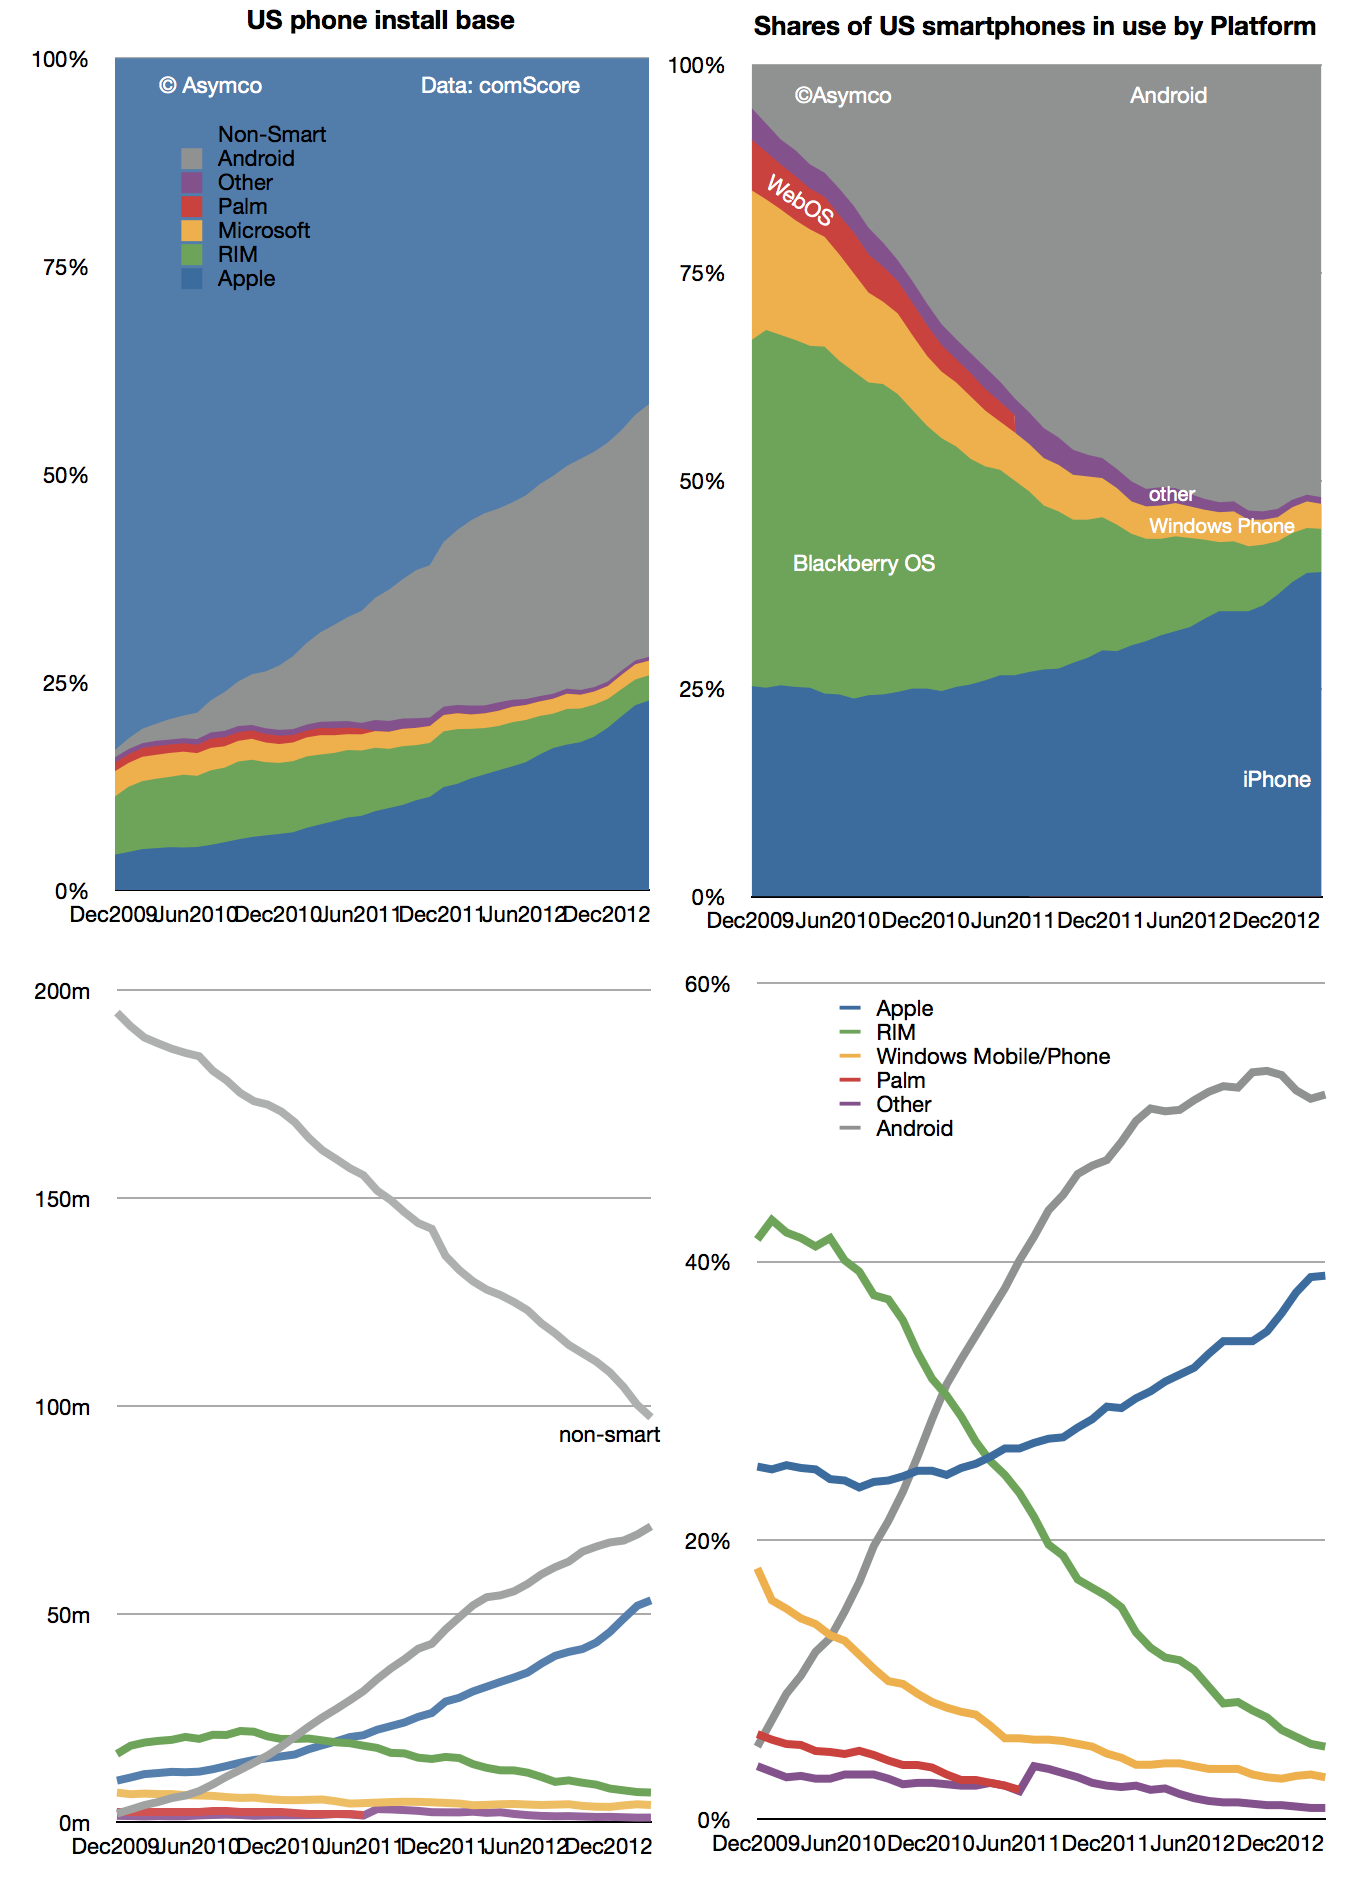
    How that will change post-saturation will be a crucial determinant to platform growth. The data today points to a higher degree of loyalty for iOS users and potential erosion in the Android user base as a result. There are ways of forecasting this on the basis of survey data as Carl Howe did. However, the data from comScore has already begun to show that Android may have peaked around 54% share. Android share is now at the same level it was in July while iPhone share has grown by more than 6 points since then.

    Screen Shot 2013-05-06 at 5-6-5.40.28 AM

    There is a pattern of higher growth into the end of the year and an iPhone plateau into the first quarter, undoubtedly due to holiday buying favoring the iPhone. I don't want to discount the possibility of some change in this pattern but so far there seems to be a plausible reason for it: with iPhone pricing and availability in the US offering no advantages to alternatives, Apple's product is the most popular. Nearly more popular even than all the other competitors combined.

  4. Surface Tension: The effect of Surface on Windows revenues

    Research · 34 comments

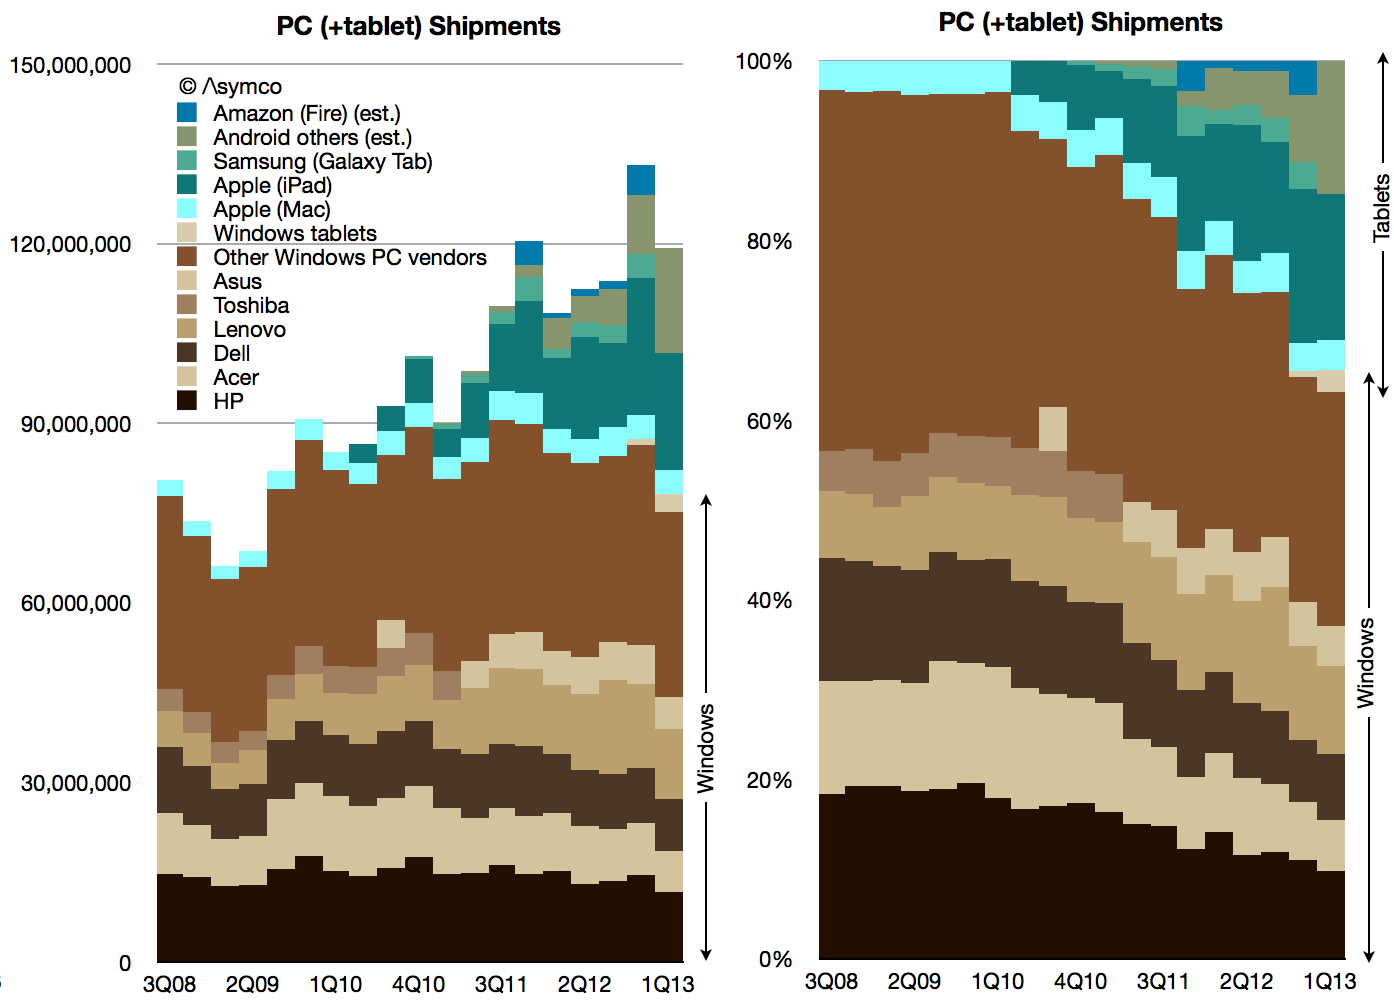
    According to Strategy Analytics 3 million Windows-based tablets shipped in Q1. That is not inconsequential. It would add 4% to the total Windows-based computers and reduce the decline in Windows PC growth to -8% (from -11%). You can see the effect of those units on share in the following graphs.

    Screen Shot 2013-05-02 at 5-2-2.06.21 AM

    Note the "boundary layer" of pale blue Macs between the brown-hued Windows and the green-hued tablets.

    Including tablets of all kinds, here is the market share growth in Windows PCs.

    Screen Shot 2013-05-02 at 5-2-2.06.30 AM

    As the post-PC disruption evolves, Microsoft has made an effort to shift its business model. I discussed this some time ago and there remain quite a few questions about the sustainability of the strategy.

    However, there might already be evidence that it's working. The clue is in the growth in Windows revenues at a time when PC shipments (at least traditional ones) are declining rapidly. Some of that might be due to deferrals and software assurance revenues which are insensitive to shipments. However some have to be due to the Surface.

    Remember that Surface launched with an RT version priced starting at $499 (which did not sell well) but received a boost in Q1 with the Pro version priced at $899 to $999. If we assume a 80:20 mix of Pro to RT and an average price of $950 for the Pro and $550 for RT, 3 million units would generate at least $2.5 billion in gross revenues. Accounting for retail margins of 20%, Microsoft could still be recognizing $2 billion in revenues. That's a significant portion of $5.7 billion in Windows revenue.

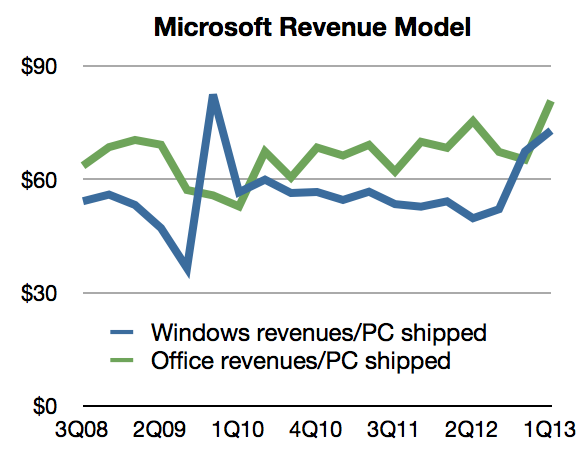
    We can back into this figure from another direction: Prior to Surface launch, the Windows revenue per PC shipped (combining Microsoft's revenues and Gartner's estimates) was about $50. After the Surface Pro shipped the revenue climbed to $73/PC.

    Screen Shot 2013-05-02 at 5-2-2.06.38 AM

    Assuming the same pre-Surface revenue/PC and given the shipment figures for Q1 we would get about $3.7 billion for Windows. The difference to actual revenues is about $2 billion.

    So the extrapolation of Windows royalties approach yields $2 billion in Surface sales and the Price x Units estimate also yields $ 2billion. It would suggest that Surface has had a significant impact already: More than a third of Windows revenues depend on it.

    [UPDATE: I've been informed that not all the Windows tablet sales reported by Strategy Analytics are Surface products. As many as 1 million might not be. That would reduce the revenues as calculated to about $1.4 billion. In addition, not all Windows revenues are current with much of that deferred. Actual revenues were $4.6 billion. With both of these adjustments considered, the impact of Surface might be only 30%.)

  5. Happy Birthday iTunes Store

    Research · 16 comments

    iTunes (including software and services) revenues in Q1 topped $4 billion and were 30% higher than (re-stated) 2012 Q1 revenues. Accompanying this revenue figure were additional data points from the company:

    • Cumulative app downloads have surpassed 45 billion
    • Payments to developers reached a cumulative total of $9 billion
    • Payments to developers were $4.5 billion in most recent four quarters
    • Now paying $1 billion to developers every quarter
    • 800 apps are downloaded every second
    • iOS app revenues doubled since year-ago quarter
    • App Store accounted for 74% of all app sales in the quarter (citing Canalys)
    • App stores reach customers in 155 countries (850k Apps, 350k iPad apps)
    • iTunes music downloads are available in 119 countries (35 million songs)
    • Movies are sold in 109 countries (60k titles)
    • iBookstore is available in 155 countries (1.75 million titles)

    This data allows for a few inferences:

    • Nearly 70 million apps are downloaded every day
    • The average revenue per game is about 23 cents
    • Gross app revenues are about $16 million per day (of which 11 million is paid to developers.)
    • Gross iTunes revenues were $5.4 billion last quarter of which I estimate:
    •  …App revenues were $1.6 billion
    •  …Music revenues were $2.2 billion
    •  …Video revenues were $287 million
    •  …Book revenues were $312 million
    •  …Apple's software generated $1 billion
    • In addition, I estimate that Services generated $100 million

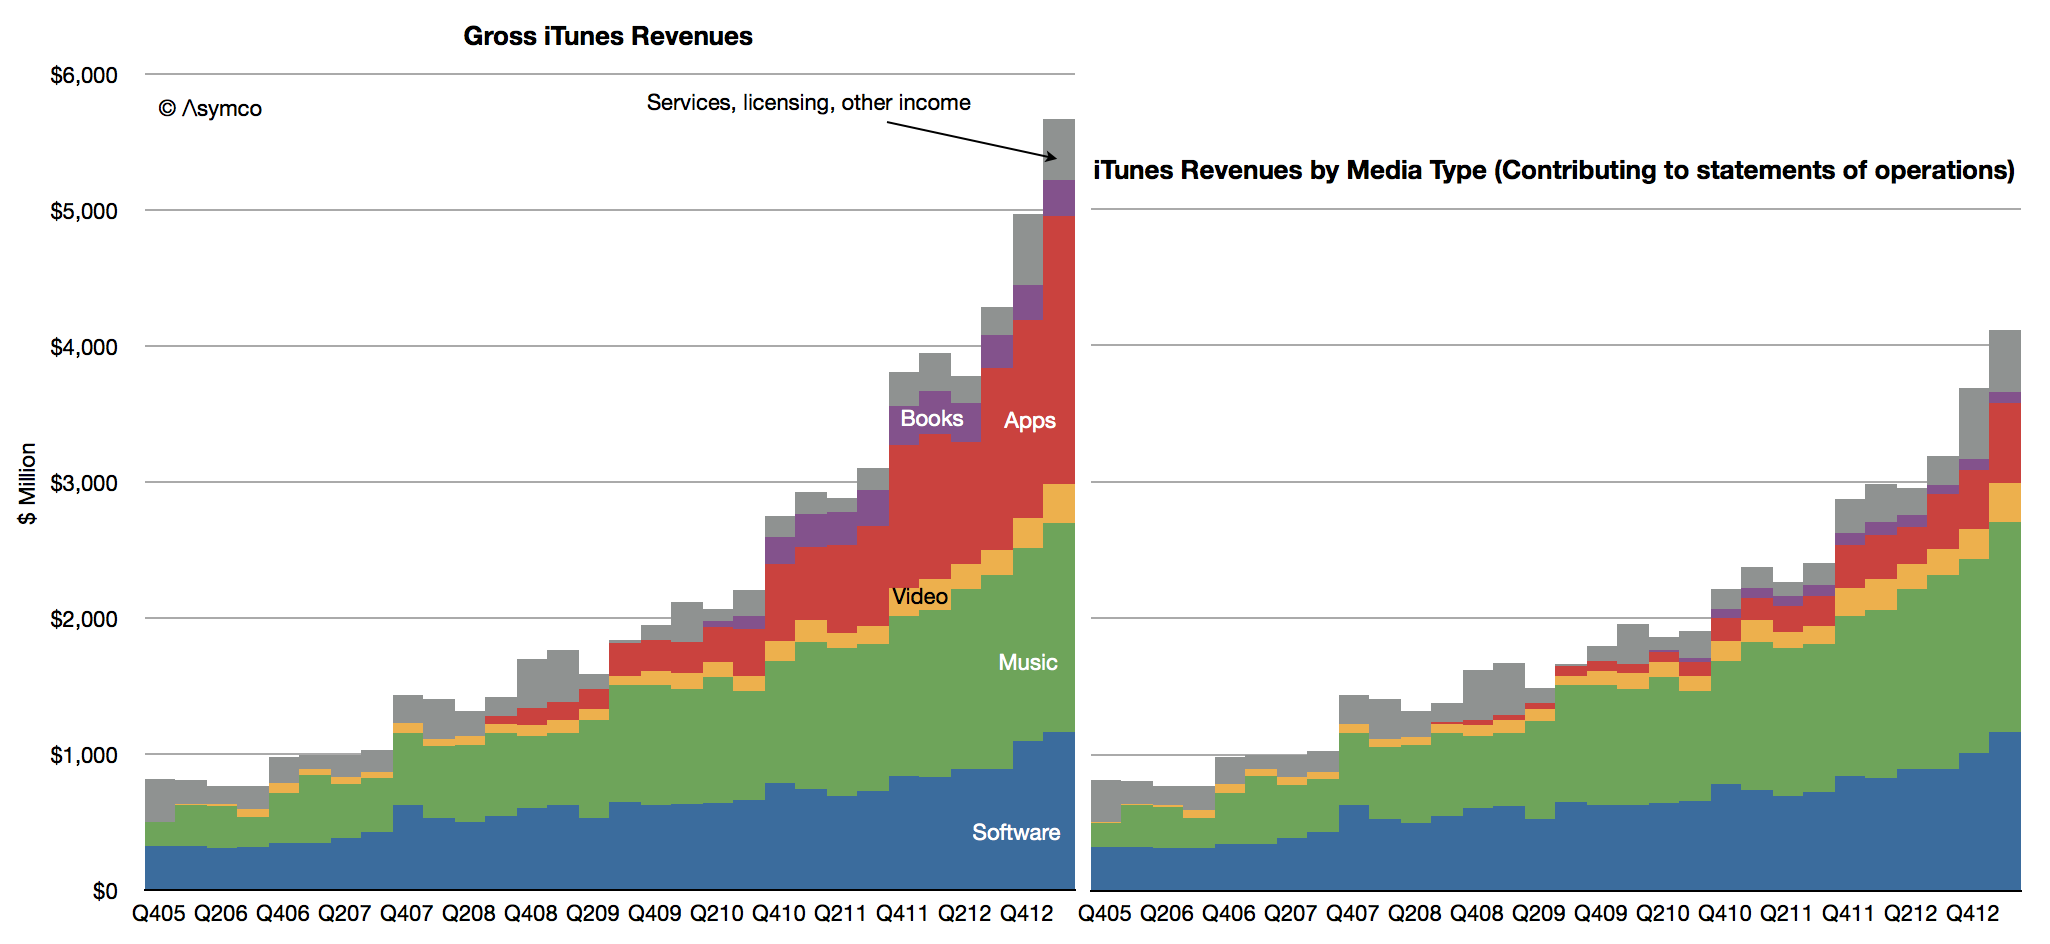
    Note that there is a difference between the amounts transacted through the store and what the company reports. The difference is shown in the following graph

    Screen Shot 2013-04-29 at 4-29-1.02.50 PM

    To mark it's 10th year, I wrote a segment for Billboard Magazine describing what iTunes has become. I suppose it's easy to become numb to these numbers, but there is perhaps one way to look at iTunes that is still compelling:

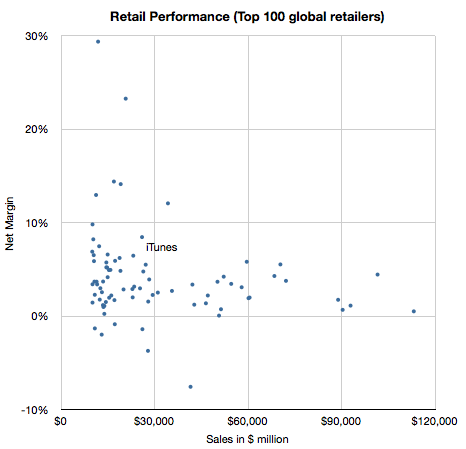
    Selling $20 billion a year would put iTunes in the top 20 US retailers and top 50 Global retailers.

    Screen Shot 2013-04-29 at 4-29-1.36.41 PM

    Not bad for a 10 year old.

  6. Margin Call 2

    Research · 159 comments

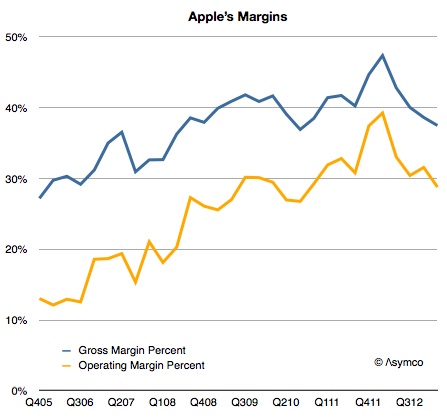
    I expected Apple's margins to improve  last quarter. They didn't and so the question I needed to answer is why. Here is a history of Apple's gross margin and operating margin as reported since late 2005:

    Screen Shot 2013-04-25 at 4-25-9.26.53 AM

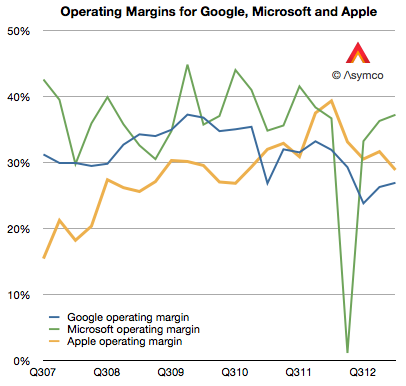
    For a company selling hardware these are extraordinarily high margins. They are higher than those of Google and have narrowed the gap with Microsoft,  neither of which has a high proportion of hardware sales:

    Screen Shot 2013-04-25 at 4-25-10.06.04 AM

    But they are not growing and the reason is to be found in the reason they grew in the first place: because of proportion of iPhones making up the total sales.

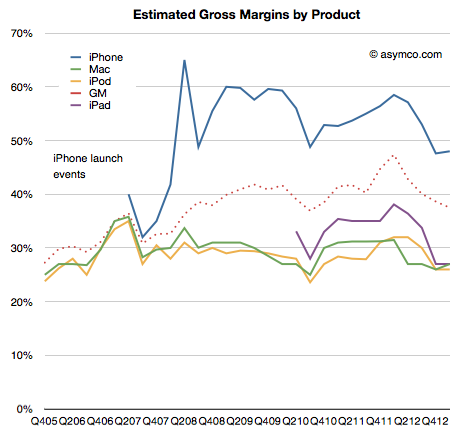
    As a reminder, the iPhone is a uniquely profitable product. I estimate that it obtains about 50% gross margins. The history of these estimates is shown below:

    Screen Shot 2013-04-25 at 4-25-9.32.34 AM

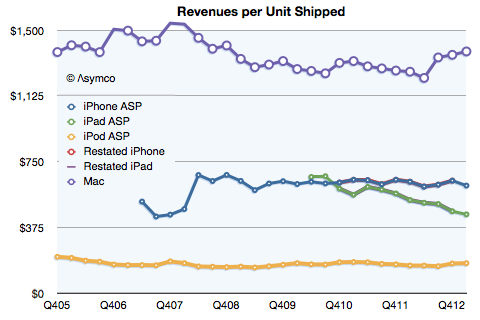
    It remains in stark contrast to the margins Apple obtains for its other products. Much of that is due to the pricing power of the product as shown below:

    Screen Shot 2013-04-25 at 4-25-9.33.13 AM

    Notice that even after the launch of the iPhone 5 and the persistence of two previous generations of iPhones (and their lowered pricing) has barely put pressure on pricing.

    Contrast that with the iPad. As its breadth of offerings increases, it causes a lower price per unit.  The iPhone is now at $613 per unit, even with two older generation products available. (The lowest price was in Q2 2012 when the average price was $608.) The iPad is at $449 per unit, down from $662 at launch three years earlier.

    So overall, margin is a function of three things:

    1. Price changes: iPhone had a small reduction (from $635 to $613) but the iPad has had a moderate reduction in price (from $531 to $449).
    2. Cost of components: This is reflected in product-line gross margins which can only be estimated. Compared to last year I estimate that iPhone gross margin dropped from 58% to 48%. iPad margins also fell from about 38% to 27%. The reasons were given by management as "Last year, our business benefited from …a more favorable foreign currency environment, and historically low costs."
    3. Mix of high and low margin products. The iPhone units grew at 7% but the iPad units grew by 65%. A year ago iPhones were 58% of revenues and this year they were 53%. The iPads were 17% and now they are 20%.

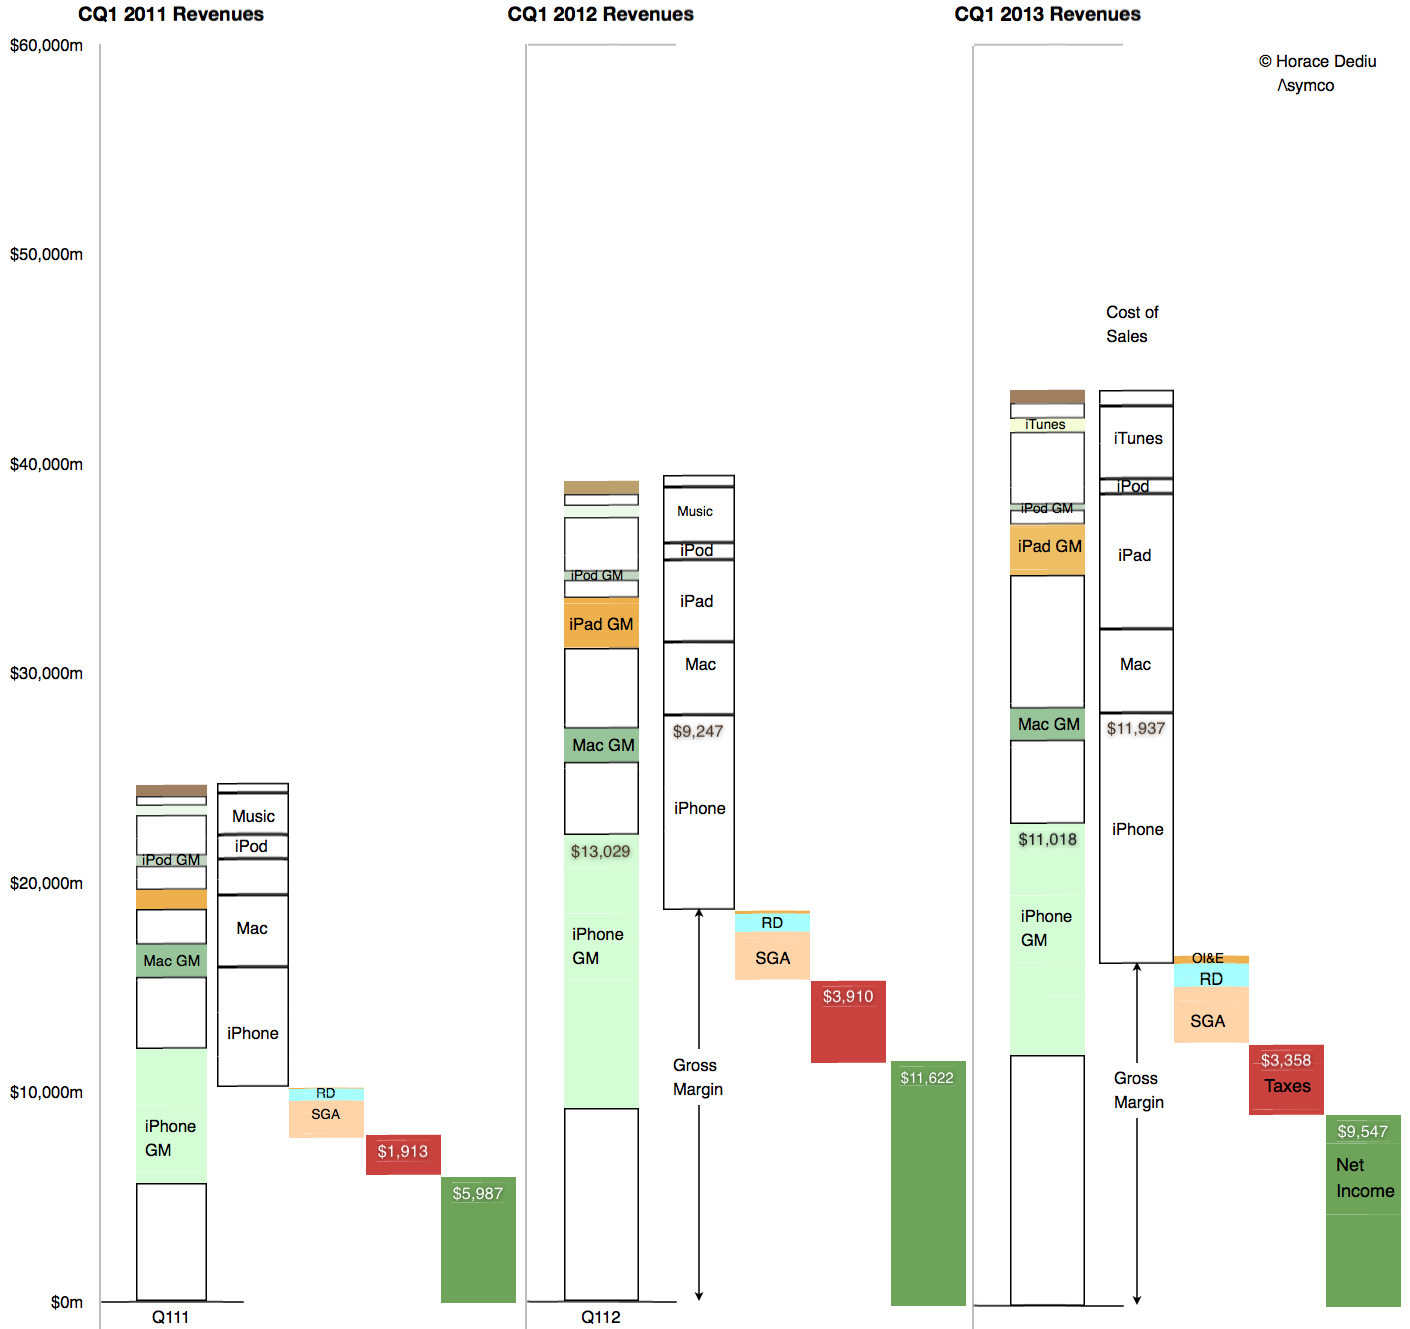
    The result is seen in this one graph showing the allocation of revenues and margins by product:

    Screen Shot 2013-04-25 at 4-25-8.46.04 AM


    So what is surprising? My expectations were met in terms of iPhone units (and exceeded in terms of iPad units). The mix was also something that falls out of the unit expectations. The pricing is also not  surprising.

    My guess is that the largest contribution to the "reduction of margin" is the increased cost of components. Note that the graph implies that even though iPhone revenues were nearly flat at 3% growth, the cost of those revenues went up by 29%! In addition, the iPad revenues grew 40% while costs went up 65%.

    Unit pricing (and implicitly competitive pressure) is still not the primary cause of the reduction in Apple's margins. Indeed, the curious thing is that margins are now at levels seen for most of 2009 and 2010, a time when the iPhone (and iPad) were seen as near monopolies in their respective categories.

  7. The job the iPhone is hired to do, part II

    Research · 52 comments

    I repeat what I’ve mentioned before: The iPhone is primarily hired as a premium network service salesman. It receives a “commission” for selling a premium service in the form of a premium price. Because it’s so good at it, the premium is quite high.

    The job the iPhone is hired to do 

    The original post on the hiring of the iPhone by operators was anchored in data about the revenue per unit (or price) that the product was able to obtain. The remarkable resilience in the exceptionally high average price showed that the iPhone was still getting a premium for moving users to higher levels of spending on network services.

    The evidence was circumstantial however: By knowing the price and knowing it was far higher than competing products and knowing that much of it was paid by the operator and not the consumer (at least not up-front) implied that it was the iPhone, and only the iPhone, that was hired as a network service sales tool.

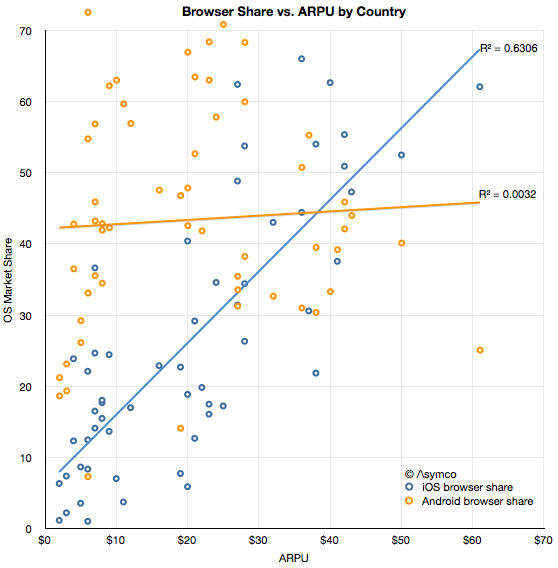
    Now we have more evidence thanks to Ben Thompson (@monkbent). I illustrate the data here as an x-y scatterplot.

    Screen Shot 2013-04-23 at 4-23-11.21.37 AM

    The data consists of ARPU (Average Revenue per User) ITU data from 2010 for 60 countries combined with browser share data on a country-level from the current period (sourced from StatCounter).

    The first observation is that there is a modest correlation between iOS usage and ARPU. It may not be particularly interesting by itself but it is interesting when compared with the lack of correlation between Android usage and ARPU.

    The presumption behind smartphone usage is that it leads to more browsing which leads to more network usage which in turn, leads to more network revenues and, finally, more network investment. If there is no additional browsing then there is a far smaller economic incentive to network operators to invest in infrastructure. It is this link between usage and revenues which I hypothesize drives operators to carry, subsidize and promote the iPhone. And the resilience of this link indicates that it still works.

    The ASP data seems to support this hypothesis and so does the ARPU data. The more iOS is in relative use, the higher the network revenue per user. Correlation is not causation, but when combined with data about Android, we can also say that the presence of the primary iOS alternative does not lead to more revenue. In other words, if a lot of iOS is present then revenues are higher and if there is little iOS present then revenues are not higher.

    I'm not suggesting that Android users use less bandwidth—the share data is after all relative—but rather that Android use itself does not seem coupled to paying more (or less) for service.

    If there is something to be concluded it's that not all usage is created equal. The data regarding how apps and ads are consumed is consistent with a qualitative difference between iOS and Android. This data is more of the same.

    It's something of a cliché to say that audiences vary in terms of quality, but that does not make it less true. Indeed, network operators depend on it being true.  And so does Apple.


  8. Interview with Chosun Daily of Korea about Apple

    Research · 65 comments

    The following interview took place by email on April 15th, 2013.

    1. What are the truth and false about the 'Apple shock' currently? In what perspective should we see this?

    First, I'd point out that during Steve Jobs' time the company suffered many such shocks. The stock fell many times far further than it just did for trivial and irrational reasons. Recently Warren Buffett himself pointed out that his own company had 50% drops in value four times in the past. Share prices are not always good indicators of potential and markets are not always efficient. I catalogued the dramatic share price declines in Apple during the last decade here.

    Second, I'd point out that the number of people watching and commenting on Apple has grown almost as fast as its sales and earnings. When Apple was small the people who studied Apple were few. (You could see this today for other, modest tech companies. There aren't 50 analysts writing reports every day and 2000 bloggers tweeting about Lenovo even though it's a successful and growing PC company.) Because of this growth, I would guess 80% of the observers have not observed Apple's prior painful episodes first hand. For them this is the first time a "dominant" Apple has slowed. The amplification of so many voices raising alarm makes it seem truer, but it isn't.

    Third, the failures being cited are not significant. In terms of increased competition, before Samsung there was Nokia and Motorola and the mobile Operators and Microsoft and Dell and many others long forgotten. They were all about to "defeat" Apple. As a quick example when Apple was "the iPod company," iTunes was considered vulnerable and fragile due to DRM concerns or the Beatles not being on it. Microsoft was launching "Plays for Sure" and Zune and Creative was suing Apple over patents. These battles are long forgotten. Before those there were concerns about the viability of the Mac that go back decades. At the time those were actually very valid concerns. At the time Apple did not have half a billion users. It depended on one product. But what saved them was a process of development of new products not the products themselves. iPod faded, Mac faded. What mattered is that they created new things to replace them.

    Finally, what is not commonly understood is that the mechanism for creating things at Apple is unchanged. Its functional organization is inherently unstable and chaotic, sometimes looking like it will derail. But that's the way it was designed to be. You just have to have faith that it's a system that works. Those who did in the past were well rewarded.

    2. What possibilities out of 1~10, do you think, Apple will suffer the same downfall as Steve jobs has left the company in the past in current?

    The threat is negligible. During the first departure of Jobs, the intention of management was to make the company into "a proper company." The plan was, essentially, to remove the chaotic model that Jobs had put in place and replace it with something more "rational" and "grown up." After he returned he set about not just returning the company to the way it was but to also codifying and identifying exactly what that was so that it did not happen again. You have to appreciate that the greatest thing Jobs ever created was not a product but Apple itself.

    Note that Apple managers stay in their roles the whole time they are there, sometimes for decades. There is no "general purpose" manager and the whole company has been organized along these functional lines. The way to think about it is that during his first departure the new management tried to undo what Jobs had built which is why it became dysfunctional: the DNA did not match the body it was operating. His return re-aligned the culture and operations to what was originally developed. As long as new management does not try to undo that, they'll be all right.

    3. Apple is now defined by some people, as 'the company who modifies well', not 'the company who innovates' well. What they made was ipad, ipod, iphone, apple tv and all the modifiers of the original products. Do you agree? If you do why?

    Innovation is not invention. Innovation is the application of invention in ways that solve new needs. I'm always amazed at how misunderstood this term is even though the definition is easy to understand:

    ("Innovation differs from invention in that innovation refers to the use of a better and, as a result, novel idea or method, whereas invention refers more directly to the creation of the idea or method itself.")

    Apple is an innovation machine. It does invent but that's not valuable in itself. Not all inventions are applied and not all innovations depend on internal inventions. Innovation is applied invention just like engineering is applied science. A better way to think about Apple is to think about Pixar. It's a blockbuster manufacturer. It makes blockbusters and nothing else. That means it does not make many of them and not always regularly and that the ideas may not be original, but the results are always very popular. Pixar is not like any other studio that makes some hits and some flops. Pixar is also a functional organization. It's not an accident that they were both built by the same person and that they are both successful after he left.

    4. Google is forecasted to release lots of products this year, but Apple isn't really looking forward to so many innovations. Inside Apple, is the innovation team really making a new innovative product? what are their longterm plans to fight with Google, or Samsung and the rest of the competitors?

    People outside of engineering organizations, especially large ones, don't appreciate the time scales involved. Products you see today were designed, planned and developed many years ago. We see plenty of evidence of this but we tend to ignore it. Consider that some prototypes end up on ebay showing they were built years before launch. It is the same with evidence presented in trials proving work on the product 4 to 5 years before it was launched. This is not the case just for Apple but all other technology companies.

    For this reason, what is happening in the market and what is happening inside the company are two completely different universes. The tendency is to assume a direct relationship between market momentum and current management decisions. These are connected but with many years in-between.

    For example, globally accurate Maps require a minimum of five years of development. Decisions on what ended up being Apple Maps had to have been made by Jobs himself. Namely, he must have decided whether to buy or build Maps. Contrast with Nokia's decision in 2007 to buy maps for a cost of $8 billion; instead Apple licensed and then decided to build later. In 2007 Jobs decided that it was more important to work on the product itself, meaning the iPhone (while Nokia didn't prioritize product innovation.) The results are visible today: Apple is behind and needs to accelerate with Maps and Nokia with its great maps must find a way of staying in business.

    Apple is not only working on the next product but probably 15 new products, of which 14 will be discarded. Again, I cite Pixar. Each movie is produced with multiple stories, multiple character decisions and different plots in parallel. Much ends up being thrown away. We don't see any of that.

    Apple is extremely "myopic" in that it is very concerned with execution and there is no visible "strategy plan".  That's by design. The product comes first and then comes the market and then comes strategy. To create great products you need to tune out almost everything else. However, they do have a "strategy" and that has to do with which problems they should attack and which they shouldn't. Usually they are successful because what they can attack nobody else can. That is due to their integrated, functional approach.

    5. Isn't Apple, relying too much on semiconductor manufacturers? Meaning, isn't Apple only try to be 'stable company' to supply their products on time? sometimes when companies have disruptive technologies, they have hard time supplying products.

    You're touching on the question of the problems of integration. Yes, there are vulnerabilities but that's the way it has to be. To mitigate this Apple is increasing its integration of the value chains. For example developing its own chip design and owning a lot of capital equipment.

    6. If you were Tim Cook, what would you do?

    I'd buy Intel and turn them into Apple's microprocessor design and manufacturing group. They won't have much to do in a few years and they'll be cheap.

    7. what are the reasons that Apple try to make a 'apple watch', 'apple bicycle'? How do you define these products, since, watchs and bicycles are a total different paradigm which is a totally different industries? Is Apple realizing that smartphone industry is hard for them to innovate?

    Computers are becoming more personal, intimate. It's a natural evolution from large to mini to micro to portable to handheld. I don't see this slowing and Apple should re-define the user experience during every such shift. Here again integration is essential.

    8. what are some of the stuff that we don't know about Tim Cook?

    I can't help you there. Only thing I can say is that people who know him have told me he's not soft and gentle as a manager. He's tough.

    9. How will Samsung and Apples patent fight come to conclusion?

    Again, I can't add much to this. Litigation is often a decision made outside of market conditions so it can be arbitrary.

    10. how does employees or executives inside apple think about their company?

    It's hard to describe this without sounding soft, but the employees at Apple tend to love the brand. You can't measure that but I can think of one proxy: the number of applicants to retail jobs are in the hundreds for each opening.

    [Update: Bono made an important observation regarding Jony Ive which was published after this interview: What the competitors don’t seem to understand is you cannot get people this smart to work this hard just for money. Jony is Obi-Wan. His team are Jedi whose nobility depends on the pursuit of greatness over profit, believing the latter will always follow the former, stubbornly passing up near-term good opportunities to pursue great ones in the distance]
  9. Lumia: Is the light visible?

    Research · 64 comments

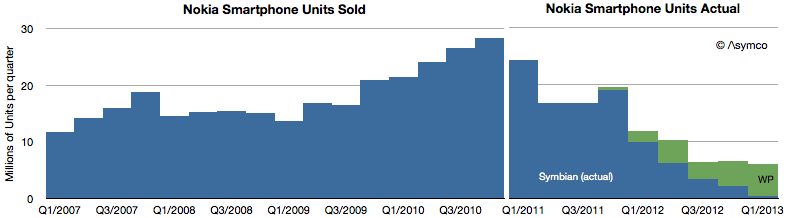
    The following graph shows the history of smartphone volume shipments from Nokia.

    Screen Shot 2013-04-18 at 4-18-1.48.21 PM


    Lumia sales have increased to 5.6 million units last quarter. Up from 4.4 during the previous quarter. Symbian devices have nearly disappeared from the market with only 0.5 million shipped.

    This puts an end to Symbian sales after over a decade since sales start and two years after it was declared that sales would end.

    The bad news remains that smart devices as defined by Nokia are still not profitable. If volumes grow it's possible that the cost structure (without further cuts) can be sustained and perhaps the business will get its footing.

    The level of 6 million units/quarter is about where HTC and RIM are today but only half of what ZTE and Huawei are probably shipping. As a hardware business it might work, barely. It certainly helps to have $250 million as platform support payments from Microsoft.

    As a platform it's still a very long haul for Windows Phone. Even if we assume a nominal $15 revenue/ Windows Phone license and ignore the kickback, at this level of sales the platform generates less income than what Microsoft gets from licensing IP to Android vendors.

  10. Escaping PCs

    Research · 275 comments

    The Windows PC market is contracting. The market data has been showing unit shipment declining for some time with the latest quarter having perhaps the steepest decline for two decades.

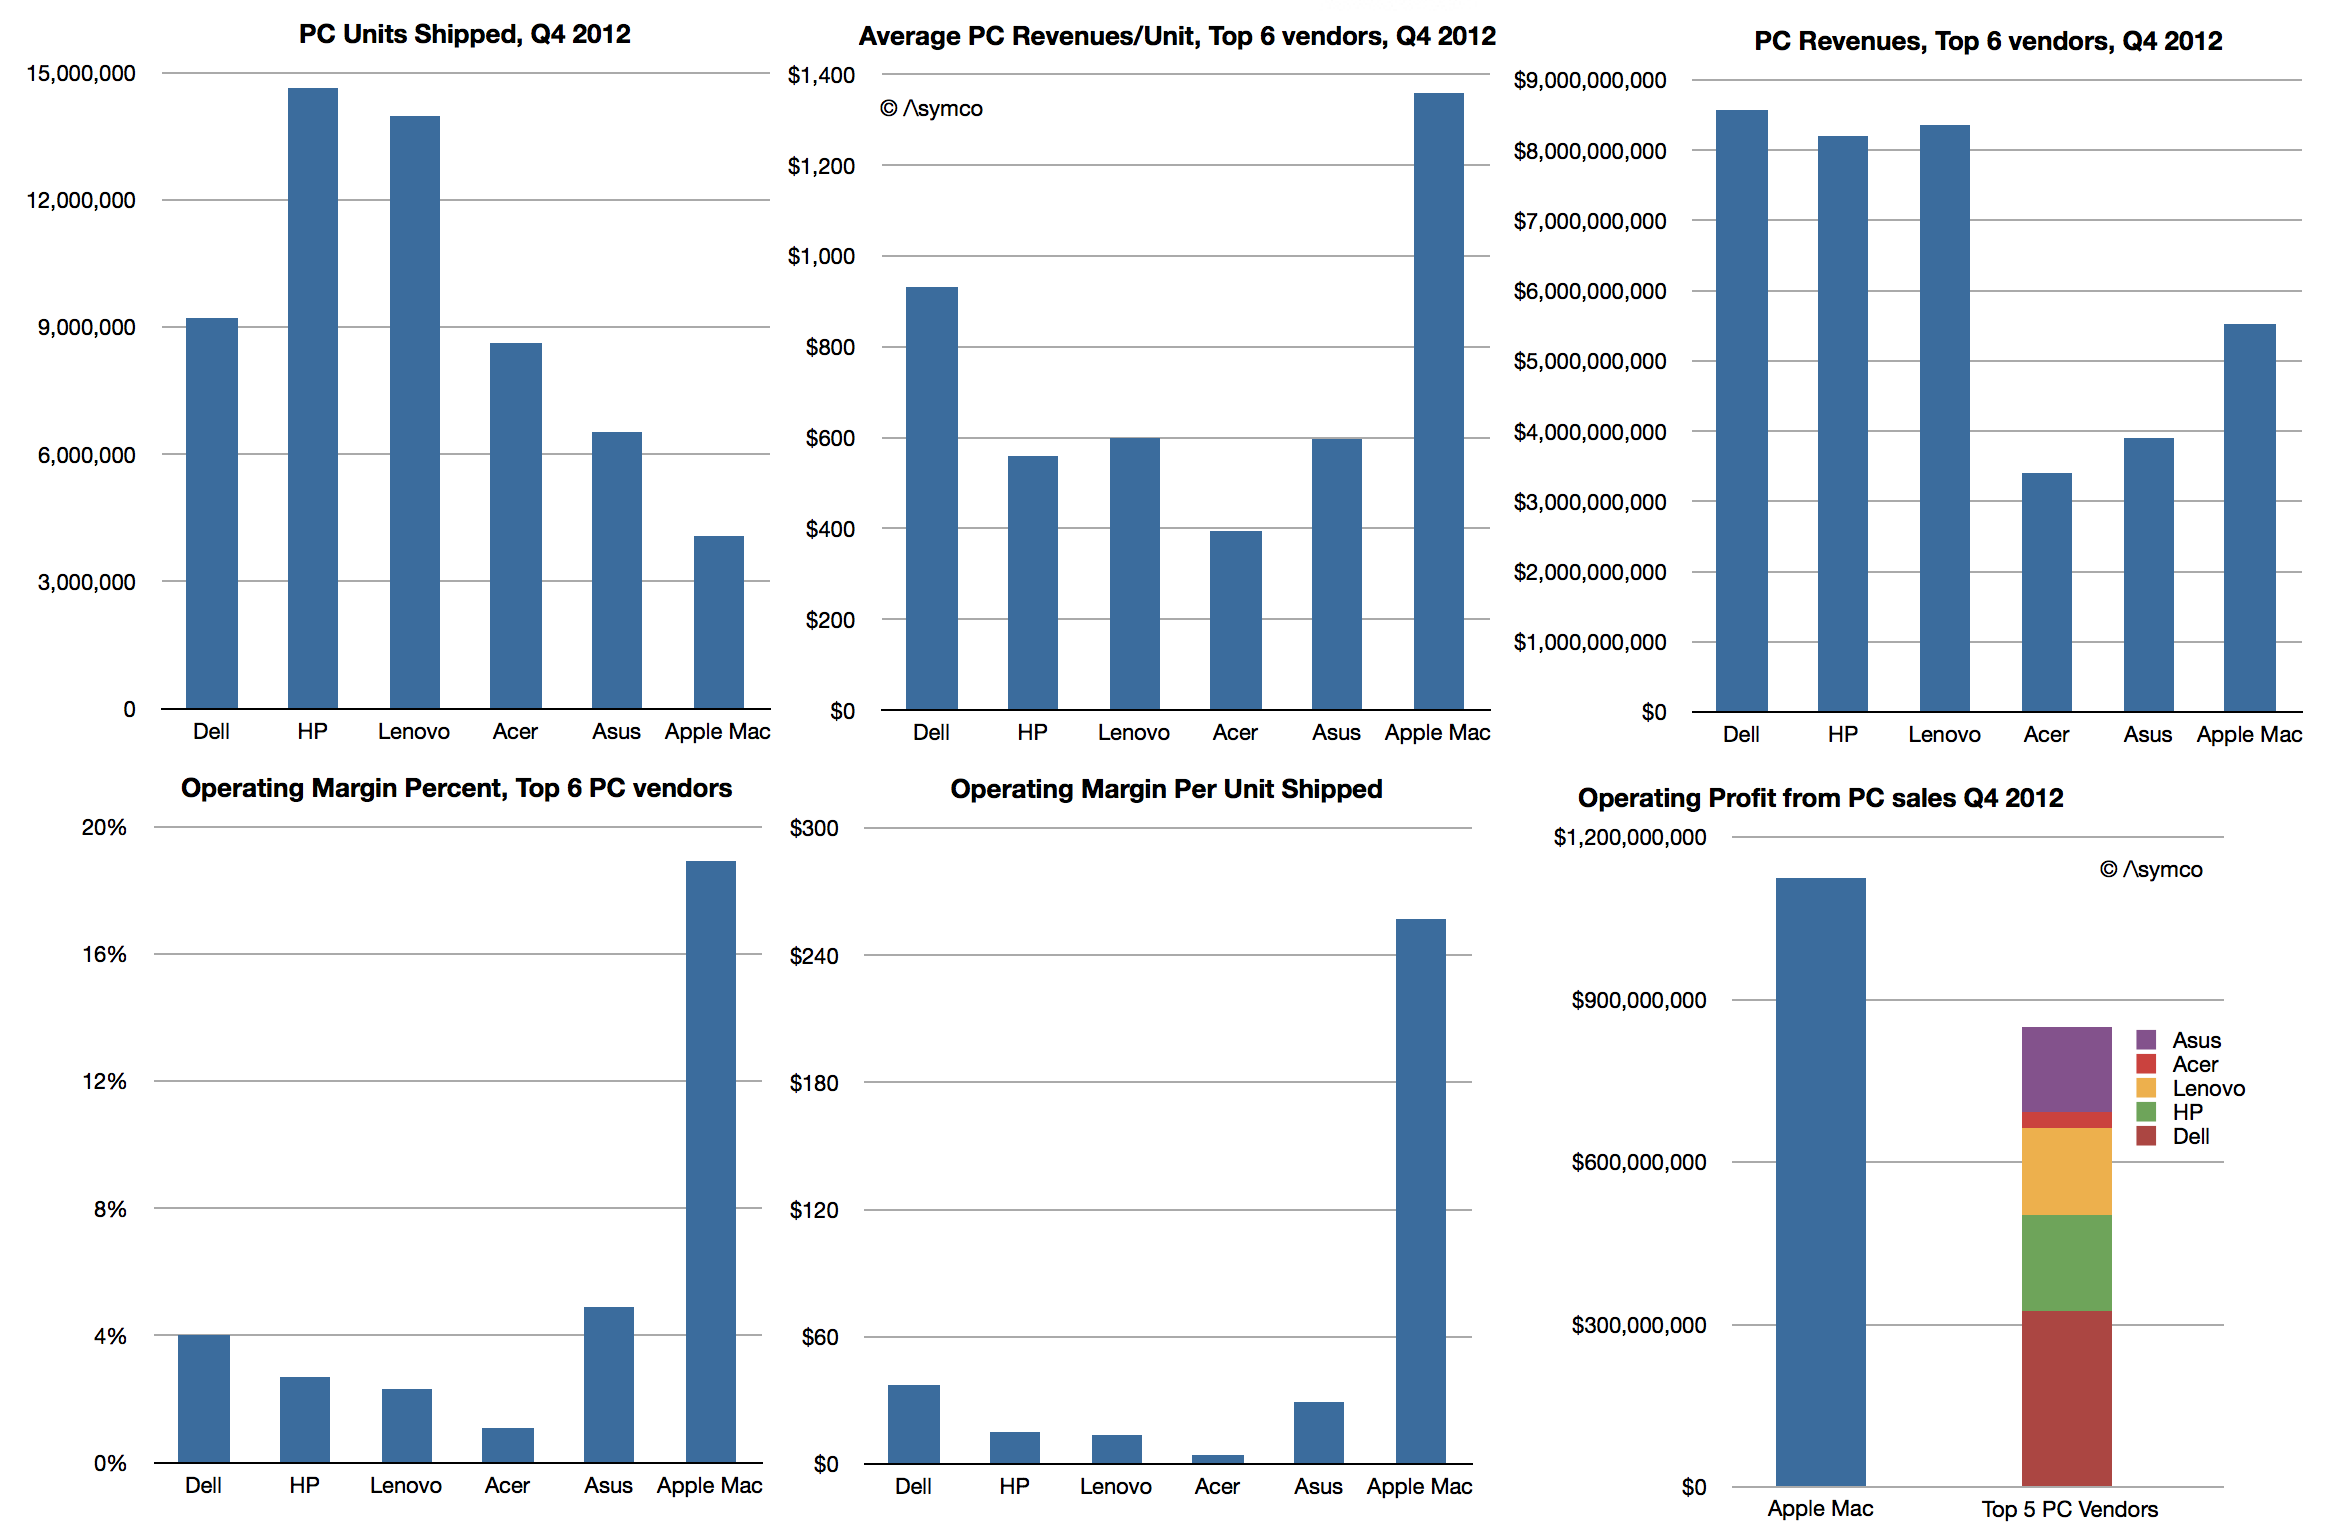
    What remains undocumented however is how the market looks when considering economic value. A more complete picture would be to show revenues, average selling price (or revenue/unit), operating margins/unit and percent of profit capture.

    The data is not beyond reach however. It involves combining the shipment estimates from e.g. Gartner with financial reports from the companies themselves. Some analysis is required to estimate margins but they are also not hard to obtain (e.g. from third parties.)

    So here is a view of the market for the fourth quarter 2012:

    Screen Shot 2013-04-16 at 4-16-4.05.57 PM

    The only inference I made was with respect to Apple's margins for the Mac. These are based on deriving a gross margin of 26% and adding an estimate of the SG&A and R&D "overhead" of 7.1% of sales, a figure which applies to the entire company. This yield an operating margin of 18.9%.

    If this estimate is considered then the operating profits from PC operations imply that Apple generates more profit than all the top 5 PC vendors combined.

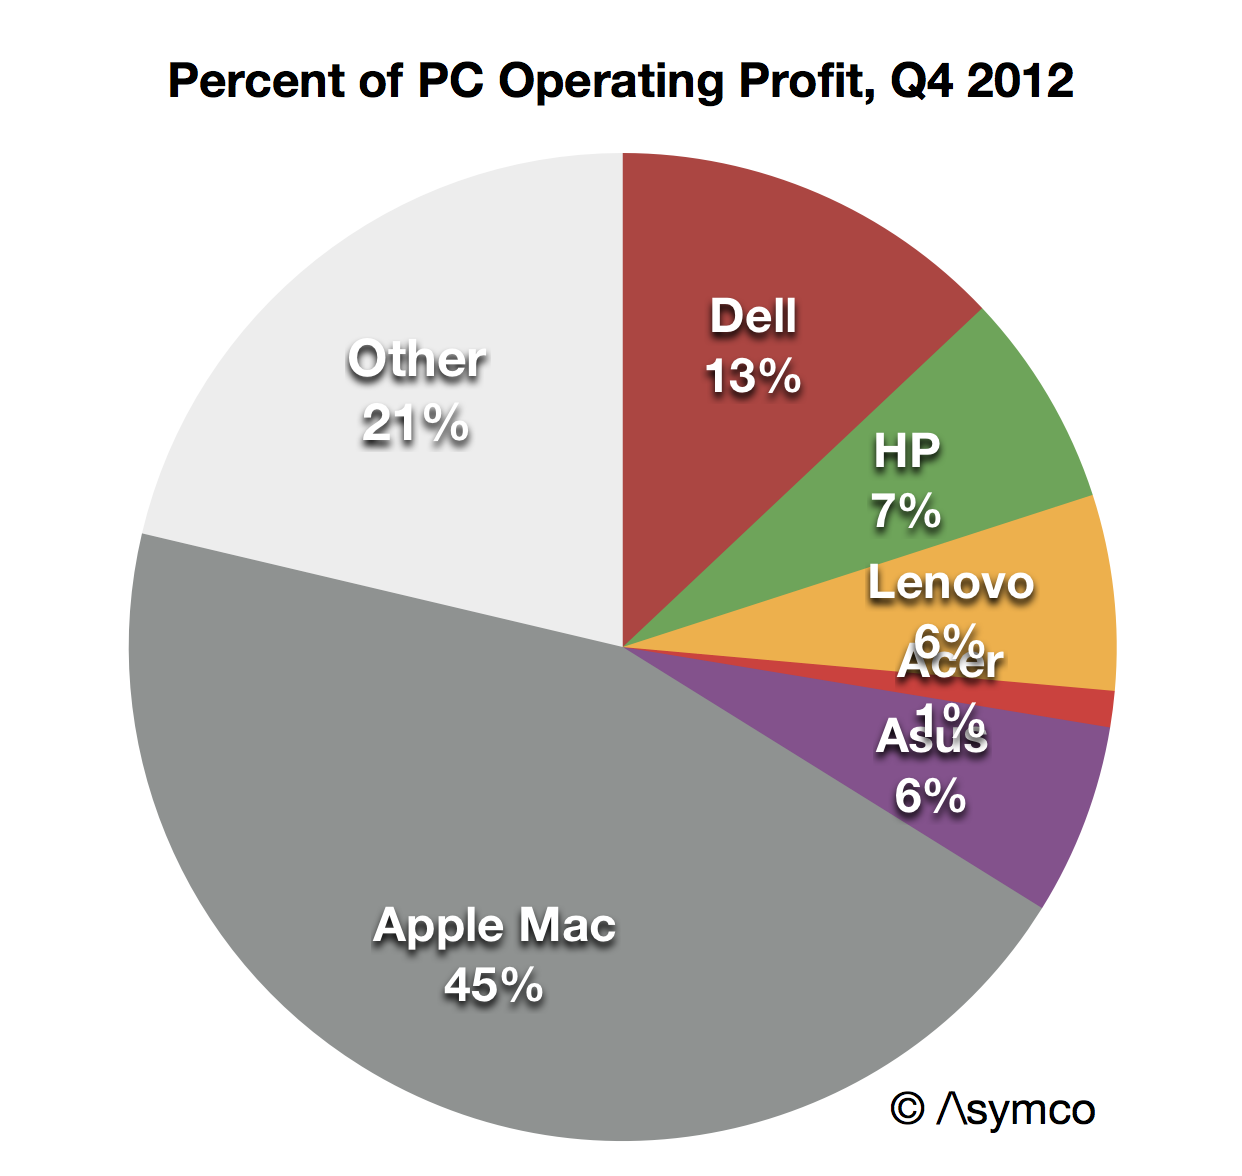
    Assuming further that "other" vendors have the same profitability ratio as the top 5 combined yields a figure of 45% "profit capture of PC market" for Apple. This is not as good as its performance in the phone market, where Apple has about 72%, but it's not bad.

    Screen Shot 2013-04-16 at 4-16-4.16.46 PM

    The real problem for the PC vendors is not that they have such low margins–they've had low margins for decades. It's that the volumes which "made up for" low margins are disappearing. Apple is not immune to a gradual erosion of Mac volumes, but they have positioned themselves for growth with devices and content commerce and services. They have essentially "escaped" PCs and indeed caused the need to escape in the first place.

    The problem is what could the others do? It seems all they can do is depend on Microsoft getting their strategy right.

    Sounds risky.

  11. Happy Birthday iPad

    Research · 34 comments

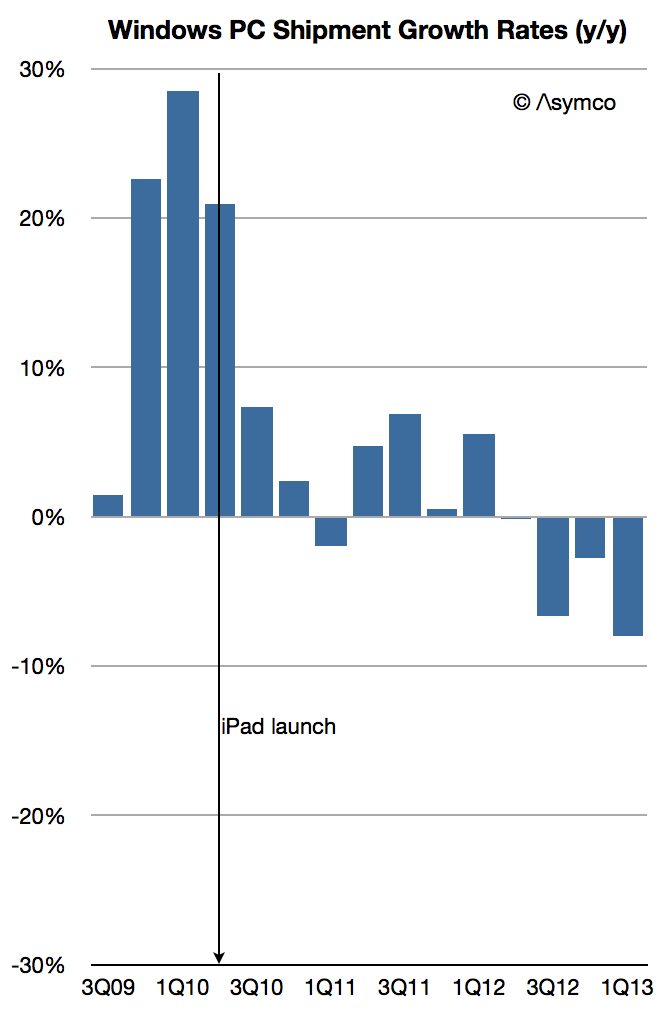
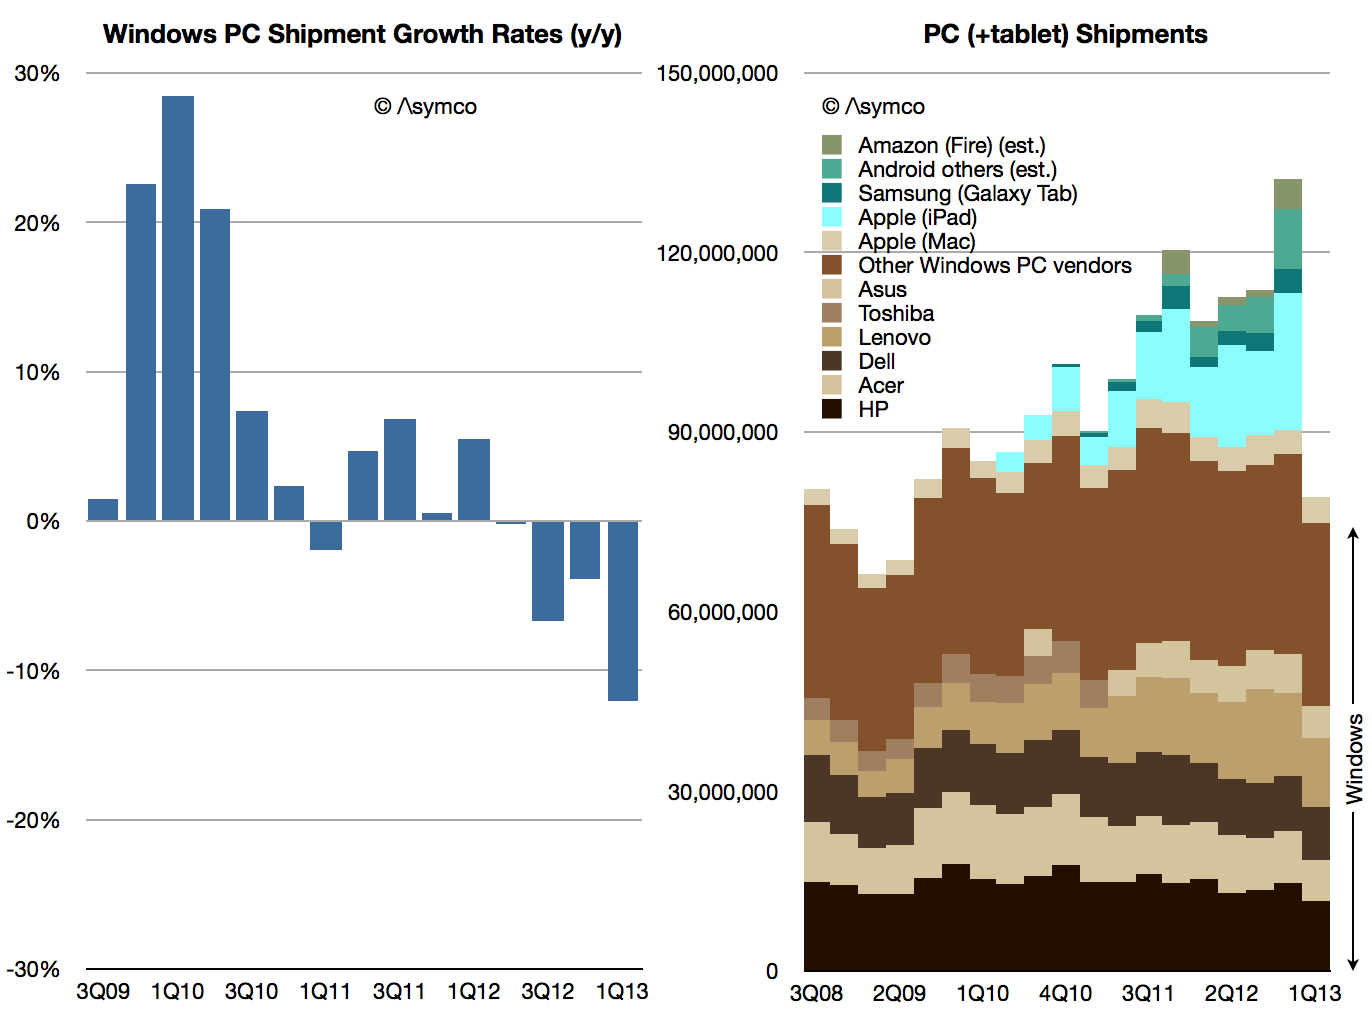
    The latest data on PC shipments from Gartner showed a decline of  11.1% from the first quarter of 2012. As we don't yet have the final data on Apple's Mac shipments, I used my estimate of 4.38 million units (14% growth as per NPD estimate for the US) to obtain an estimate of Windows PC shipments.

    That number is 74.8 million units. In the first quarter of 2012 the corresponding calculation yields 85.1 million units. That makes Windows PC rate of decline -12%.

    The historic shipment data and growth rates are shown below:

    Screen Shot 2013-04-11 at 4-11-6.07.30 AM


    Note that tablet data is not yet included in the shipments summary. Windows shipments are shown in shades of Brown and tablets in shades of Blue/Green.

    The decline in PC shipments is persisting and even accelerating.

    Coming only a week after the iPad's launch birthday, it's perhaps a fitting testament to its impact.