Asymco

Asymmetric Intelligence

Market

  1. The curious case of slowing US growth for Android

    Research · 155 comments

    The latest data from comScore MobiLens is showing an uncharacteristic slowing in smartphone growth. In the survey period ending November, the number of smartphone users in the US was 91.4 million. This is equivalent to 39.1% penetration, an increase of 0.6% (i.e. up from 38.5% in the last period.)

    The growth is equivalent to 1.4 million new smartphone users (i.e. users who switched from a non-smart device for the first time.) The problem is that this is half the growth of the previous period. The following chart shows the growth as the weekly add rate.
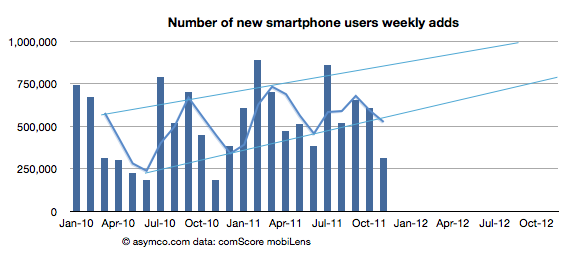
    As you can see, the growth has fallen to a level not seen since 2010. The cause may be seasonal as last November was also a slow month. I added a three month moving average which shows that although there seems to be seasonality, the last period did not show the peak of previous periods.

    To better understand what happened, I looked at the performance by platform. The following chart shows the net user gains by platform.
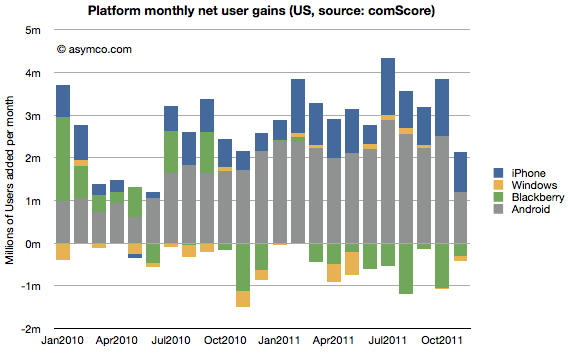
    What appears immediately is that Android growth was the primary cause of a change in the pattern. The iPhone grew slightly more slowly sequentially but the difference between November and previous periods is not great (941k adds vs. an average of 904k over the previous 12 months.) BlackBerry moderated its losses and Windows is quite a small influence on the market.

    Android gain was 1.2 million vs a trailing twelve months' average of 2.24 million. Android's slowing in the US is significant.

    We also have access to additional data from Google themselves. We had an update that showed that by late November there were 200 million Android devices activated. We also had an update from mid October of 190 million activations. That makes the increase in activations of at least 10 million during the same period that comScore was measuring the US.

    comScore's increase in Android users of 1.2 million then becomes even more interesting. It implies that the US consumers were responsible for no more than 12% of Android activations in the November time frame.

    Furthermore we can derive from comScore's data the total devices in use in the US by platform: the figure for Android is 42.9 million (46.9% of 91.4 million smartphones in use). By the end of November, the total activations from Android adds up to about 204 million. Excluding some devices which may be out of use, we can estimate that about 20% of all active Android phones are in use in the US. Conversely 80% of Android devices are in use outside the US.

    This means that the US share of Android activations is decreasing. From a cumulative average of 20% to a recent 12%.

    So the mystery of what caused the slowing in Android (and hence in all smartphones) in the US remains. Seasonal effects would affect all platforms equally and that is not the case. I'm not comfortable ascribing a cause until we hear more evidence and the pattern is more established. But something does seem to be happening.

    [Update: The source data is available here. Note:  multiple tabs.]
  2. Discerning Apple's international product positioning through the big Mac index

    Research · 31 comments

    Thanks to all those who contributed to the big Mac index there is a substantial amount of pricing data available in one location.

    The analysis that I hoped to perform on the data was to see if Apple was pricing specific products differently in international markets. It was prompted by some apparently anomalous pricing of the iPhone 4S in Brazil.

    To summarize, the idea is to calculate the "expected" price of an Apple product by taking the untaxed US price and adding duties and tariffs and taxes to determine what that product "should" cost in another country. Then taking the difference between this "expected" price and the actual price to determine if Apple is using pricing to signal in a particular market.

    The analysis basically eliminates the effect of government on price and leaves currency and actual pricing signals from Apple as variables.

    The analysis is not simple because there are many obscure tax rules. Some products are taxed differently in the same country. I have not completed the country-level analysis but have been able to see some averages over the countries reported (total of 45 reports.)

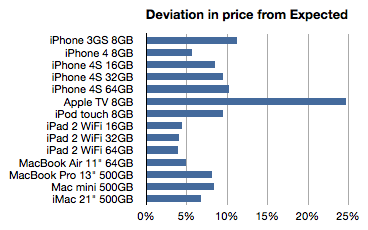
    The following chart shows the average deviation from "Expected" as a percent:

    Here are some potential interpretations of this data:

    • The more a product deviates from expectation (e.g. the Apple TV) the more it's likely to be targeted to the US or potentially has advantages of scale in the US
    • The less of a deviation (nearer to zero, e.g. iPads) the more the international market is interesting to Apple. They are essentially signaling that those products are targeted at wide distribution.

    If we take this train of thought it takes us to these conclusions:

    1. The Apple TV is being "subsidized" in the US. The price is so low there probably because it is benefiting from content sales. This is a compelling argument and it might suggest a strategy for Apple TV closer to that of Amazon's Kindle than to any of the telecom or computing products Apple sells. This may have significant implications in the pricing of any future "TV" product from Apple.
    2. The iPhone 3GS seems to be a US-targeted product. Anecdotal  evidence shows that the product is not particularly strong selling in international markets. Apple is seemingly not trying to stoke demand with discounting.
    3. The iPhone as a brand is not tuned to compete on price globally. Indeed, the iPhone 4S is the most "overpriced" product and seems to be premium priced vs. iPhone 4. The iPod touch is also something of a prima donna when it comes to pricing.
    4. In contrast to the iPhone, the iPad is being positioned through pricing for broad global distribution. This is undoubtedly due to their unlocked nature but there might be some other penetration tactics at play here.
    5. Macs in general are not priced aggressively internationally. However the Air does seem to be positioned for volume growth (while the mini is not.)

    Admittedly, these are quite aggressive conclusions given the limited data. What gives me some confidence in these conclusions is additional circumstantial data. The demand for some products is clearly higher outside the US than others. I believe and this data seems to support the notion that the overall strategy for the iPhone, iPad, Mac and iPod is being tuned for the international markets with some precision.

  3. Who is being reasonable now?

    Research · 49 comments

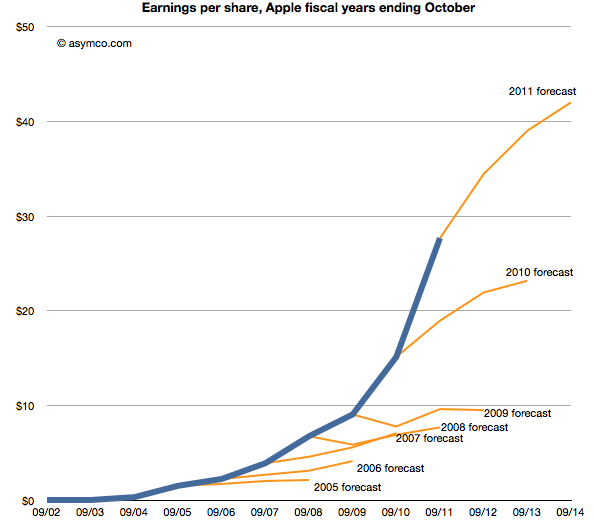
    Last week Horace wrote about the apparent "reasonableness" of analyst Apple estimates. He explained how the consensus for Apple's growth was always deeply pessimistic because its performance could be argued to be anomalous. It was just too good to be true. We reproduce the chart here:

    The estimates look like characteristic "tell-tales" of a company running strong into the wind.

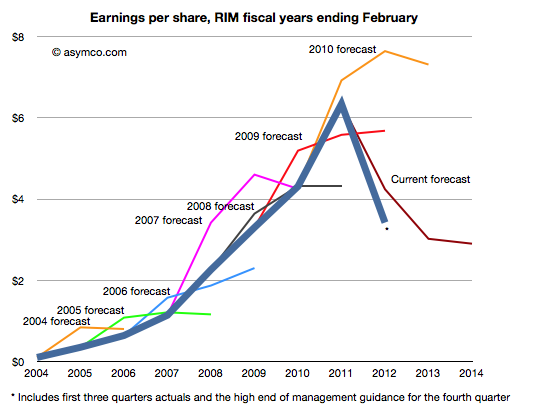
    This conservatism in the face of rapid growth sounds "reasonable" but is it always practiced? And what about the ability of this conservative strategy to predict dramatic changes in growth? To test, we started to look at the predictions for RIM. RIM has also enjoyed strong growth over a similar time frame as Apple. How did analysts predict its performance? The following chart was prepared using the same technique as the one for Apple[1].

    Surprisingly, the "tell-tales" look very different.[2] For every year we looked at the first year estimates were over-optimistic with a decline expected after one or two years. This pattern is remarkably consistent within the RIM data and remarkably inconsistent when compared to Apple.

    It's as if there was nothing in common with the methods used. This is perhaps appropriate, but the "quality" of predictions are not much better. With RIM they were too optimistic in the short term and too pessimistic in the medium term. With Apple they were far too pessimistic consistently.

    More worrisome, the 2010 forecast did not offer any hint of the dramatic decline which followed only a few months later. And after three quarters of really bad news, the consensus is still higher than what will likely happen (ensuring an uninterrupted string "misses").

    The study of these two companies' forecasts is a study in contrasts. We can say that the forecasting is disturbingly consistently inaccurate but we can also say that there seems to have been a bias of pessimism for Apple and optimism for RIM. We can only guess at the cause, but the consistency of bias points to something institutional.

    ---

    Notes:

    1. The three year forecast consensus (sourced from Bloomberg) was sampled one month following the end of each fiscal year. This should offer the analyst enough time digest the year passed and deeply contemplate the future.
    2. If we may stretch the analogy, these are indicative of an imminent stall.


  4. How many Android phones have been activated? (Updated)

    Research · 86 comments

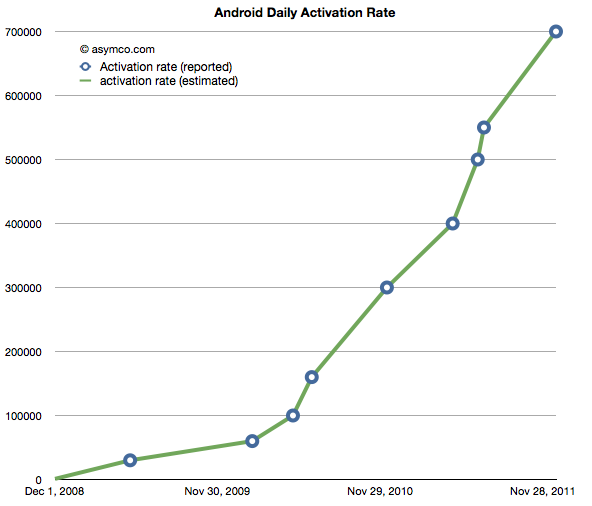
    The following chart shows the reported (circled points) and estimated (lines) for Android activations. The resolution of the sampling is every seven days.

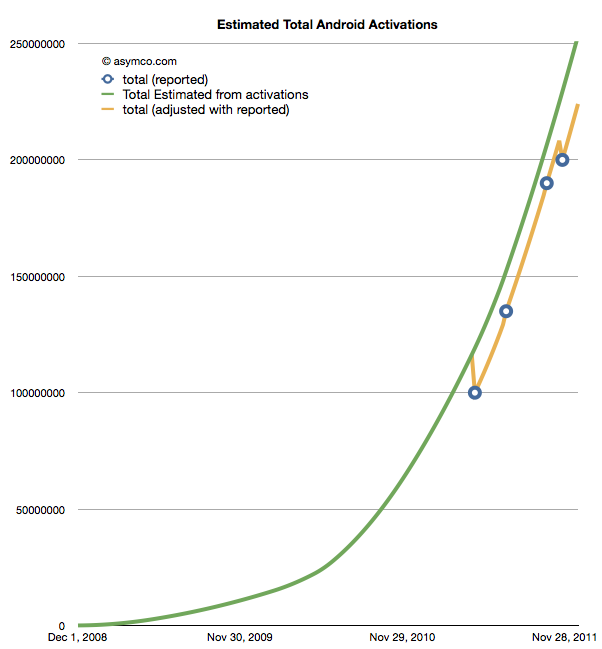
    If we take these estimates and then compile a cumulative total of activations we get the green line in the chart below.

    The wrinkle in the picture is that Google also occasionally reports cumulative estimates of total Android shipped. They are shown as the blue circles in the chart above. There is some room for error as the cumulative totals may not be reported the same day they happen and the assumptions in the activation rates may not be reflecting occasional slowing.

    However that leads to a problem. By adjusting for the reported totals we get the orange line. The trouble with it is that it has these improbable "kinks" where the total is adjusted down, something that is not happening in reality. It's a kludge we need to make estimates fit reality. Normally, this is something we can sweep under the carpet, but with the size of the market, the errors creep up to tens of millions of unitis.

    The first downward adjustment would have been 19 million in May. Today, the difference between the green line and the orange is about 25 million.

    So the best we can say right now is that there have been between 224 and 253 million Android devices activated to date. Why Google does not report this data regularly and consistently remains a mystery.

    Update: The data used in the charts above is available as a Google Docs spreadsheet here.

  5. The big Mac (and iPad and iPhone) index (Updated)

    Research · 94 comments

    Apple's products are globally consistent. They sell the same exact[1] product in all countries. An unlocked iPhone is the same everywhere. It makes the products "liquid" in that they can be easily bought and sold across borders.

    However, laws do not permit the import and friction-free trading of electronic products. In addition to regulations there are duties levied and there are sales or consumption taxes levied on the purchase.

    However, knowing the retail price of an Apple product in a particular location, and knowing the tax and duties levied, can we work out if the price is consistent?

    Here is an example:

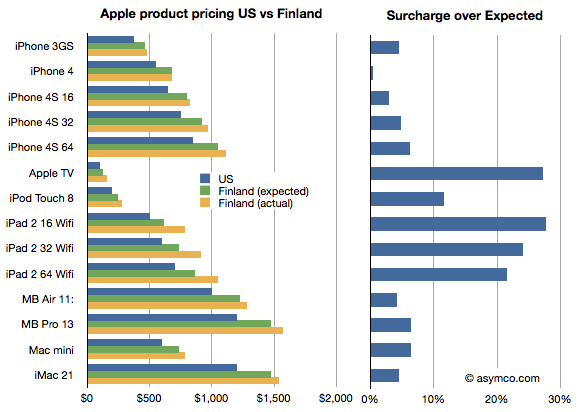
    I illustrated the price of a basket of Apple products in the US online Apple store in blue and the same products in the Finnish online Apple store where the prices were converted to US dollars in yellow. I also calculated what the price in Finland "should" be if the products were sold with the known VAT of 23% added. I called this "Finland (expected)" price and it's shown in green.

    I then took the difference between the "expected" and actual prices as a fraction of the expected and called that the "surcharge". The surcharge can be interpreted as "how much more does a buyer in a different country pay over the price in the US (excluding US sales tax) plus VAT and duties."

    What the chart shows is that not all Apple products are treated equally by Apple. In this particular case Apple TV and the iPad are "overpriced" significantly. Interestingly, the iPhones are nearly what would be "expected" price.

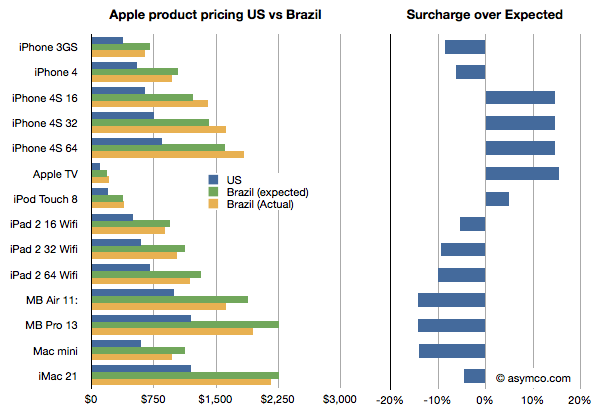
    It gets curiouser when comparing with other countries. In this case I compare the same basket in Brazil.

    Here the story is reversed. The iPads are cheaper than one would expect while the iPhones, especially the 4S, are more expensive, though not by as much as the iPads are in Finland.

    Why is this?

    I don't know. These prices are set by Apple though they may be influenced by operator deals they have locally or other terms. It would require local knowledge of the market to solve this.

    What would also be instructive, I believe, is to collect data from many more countries. If you are living in another country, you can help by providing the following data: For each of the products in this list,

    iPhone 3GS
    iPhone 4
    iPhone 4S 16
    iPhone 4S 32
    iPhone 4S 64
    Apple TV
    iPod Touch 8
    iPad 2 16 Wifi
    iPad 2 32 Wifi
    iPad 2 64 Wifi
    MB Air 11:
    MB Pro 13
    Mac mini
    iMac 21

    provide the retail prices (preferably from an online store) and the local VAT or duty that is expected for electronic products (enter data here.) You can provide the prices in local currency. We can then try to put a global picture together and understand what affects price differences across borders[2][3].

    Update: You can view and enter data in the spreadsheet here.

    Notes:

    1. There are minor differences like power adapters but they are not materially more expensive to produce.
    2. See also The Big Mac index.
    3. Thanks to Paulo Silva for supplying the prices from Brazil and asking the pertinent questions.
  6. On being reasonable

    Research · 139 comments

    The discussion on why Apple is cheap was very useful. The debate brought into focus the possible causes for pessimism in the face of overwhelming evidence to the contrary. But maybe there is yet another explanation. The way the data was presented was as a difference between historic and projected growth rates. Is this the way analysts actually think?

    Perhaps they don't project growth based on historic growth, but project earnings given historic earnings. In other words they don't look at the first derivative (change in earnings) but the  shape of the actual data.

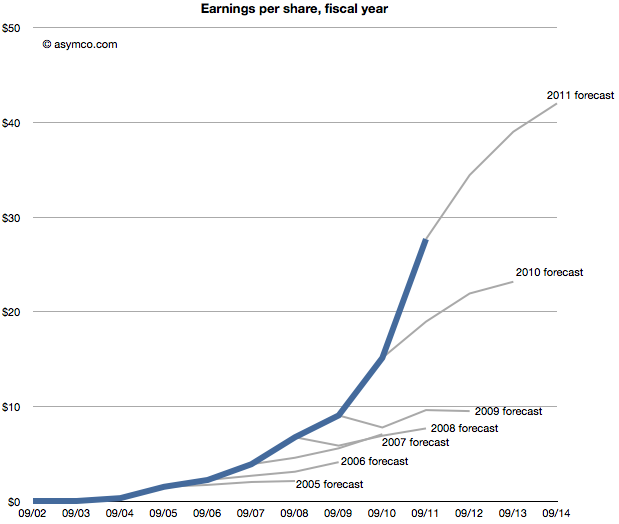
    The following chart shows that data, i.e. forecasts as an extension of a sales trajectory. The blue area are actuals and the grey branches show projections at a given end of fiscal year.

    Seen this way, we can imagine how the projections can be considered "reasonable". Some appear to be linear extrapolations while others show up as the end of "S-curves".[2]

    What none of them imply is  exponential growth. But would forecasting exponential growth be considered reasonable? Clearly not since it's never been consensus. But disruptive companies do follow non-linear growth. In fact, every company that has gone from being small to being big (which is to say all large companies) went through non-linear growth phases. The "natural" shape of growth is exponential.

    The failure is therefore not of reason but of failing to use a model that assumes acceleration of sales. I believe that institutional financial advisors are conditioned (or coerced) into assuming that nothing unreasonable ever happens. That seems like a completely flawed foundation to stand on.

    ---

    Notes:

    1. This post is inspired by the New York Times chart showing budget forecasts.
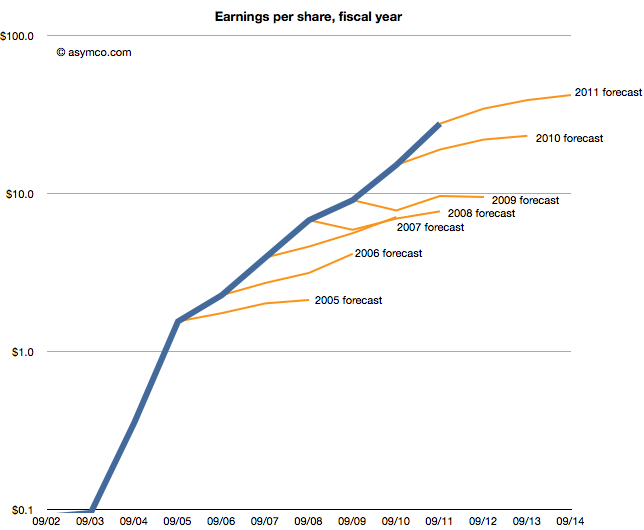
    2. The same data shown on a log scale: 
  7. Why Apple is cheap

    Research · 176 comments

    Imagine it's late 2005. Apple's fiscal year just ended and they reported their performance. You're an analyst whose job includes forecasting the company's performance for next year. This is a weighty responsibility.  Your forecast will be blended with those of your peers and used as a "consensus" average. That consensus for the next year will be used to measure the current value of the shares in a ratio called the forward PEG or Price/Earnings/annual earnings Growth. You are supplying the earnings and hence growth forecast while the market offers a price.  As a stock is meant to measure future earnings, your forecast is a crucial and frequently cited figure about whether a stock is priced fairly.

    There is some comfort in knowing that there will be many others who will offer such a forecast and your contribution is thus not the only way investors can calibrate the price. However, you should think hard about what you are predicting as it also will reflect your skill in predicting such a visible company.

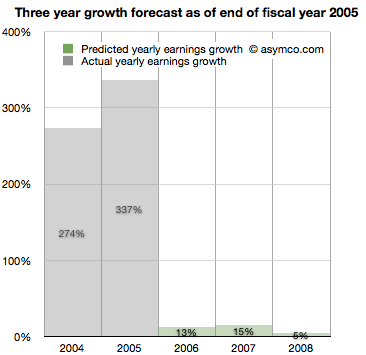
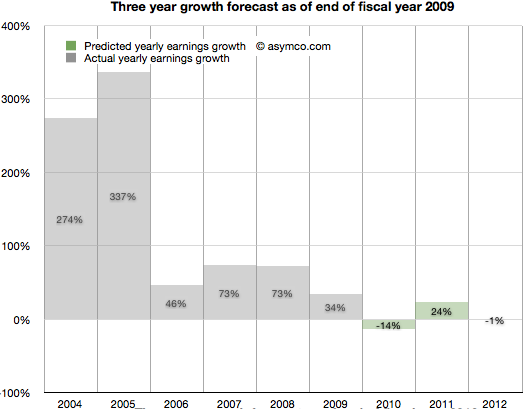
    Apple just had a tremendous two years. 2004 and 2005 saw EPS grow at 274% and 337%. This is largely due to the runaway hit iPod. Given all that is known about the company, what will you put forward? While you're at it can you also forecast two years forward, namely provide a growth forecast for 2006, 2007 and 2008?

    Here is what you and your cohorts publish as a consensus:

    You go with a 13% growth for 2006,  15% for 2007 and 5% for 2008. The chances are, you reason, that the iPod will not carry the company's growth much longer. The competition is sprouting all over and Microsoft is rumored to be launching its own music player.

    It makes sense to be conservative and offer a modest growth of 13%. At the same time you can rate the stock a buy as it is still growing. The stock just doubled in the last 12 months and the law of large numbers says that growth cannot last at the same rate as we've just seen.


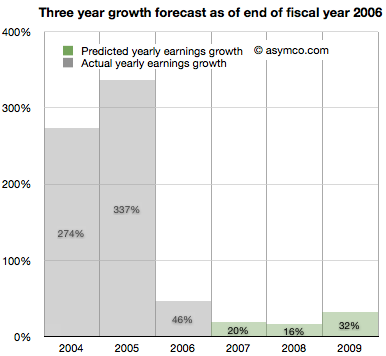
    It's now late 2006. Apple just closed out another big year. Contrary to your forecast last year, the company grew at a rate of 46%, more than three times faster than you expected.

    It turns out the iPod still has some legs and the company's Mac business seems to be growing. Looking forward you take your 15% growth for 2007 and increase it to 20% and suggest 16% for 2008 and 32% for 2009.

    There are rumors of Apple getting into the phone business.


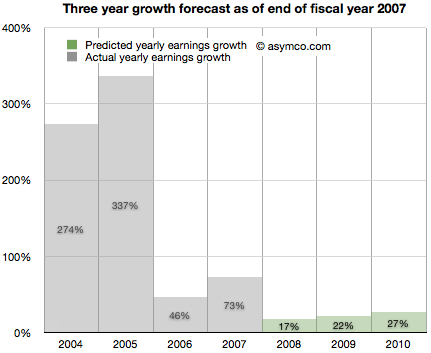
    It's now late 2007. Apple just launched the iPhone and even though it was available in limited numbers on one carrier for one full quarter, the company still turned in an amazing 73%. Again more than three times faster growth than you forecast. What do you do about 2008?

    It might make sense to increase the previous 16% estimate to 17% but since there is a real estate bubble brewing, the 32% growth for 2009 should come down to 22% and defer that growth out to 2010, dialing in 27%.

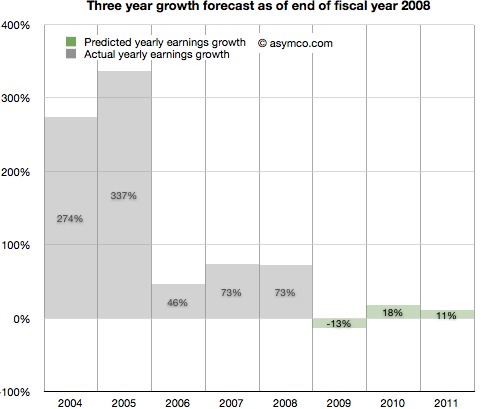
    It's now late 2008. Apple closed out another huge year. 73% growth was once again more than triple your forecast of 17% growth. It's clear that the iPhone is a huge hit.

    However, there is a credit crunch and talk of a huge recession, even depression looming. Apple is a luxury/premium brand and it is unlikely that those expensive products will sell well into these "macro headwinds". You predict a decline in the earnings of 13% in 2009, inline with many other tech stocks. You are optimistic however that 2010 will be a year of recovery and predict 18% increase from recession lows followed by a more reasonable 11% growth in 2011.

    It's now late 2009. To everyone's surprise, Apple grew through the credit crisis. It turned in 34% growth (vs. your predicted 13% decline). The success is hard to believe but the iPhone had a lot to do with that. There are new competitors coming and the recession has proven resilient. With unemployment still high you predict 2010 will still be a tough year. You go with -14% growth for 2010 and postpone recovery out to 2011 with 24% "bounce". Longer term you see 2012 as a flat year, with Apple earnings shrinking slightly by 1%.

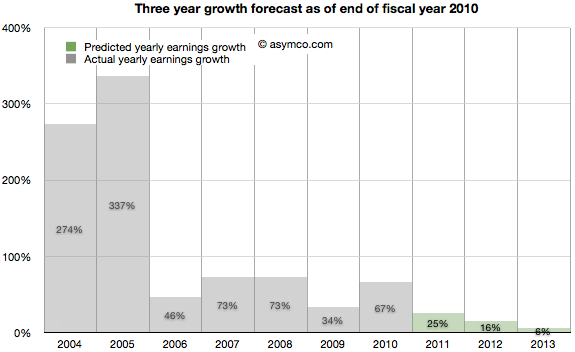
    2010 ends with Apple achieving 67% growth. Shocking relative to a -14% growth forecast. But then again, Apple launched the iPad and who could have thought that was a hit? Apple achieved growth throughout the recession and it looks like it might keep going. Your 2011 forecast of 24% looks weak so you increase it to 25%. The 2012 decline thesis is abandoned in favor of 16% growth and, given the likely competition in smartphones, you tone down growth in 2013 to 6%.

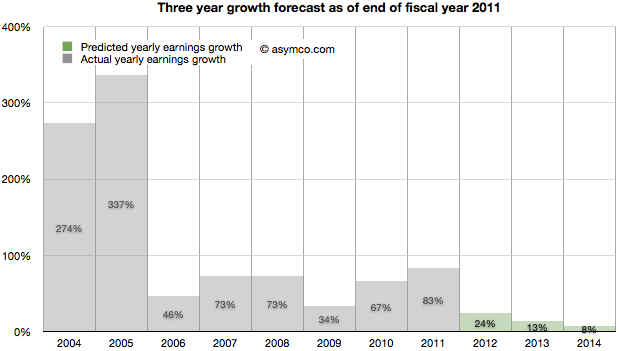
    It's November 2011. The company turned in 83% growth. It's  more than three times faster than your forecast. Some people are suggesting that Apple may have a lot of headroom with the iPhone and iPad but the law of large numbers is what it is. The company became the largest by market cap in the world and Android is gaining huge market share. However, in deference to their strong recent performance you increase the 2012 forecast from 16% growth to 24% growth. 2013 goes from 6% to more than double: 13% and 2014 is when growth begins to slacken, though still a healthy 8%.

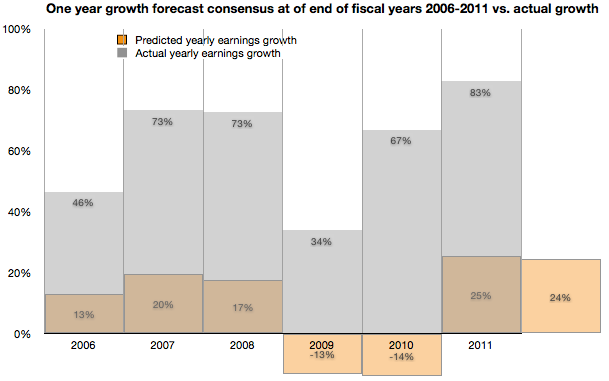
    As the following chart shows, look ahead one year accuracy has not been all that great, but you are at least consistent. In any case, everything you based your decisions on showed remarkable consistency with consensus. You're just reflecting common sense.

    Note:

    • Though the numbers are all real, the narrative is fictitious. I suspect however that the truth is actually stranger than this fiction.
  8. Global smartphone penetration nearing 10%

    Research · 43 comments

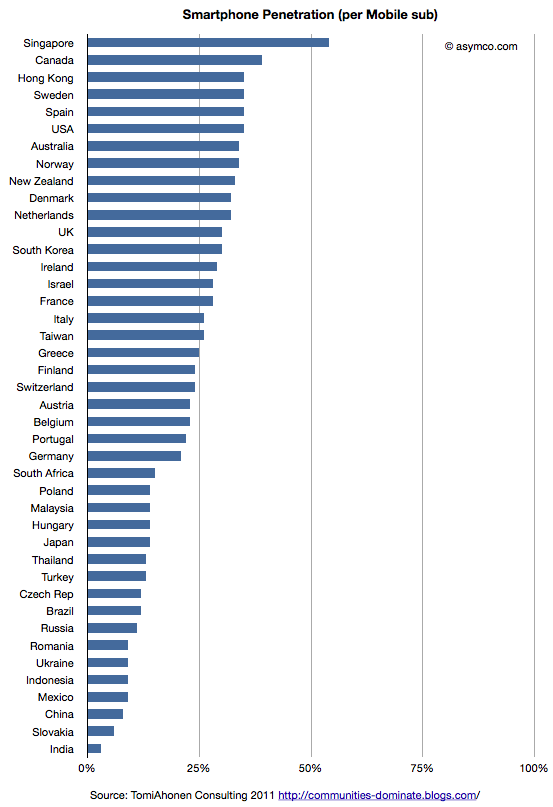
    Tomi Ahonen has compiled a fascinating data set on 42 major countries' smartphone penetration rates. The compilation is based on Netsize Guide, Informa, Google and Ipsos data. It is a complex sample with multiple possible sources of error (read the post for the caveats.) However, this is a breakthrough. It's the first time I've seen this level of detail at a country level in the public domain.

    I maintain visualizations of ITU data which shows overall mobile consumption and broadband consumption and penetration. In order to maintain a consistent basis of comparison, I prefer to use ITU's measure of consumption which is "subscriptions" rather than "population". The ITU derives this measure because mobile operators think of points of connection (subs) rather than people as the measure of consumption. This makes some sense because connections are what are monetized--not people.

    So the first piece of analysis is to show this measure of penetration (smartphones as a percent of subscriptions) for the 42 sampled countries.

    This view shows which countries "lead" adoption in terms of penetration. It shows that the US is quite high in the ranking and the most penetrated "large" country.

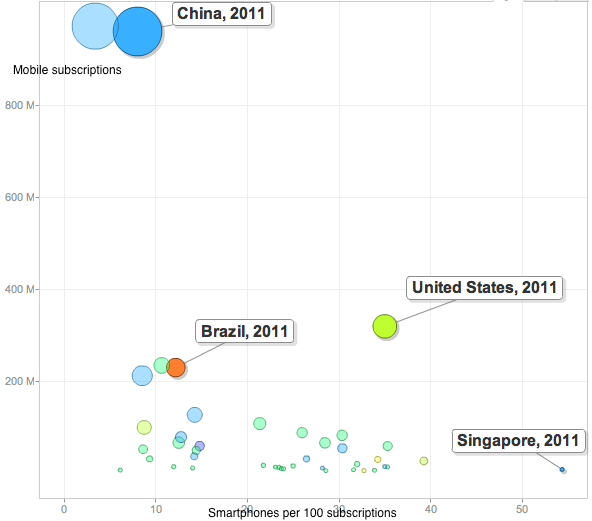
    This is highlighted by the following chart which shows penetration of smartphones vs. total subscriptions with bubble size representing population size.

    The US stands out from the inverse relationship between size of mobile population and smartphone penetration.

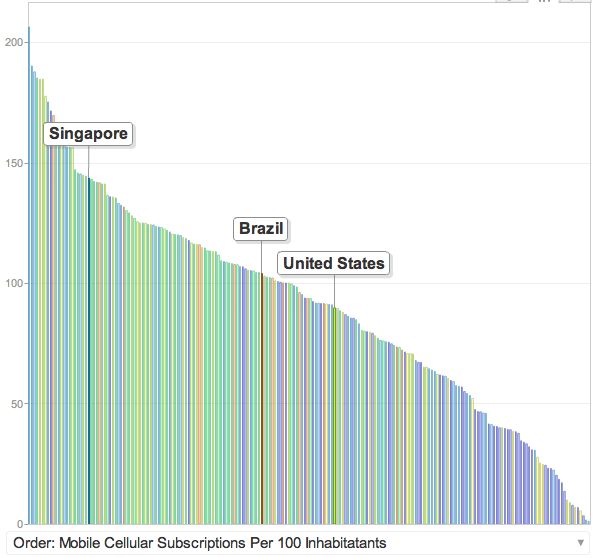
    Part of this is due to the US having relatively low mobile penetration in general. It's below the median because multiple mobile phone use is uncommon.

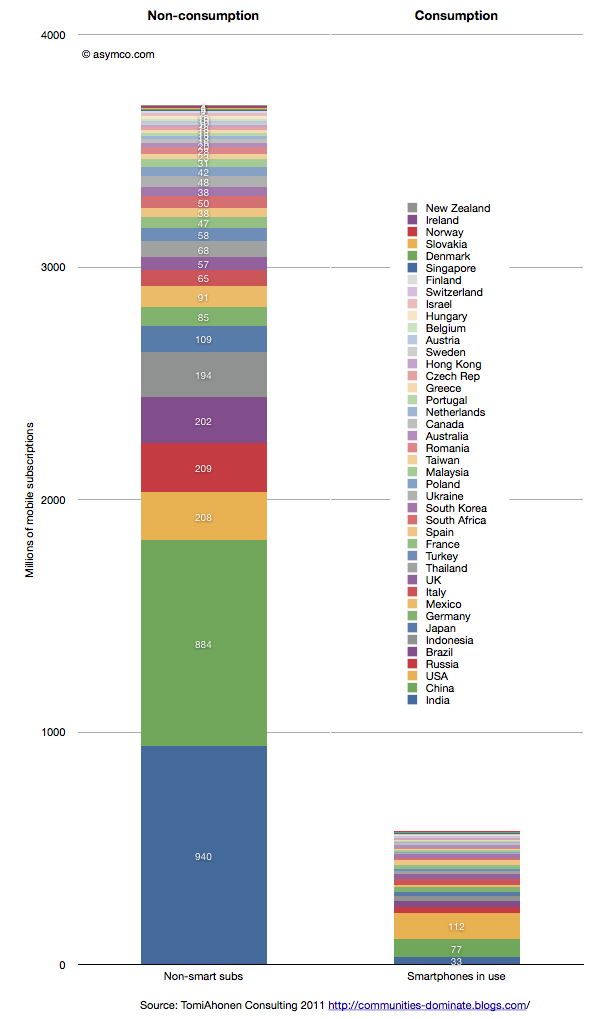
    But these bits of data are not the most interesting. In my opinion the following is:

    This last chart shows the total size of non-smart subscriptions vs. the total size of smartphones in use for the 42 countries listed in the legend.

    There are 3.7 billion non-smart connections and 0.6 billion smartphones in use. Although not all of these 3.7 billion connections need to be enabled with a smartphone, the fact remains that there are six times as many non-consuming network connections that can still be addressed.

    How and when this ocean of non-consumption will be converted to computing devices are the most obvious questions the data raises. Of the selected countries only 13.5% of the connections are "smart".

    ITU data shows that at the end of 2010 there were 5.4 billion global subs. This survey was conducted more recently so the total is likely much higher (perhaps around 6 billion). The survey thus covers about 72% of the world. That implies that at least 90% of the market remains unserved.

  9. Hiding in plain sight

    Research · 66 comments

    Guessing the next Apple product has become the parlor game of choice for a whole generation of technology journalists and analysts. The premise of the game is that given a track record of breakthrough products, there is always another one just around the corner. Being the one to predict this next breakthrough product creates credibility and demonstrates the domain knowledge of the predictor. If the prediction fails to materialize there is consolation in dismissing the actual announced product as disappointing, unsophisticated or, worst of all, uninteresting.

    Most often, these guesses are as much a reflection of the analyst as they are an analysis of the company. Too many predictions are designed to impress or demonstrate the imagination or knowledge of the predictor. They typically anticipate a giant leap of functionality, power or market re-structuring. They envision revolution not evolution; a cutting of the Gordian knot not a polishing of ugly rocks.

    Yet nearly all of Apple's launches have been sustaining improvements in existing products, technologies or platforms. To name just a few:

    • The iPad is an evolution of the iPod touch
    • The iPod touch is an evolution of the iPhone
    • The iPhone uses OS X and Objective C from the Mac
    • OS X came from NeXT
    • The app store market model came out of the iTunes store
    • The iTunes store came from iTunes which came first to the Mac as a media sync tool for the iPod
    • etc.

    John Gruber explained the process last spring as it relates to many of Apple's launches. Although the iPhone did introduce a new user input method and experience that takes consumption in a new direction, its building blocks were there for all to see for many years. The iPhone is a natural evolution of the computer with a handy little "Phone" app.

    Likewise, the iPod came seemingly out of nowhere but by watching the original launch you see it as part of a "media hub" strategy that envisions the Mac as a personal server. The very products which ended up disrupting the Mac/PC began as extensions of their victims.

    You can trace the DNA of almost all of Apple's products to previous products. If Apple did not have these foundations, the slow-motion revolutions would not have happened. Rather than a deliberate big bang, Apple's disruptions are the result of a discovery process. A test, iterate and improve loop. This is why they seem obvious after the launch but also why they seem to be such an anti-climax.

    Therefore, the challenge of predicting Apple's next product should be tackled not only through an act of imagination but by carefully projecting the current products and understanding where they can evolve.

    So it is that I approach the question of Apple's TV disruption. My working assumption about the next Apple TV is that it already exists. It's none other than the existing Apple TV, improved.

    Here are the clues or hints I noted:

    • It uses iOS and the hardware from the devices that run it. It originally ran a PC architecture and shared a kernel with Macs.
    • It has been integrated with iTunes media stores (with the notable exception of the iTunes app store)
    • It has begun to introduce channels other than downloads (ESPN, Wall Street Journal) thus establishing its own distribution for traditional content
    • It is a global product, depending only on the Internet protocols and independent of the balkanized cable standards
    • Through AirPlay it is integrated with Macs and Apple devices.
    • Through display mirroring, iOS devices can use the TV as an external monitor and can even change their own behavior when doing so

    This last point is intriguing. I have not seen discussion of this feature, but if using an iPad 2 or iPhone 4S with iOS 5 and an Apple TV with the latest software updates it's possible to have an iOS device become a controller for TV-based game experiences. Developers are already using the API. When using a pinball game with screen mirroring, the device becomes a controller while the action takes place on the big screen. Switching display mirroring off bring the action and control back onto the small screen. There are still problems with lag and the processors are over-taxed on high frame rates, but the APIs are already there for developers. (I could also mention the potential of new a Bluetooth standard for better wireless response).

    What these signals point to is Apple defining the TV as an iOS portfolio product. This means integration with iTunes, including an app store. This, in turn, means unleashing developer/creative talent through new monetization opportunities. This means new user experiences in discovery. This means FaceTime-like communication through the TV. This means many other things but mostly it means that the TV will be a platform product.

    The only challenge is a (currently lacking) smooth interface. Perhaps that's where voice comes into the picture. But whether that is built-in at the next rev of the product or not is not the story. The story is going to be the sustaining improvement in the original Apple TV. A wonderfully asymmetric product begging to be ignored. A product that because of its apparent lack of success, effectively hides all its secrets in plain sight.

  10. How productive is an Apple store employee?

    Research · 75 comments

    Apple publishes data about its "retail segment" which ifoAppleStore.com catalogs. Here are some statistics I was able to compute from the data:

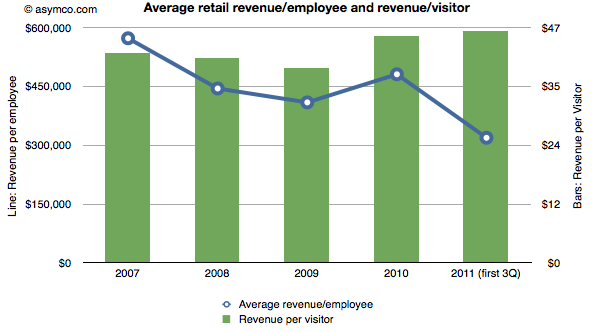
    • The stores generate over $100k per employee per quarter. In 2010, revenue was $481,000 per employee. This year the average is around $320k excluding the fourth quarter. In 2009 the average revenue for the technology sector was $388k/yr. A retailer like JC Penney generates about $124k of revenue per year per employee.
    • The revenue per visit is around $45. There are well over 250 million visits per year (222 million for first three quarters of 2011).

    The combination of these two metrics are shown in the following chart:

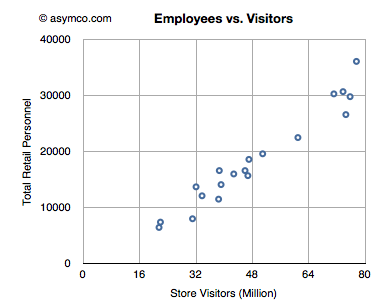
    • The number of employees has grown in proportion to the number of visits. There is one employee for every 2,500 visits/quarter. The following chart shows the relationship between retail personnel and store visitors on a quarterly basis.
    • Assuming an employee works for 360 hours per quarter, the average employee sees 6 visitors per hour or one every 10 minutes.
    • As that visitor generates more than $45 of revenue, an Apple store employee creates sales at the rate of about $278/hour.


  11. Will Windows Phone get to compete with non-consumption?

    Research · 45 comments

    Before diving into the answer to the question in the title, there is some new data to digest.

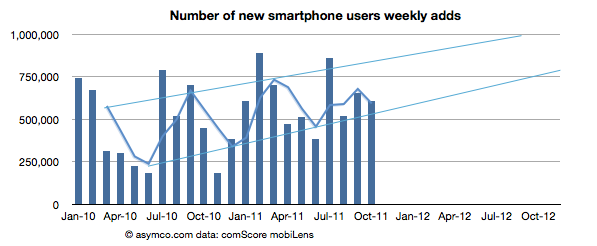
    The latest from comScore shows consistency with the previous months of smartphone growth in the US.

    • The growth rate was 607k/wk new-to-smartphone users. This is slightly down from 654k/wk for the previous month but up significantly from 450k/wk the year before.
    • The penetration of smartphones reached 38.5% (non-smartphones are at 62%)
    • The penetration should reach 50% before September 2012 with about 1.2% being converted every month.

    The following chart shows the weekly add rate with a three-period moving average:

    This chart is important in that it should first show signs of inflection in growth. That does not seem to be happening yet.

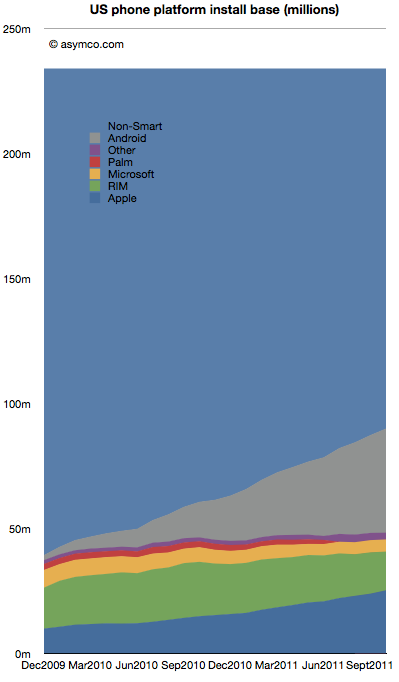
    The installed base by platforms is shown below:

    Android is estimated to have grown to 41.7 million users in the US, adding 2.5 million users in the last month. Android is adding half of Microsoft's entire US mobile base every month.

    RIM BlackBerry lost one million users in October. RIM's slide has accelerated again with over 3.7 million leaving the platform in the last six month. With 15.5 million subscribers, RIM has fewer users in the US today than it did in late 2009.

    iPhone gained 1.34 million. Installed share increased slightly to 28% from 27.4% the previous month. There are now over 25 million iPhone users (above age 13) in the US.

    Windows Mobile/Phone had no perceptible change (-34k) indicating perhaps that the losses in Windows Mobile are being erased by gains in Windows Phone. Microsoft's platform stopped losing significant users six months ago. Whereas the bleeding has been stopped, overall number of users remains at a rather poor 5 million or 5.4% share.

    "Other" which includes Symbian and WebOS lost another 184k users to reach only 2.7 million users.

    There are still 144 million smartphone non-consumers.

    Android and iPhone now make up nearly three quarters of all smartphone ownership in the US. That's a total of 67 million users. With no sign of slowing, the chances are that there are at least 100 million users still remaining to convert. Sounds like an attractive target. But that target is shrinking fast. The rates of adoption signal saturation of most likely buyers will happen toward the end of next year.

    At least 25 million new Android users will be gained and at least 10 million new iPhone users will be created in the next 12 months. That's 35% of remaining non-consumption. Assuming some acceleration, it's not hard to see 50% being claimed by the two entrenched incumbents.

    This leads to an interesting positioning question. Is Windows Phone destined to compete with consumption or non-consumption? If traction is not forthcoming in the next 12 months, that leaves a very difficult last 50 million available as non-consumers. They are more difficult as they will be late adopters and perhaps more price sensitive and less motivated by features.

    Windows Phone still has quite a bit of opportunity outside the US, but in the US (and in Europe which is not much different) the competition will increasingly be with rival incumbencies not with non-consumption. As the custodians of the Windows franchise, Microsoft should be well aware of the inherent difficulties with competing with installed platforms.