Asymco

Asymmetric Intelligence

Market

  1. App developers receive $12 for each iOS device sold

    Research · 38 comments

    One of the more interesting numbers reported by Tim Cook during the last earnings conference call was the total payment to developers during the fourth quarter. This is the first time that Apple reported a quarterly payout to developers.

    The figure was $700 million and it was mentioned in reference to the total payments to date of $4 billion. The $700 million is interesting at least because it gives an idea of what Apple obtained in total sales of Apps. As it retains 30% and pays 70% to developers then it follows that it retained $300 million and the total "gross" sales was $1 billion in Q4.[1]

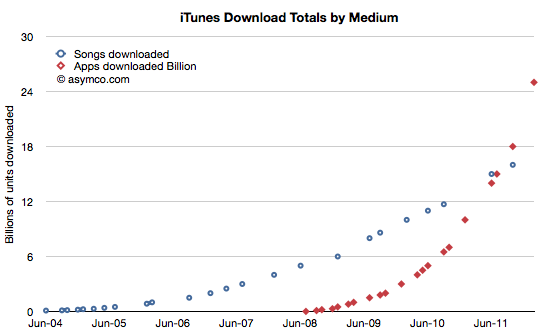
    The $700 million is interesting for another reason. The $1 billion in gross income can be tested against another set of data. As the countdown has already started, sometime in February Apple will report 25 billion total apps downloaded. The last such milestone was October 4th when it reported 18 billion downloads. Assuming that they will cross 25 billion by February 25th, then we can obtain an estimate for the download rate per day: about 48.6 million apps/day.

    That is a figure we can plot historically:
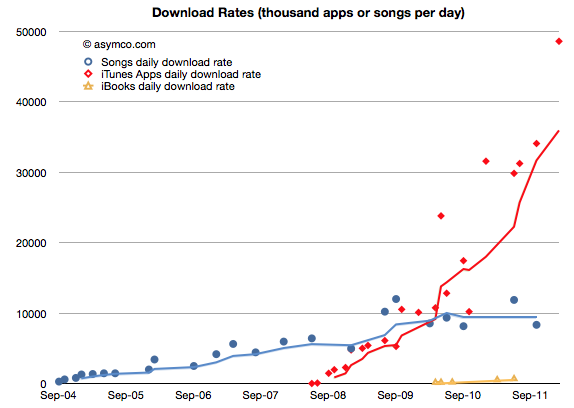
    I plotted it in relation to the songs download rates obtained through a similar method. Although we don't have an update on total songs downloaded, the rate is unlikely to have accelerated as much as apps did. The following charts also shows the reported total downloads by media:
    Normalizing to the same starting date, the two media ramps are shown below:
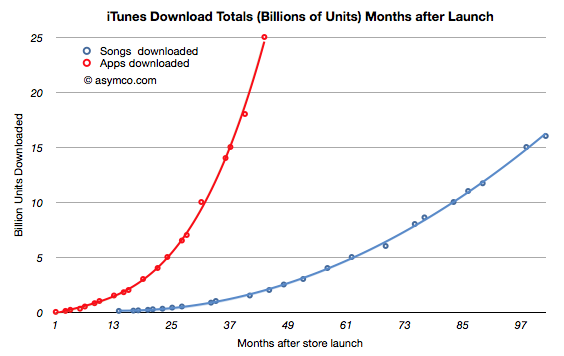
    But back to the figure of $700 million paid to developers and the implied $1 billion in gross revenues. Taking that figure and dividing it by duration of the quarter yields a figure of $310 million per month gross app revenues. The 25 billion downloads to date paired with the $4 billion in payments to developers gives us an approximate revenue per download of 23c. Computing the monthly revenue from the 48.6 million/month rate we get about $316 million per month. Pretty close to the $301/mo that the quarterly payout implies. This therefore also confirms the 23c per download (it looks a bit high but not by much.)

    So the $700 million payout and the $4 billion payout to date and the 25 billion downloads all fit together as consistent pieces of a puzzle that give insight into the iTunes economy.

    1. Apple reported nearly $7 billion in iTunes stores revenue (though the apps were only counted for the 30% agency fee.) during 2011.
    2. If gross revenues were measured, the iTunes economy was about $10 billion in 2011.
    3. Payments to content publishers were in the vicinity of $7 billion of which $2.1bn was paid to developers.
    4. Operating costs for iTunes were therefore approximately $3 billion/yr.

    One other interesting result: Since iOS devices started shipping, there have been over 335 million units sold. As 25 billion apps have been downloaded into them then about 75 apps were downloaded for each unit sold. Since we know the average price (23c) and the payout ratio (70%) then all this boils down to the fact that each iOS device generates $17 of iTunes income from Apps alone. That also means that each iOS device sold results in a minimum payment of $12 to iOS developers.

    I've noted that Apple should be valued as a recurring payment from a satisfied customer base. A contributor made a comment that summarized it well: the payment schedule is approximately $1/day per computing unit (device or computer or tablet).

    Now it becomes clear that Apple should also be seen as a recurring ecosystem payment system. Given a 24 month lifecycle, the amount is approximately $0.5 per device per month.

    In other words, if you are an iOS developer you should note iOS device sales and use the rule of thumb that each one sold creates fifty cents of monthly income for you and your peers to share.

    ----

    Note:

    1. Apple reported its iTunes income (as the anachronistic "Music" line item in its Income Statement) as $2.027 billion in Q4.It would be tempting then to think that Apple got $1 billion from apps and $1 billion from songs and videos and iBooks. This is not the case however.
      Apple does not report all its app income (what I call gross income). Under the "agency" model of retail sales it reports only the part it retains, keeping the 70% paid to developers off its books. Therefore, of the $2 billion in iTunes income, only $300 million were actually booked from apps. That therefore implies that Apple's "everything-but-apps" iTunes revenue was $1.7 billion.
      Note however that the non-app income is mostly gross income and the payouts on that income will be significant (as much as 90% depending on many factors).
  2. The iPhone opportunity: a visual update

    Research · 60 comments

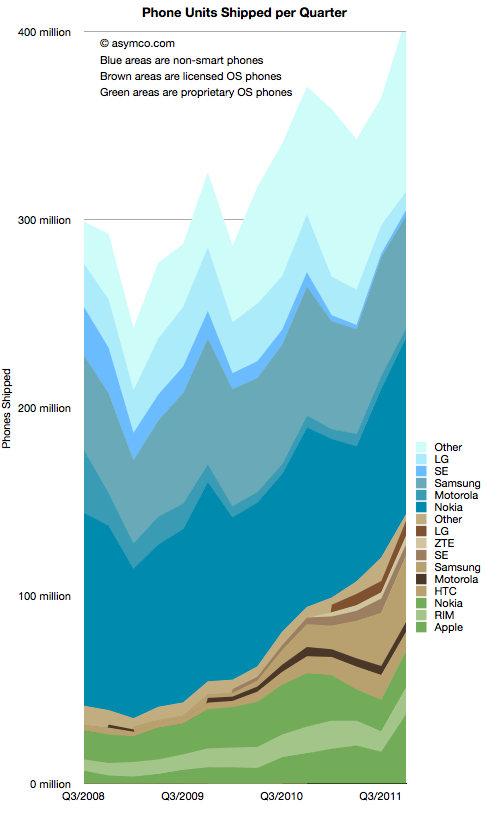
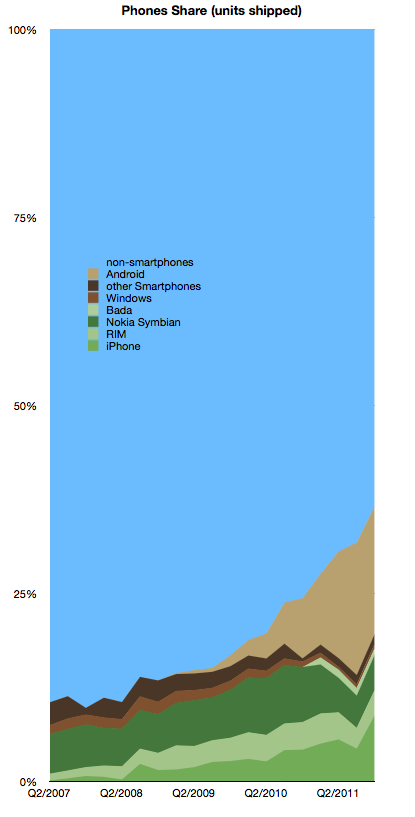
    In yesterday's talk Tim Cook described the opportunity he felt Apple faced. To readers of this blog this opportunity has been regularly illustrated, at least on a quarterly basis.  Here is the iPhone opportunity relative to other platforms:

    In absolute units by vendor, separated by smart and non-smart phones, the data looks like this:

    The pattern of smartphone growth remains consistent even though there was a temporary dip in Q3 for the iPhone (and hence for the green-shaded proprietary OS phones.)

  3. Tim Cook on the "Law of Large Numbers"

    Research · 68 comments

    Q: 37 million units of iPhones shipped. When do we run into the Law of Large Numbers? What are the growth opportunities coming up?

    A: 37 million is a big number. It was a decent quarter. It was 37 million -- more than we'd ever done before. We were pretty happy with that, but let me give you the way I look at the numbers. As I see it, that 37 million for last quarter represented 24% of the smartphone market. There's 3 out of 4 people buying something else. 9 out of 10 phone buyers are buying something else.

    Handset market is projected to go from 1.5 to 2 billion units. Take it in the context of these numbers, the truth is that this is a jaw-dropping industry with enormous opportunity. Up against those numbers, the numbers don't seem so large anymore. What seems so large to me is the opportunity.

    What we're focusing on is the same thing we've always focused on. Making the world's best products.

    We think if we stay laser-focused on that, and continue to develop the ecosystem around the iPhone, that we have a pretty good opportunity to take advantage of this enormous market.

    Q: The biggest opportunity is the emerging markets. Large portion of that is the prepaid market. Apple has done very well but the wholesale iPhone price point is nowhere near what we would expect in the prepaid market. How do you make it more affordable to those markets?

    A: Those markets are critical. The smartphone market is projected to be 1 billion units in 2015, 3 years from now. 25% of that is projected to come from China and Brazil. Just two of those markets -- 25% -- obviously those are very critical markets, but there are others as well.

    We've been very focused on China. We've had incredible success with iPhone -- we've gone from a few hundred million in revenue to last year with $13 billion. We've been really focused on trying to understand the market there and taking those learnings to other markets. As it turns out, not very many people agree with me on this, probably.

    What I see is that there is a lot of commonality in what people around the world want. Everyone in every country wants the best product as it turns out. They're not looking for a cheap version of the best product -- they're looking for the best product.

    In the emerging markets there are very big differences in go-to-market. In most of the developed market, the carrier owns most of the distribution. In emerging markets, the retailer has most of the distribution. The whole go-to-market has to be changed significantly. Last year, we covered price points in the subsidized markets from $0 on up. That doesn't translate to zero in the prepaid market, but we're covering more price points there.

    The paramount thing is the product. It is the focus. Of course distribution, we've recognized the difference there and in purchasing power. Unlike many people, I don't subscribe to the premise that prepay is prepay is prepay. We convinced China Unicom to try to postpay. It wasn't big there but they tried it and it's working really well. It's great for everyone because customer gets cheaper phone and carrier locks in a customer. It's a different way to look at the issue and it's been successful in China.

    When Apple introduced the iPod in 2001, when we launched the iTunes Music Store and launched that on Windows, the iPod created a halo for the Mac. For 23 straight quarters we've outgrown the market on the Mac.

    The halo that was created by iPod for the Mac, was created in developed markets. It was created in the US, Western Europe, Japan, Australia, Canada. It didn't work nearly to the same level in Eastern Europe, Middle East, Africa, China, Latin America. People were already getting music from their phones. The world changed for us when the iPhone was launched.

    The iPhone introduced Apple to millions of people -- our brand -- to people who had never met Apple before. Now, it's interesting to look -- take China as an example -- last year the Macintosh grew more than 100% in China, year-over-year. Not on a big base, but 100% is pretty good. The market grew 10%, so we outgrew the market 10x.

    The iPhone is creating a halo for the Macintosh. iPhone has also created a halo for iPad. You can definitely see the synergistic effect of these products, not only in developed markets, but also in emerging markets where Apple wasn't resonant for most of its life.

    Via: Apple CEO Tim Cook Speaks at Goldman Sachs Technology Conference - Mac Rumors

  4. Apple retail growth data

    Research · 15 comments

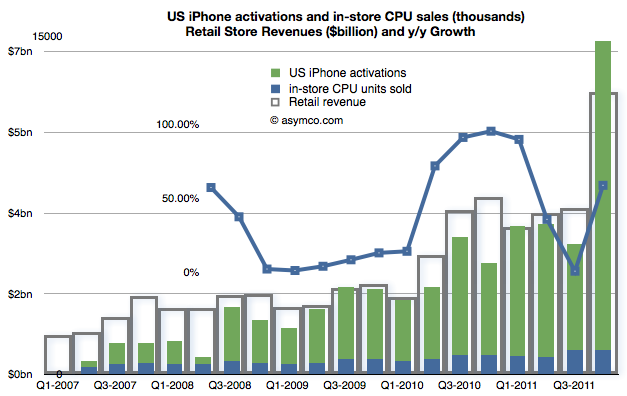
    Apple's retail stores increased sales by nearly 60% in Q4. This is a dramatic though not unprecedented change from Q3's 1% growth rate. The growth rate faithfully tracks iPhone releases as demonstrated in a post last quarter.

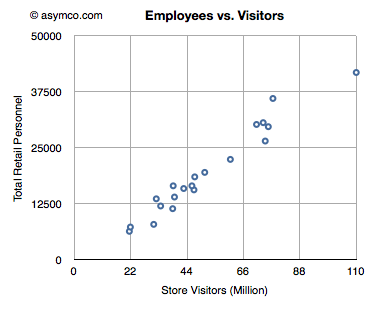
    When seen on a yearly basis some of the data begin to from a picture.

    • There were 332 million visitors in 2011, an increase of 29%. (This total is greater than the population of the United States.)
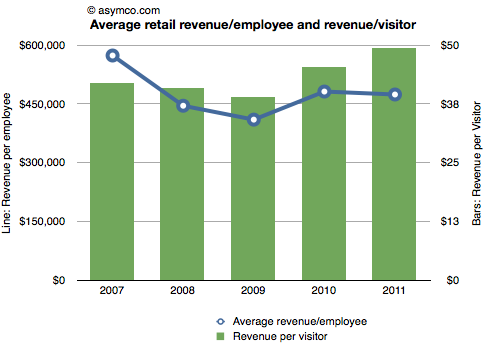
    • The average  revenue was nearly $50 million/store
    • 38 stores were opened, in-line with 2010's 40 openings
    • Total 2011 revenues were $16.4 billion
    • About 34,600 (full time equivalent) employees were employed on average
    • There were nearly 1 million visitors per store
    • There were an average of 100 employees assigned to each store
    • Average revenue/employee was $473,622
    • Average profit/employee was $120,289
    • There were about 9,600 visitors for each employee
    • Each visitor generated about $50 in revenue
    • The revenue per square foot was about $6,500 across all stores.

    Some of these metrics are shown in the following charts relative to prior years:

  5. The US temporarily regains relevance for Apple's iPhone

    Research · 16 comments

    Sprint reported its first iPhone quarter sales at 1.8 million. You may recall my analysis of Sprint's "gamble" where I estimated that Sprint will easily sell the 31 million iPhone which they committed to buy from Apple. I had estimated that they could sell an average of 7 million units a year but perhaps conservatively they could ramp at 4, 6, 9 and 12 over the four year period rumored to be in the contract.

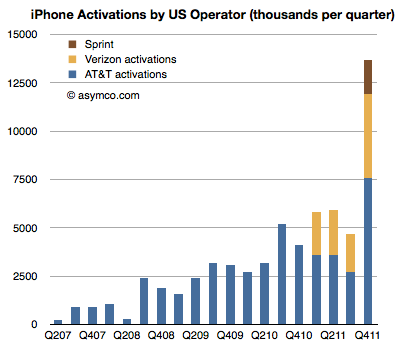
    Given the pent-up demand I also estimated that the first quarter could reach 2 million units. They managed 1.8 and that's a solid start. Overall the US carriers activated 13.7 million iPhones. Here are the iPhone activations by US Operator:

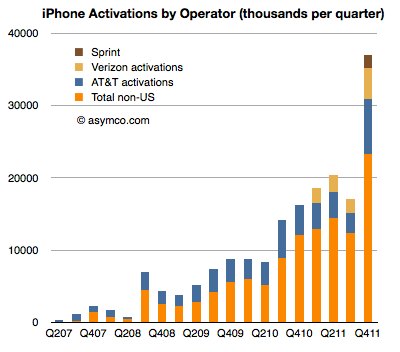
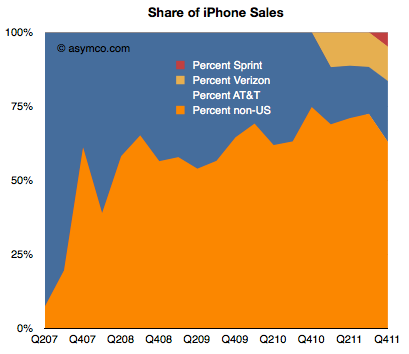
    That's 37% of the total market in Q4, shown in area and bar charts below:


    Note that the percent of total activations outside the US has dropped but that is due to the limited distribution of the iPhone 4S outside the US in the launch quarter. The long-term trend is for the US to decrease as a percent of total iPhones even with the additional US distribution.

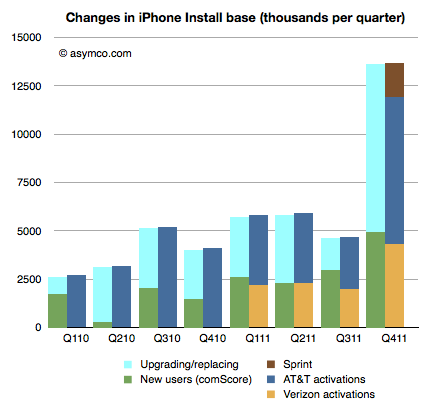
    By comparing the net adds to US install base from comScore survey data, we can estimate that about 63% of US purchases of iPhones were replacements and that 8.7 million iPhones were put out of use in the US last quarter.

  6. Third

    Research · 33 comments

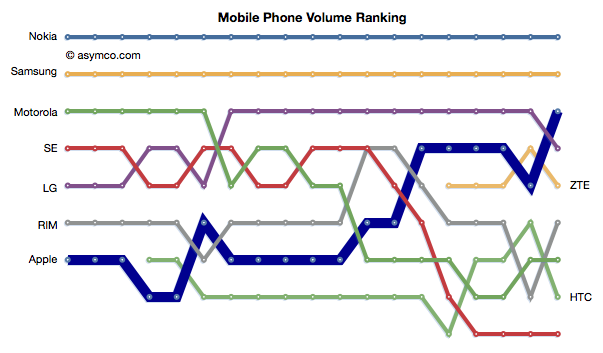
    Apple reached the third place rank in total units shipped during last quarter. The following chart shows the ascent in rank.

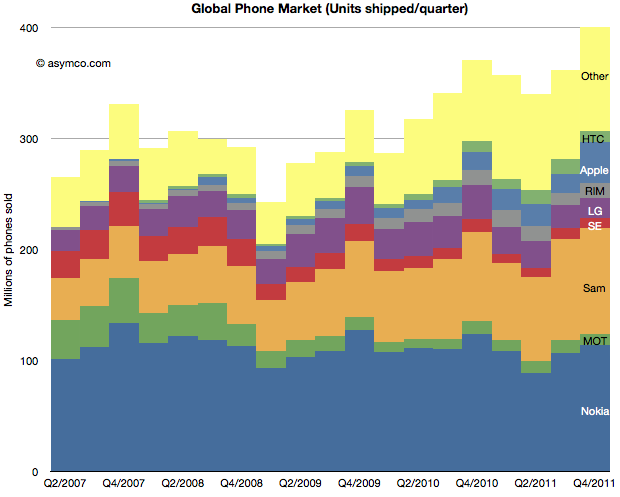
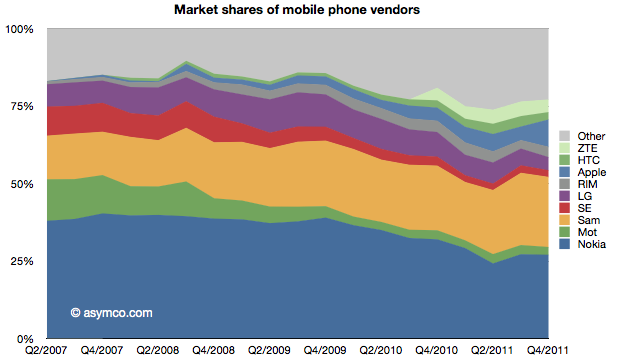
    Apple achieved this with a total market share of about 9%. Second place Samsung has 22.6% so there is significantly more room to go before Apple gets to be second. Nevertheless, the climb to third was achieved in less than five years. At the time when Apple entered the market third place was held by Motorola with shipments of 35.5 million units (Q2 2007). Motorola only managed 10.5 million in the last quarter.

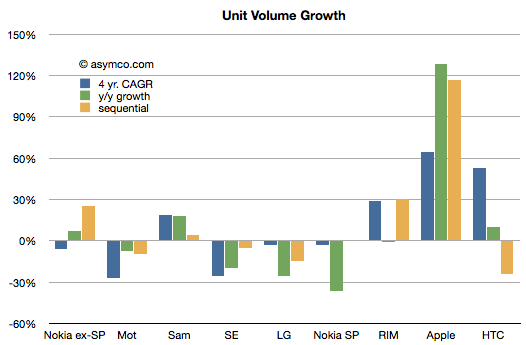
    To see growth I prepared the following chart showing the fourth quarter's growth by vendor according to four years' compounded, sequential and y/y growth.[1]

    On a four year compounded basis, the pattern is that of Apple, HTC and RIM showing significant growth with Samsung showing moderate growth. The other vendors all had negative real volume growth. The list does not include "Others" which had 13% compounded growth.

    Projecting Apple's 60% rate of growth and a market growth of 10% leads to Apple obtaining 27% share by the end of 2014. My guess would be that is when we'll be able to write a post about Apple being second.

    ---

    Notes:

    1. I don't have HTC data for Q4 2007 so the compounded rate is measured for three years.
    2. Additional volume data
  7. The year of the iPad for the second year in a row

    Research · 57 comments

    The iPad and Mac businesses both grew well in the last quarter. Tim Cook said they are observing some cannibalization of Mac from the iPad but much more switching to iPad is coming from the Windows PC market.

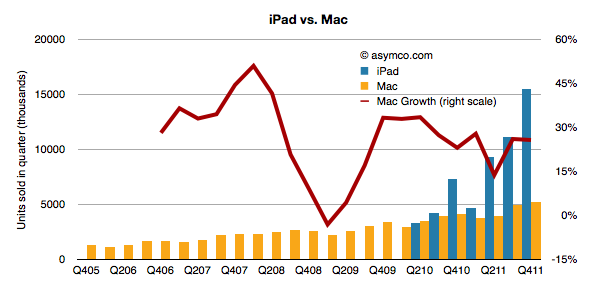
    The evidence is still hard to pin down directly but the fact that PC sales (excluding the Mac) are down gives credence to the claim. Mac growth, in contrast, is largely unaffected. The following chart shows the the iPad volumes vis-a-vis Mac volumes and the Mac growth through recent history.

    The iPad has out-sold the Mac since inception and is now about three times the volume. However, the growth rate in the Mac has not changed much.

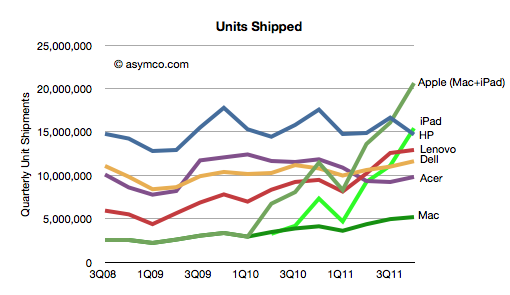
    The impact on the PC market has been discussed recently and the data in the following chart is an update given more precision on the units from Apple:

    The new data shows that the iPad alone would be the largest PC vendor and Apple with iPad and Mac combined is selling 5 million more units (or 30%) than the top PC vendor.

    The impact of the iPad is not specific to any single vendor (Apple included). It competes for time and purchase decisions across all computing alternatives and though many times it's additive, it is also substitutive and will become increasingly so.

    Tim Cook mentioned on the earnings conference call that Apple sees the iPad as addressing a market larger that the PC market:

    I truly believe, and many others in the company believe, that there will come a day that the tablet market in units is larger than the PC market. In fact, it's interesting to note that in the U.S., it's clear from the IDC's recent data on desktop PCs in the U.S., that tablets exceeded desktop PC sales last quarter in the U.S.


  8. Is the iPad a PC?

    Research · 114 comments

    Gartner published its estimates for "PC" shipments during the fourth quarter. As I've done in the past, I combined their estimates with known shipments from Apple and separated Apple's performance from the Windows-based market.

    I also take into consideration the iPad as a potential competitor for computing purchases. Apple will report fourth quarter results including Mac and iPad shipments in less than two weeks but I am using my own estimates until then.

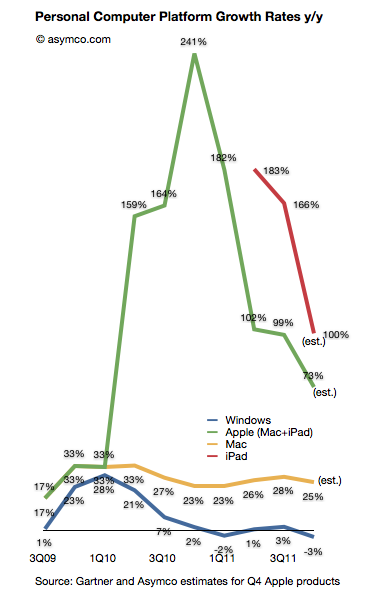
    Here is how the platforms grew over the last few quarters (all figures are global):

    The Gartner data implies a 3% decline in the size of the Windows PC market during the last quarter. This is the fourth quarter of disappointing Windows performance. If you observe the pattern for the Mac vis-a-vis  Windows there is a similarity in the overall cycle but a divergence in terms of growth. The "spread" between Windows and Mac OS X is increasing and has reached an all-time high of 28 points.

    But the more interesting story is that the decline in Windows seems to be coincident with the growth in the iPad. The green (Mac + iPad) shows the effect of the new category while the red line (iPad only) shows that growth in isolation (year-on-year).

    Coincidence?

    Ever since the iPad launched the hypothesis that it has an impact on PC has been hanging in the air. Most analysts (including Gartner) argued that there was no effect from iPad and that the problems with Windows were all due to one-time circumstances. We hear the same about the last quarter with floods in Thailand being blamed.

    However, in the latest quarter Gartner began suggesting that "consumers' attention was diverted toward other product categories, especially smartphones and media tablets."

    One wonders if these "media tablets" are not PCs and yet they negatively affect the purchase of PCs whether they are indeed competing with PCs.

  9. Enter, Prise

    Research · 80 comments

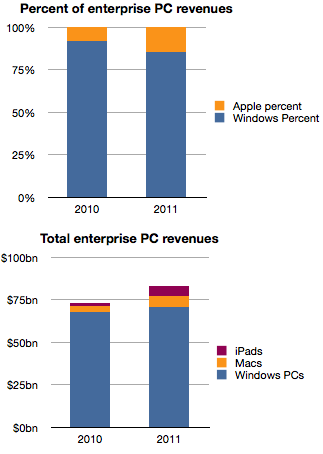
    Historically, Apple's sales to business and government buyers of personal computers have been, in a word, minuscule. To put a number on it, Forrester published data where the estimated value of those sales in 2007 were 2.8%. A figure lower than Apple's overall market share of PCs in that time frame.

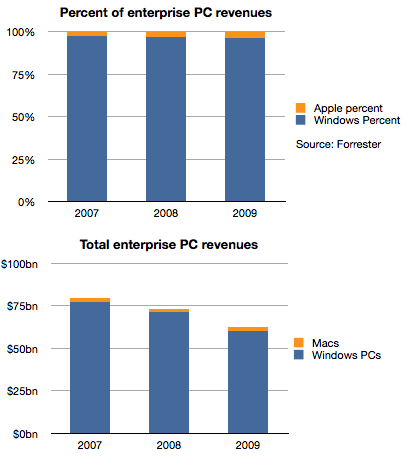
    Things did not improve much in the years following. The following chart shows the split between Windows and Mac OS X for the value of enterprise computers sold in 2007 through 2009.

    Apple's share of value went from 2.8% to 3.7%, an increase of 1 point of share, but one which in real terms was not very valuable because the overall market declined due to recession. Revenues for Apple were basically flat at around $2 billion each year as shown in the second chart.

    However, the situation changed very rapidly in the last two years.

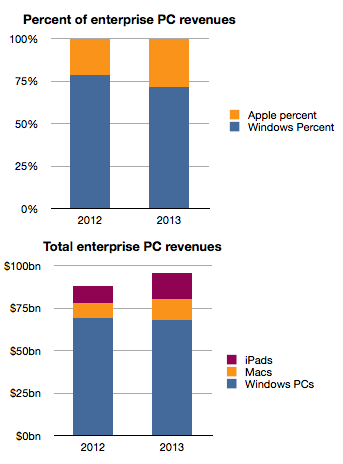
    Apple's share of enterprise revenues doubled from 3.7% to 7.8% in 2010 and nearly doubled again to 14.6% last year. A large part of that acceleration was due to the iPad which generated an estimated 6 billion in sales in 2011, triple what Macs were grossing in 2007.

    Forrester goes further and estimates the same data for the next two years.

    The estimate seems to be an extrapolation of the last two years which may or may not happen and we should treat it with caution.

    However, if the pattern emerges as an extension of the near past, Apple's position in the market at nearly 30% share next year would be a sea change. It may challenge for the top spot among all vendors to the sector.

    It's been said many times that "if only Apple put more emphasis" on Enterprise sales, imagine how much more growth they would obtain. However, I believe that this reversal of fortune did not come about from paying more attention but rather from paying less attention to Enterprise.

    Enterprise buyers are demanding customers. They have highly specific requirements and ask vendors to conform to multiple layers of dependencies. As a result, enterprise vendors (led by Microsoft) have done all they could to make their software and hardware conformable to these needs. For decades this was the modus operandi and, due to the early adopter nature of businesses in personal computing, the resulting product was passed on to consumers as the "standard". Consumers accepted it as it was better than having no computers at all.

    The problem is that customers, especially demanding ones, don't realize that a new basis of performance might be more beneficial. Apple and mobile devices in general presented this "low-end" alternative not in response to requirements from business but in response to requirements from consumers who had been much more eager in the last decade to adopt new technologies with fewer strings attached. All the security, conformability and legacy issues of the early business adopters turned them into late adopters as technology shifted.

    So a company focused on an asymmetric market led with new solutions to problems that enterprises did not think they had. Mobility was something few IT managers asked for and was granted begrudgingly to only those "most valuable" who needed it due to cost and security considerations. As Apple willfully ignored these Enterprise needs it, paradoxically, created exactly what they needed.

    It pried entry into the most difficult of markets by not even wanting to enter.

    In thinking about how this market will evolve, I hear about "consumerization" and cost reduction as benefits and justification of this shift. But fundamentally, what is happening is a classic low end disruption. Enterprises increased their demands beyond what the users in those enterprises could absorb. Instead of ultra-secure, locked-down and immobile computing, users were looking for flexibility, agility and mobility. That's what Apple was listening to.

    Apple's best strategy today would be to persist on this trajectory and listen to the under-served consumer rather than the over-served and over-demanding IT manager.

  10. Estimating iPhone sales in the US during Q4

    Research · 53 comments

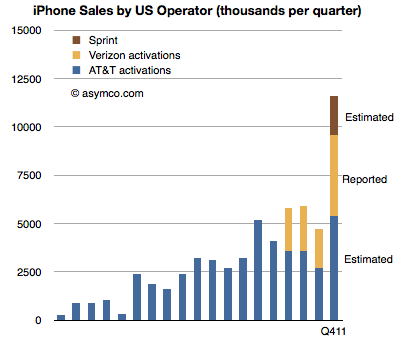
    Verizon has been the first source of data on iPhone sales for Q4. They reported 4.2 million iPhones sold. The first quarter of Verizon iPhone sales had 2.2 million units, followed 2.3 million in Q2 and 2 million in Q3. The total for the calendar year came at 10.7 million.

    The total for AT&T during the first three quarters has been 9.9 million. If we assume the same 2x sequential increase in Q4 relative to Q3 as observed by Verizon we obtain an estimate of 5.4 million iPhone for AT&T.[1]

    The quarter also saw the addition of Sprint to the US iPhone distribution network. Sprint is rumored to have committed to buy 30.5 million iPhones over the next four years. My estimate for the first year was 7 million, placing first quarter sell-in at about 2 million.

    An approximate total for Q4 US iPhone activations results in 11.6 million. The following chart illustrates these estimates:

    Notes:

    1. AT&T reported that smartphone sales during October and November totaled over 6 million units. Assuming only 2 million for December and a 70% iPhone mix yields 5.6 million units.
  11. Apple's commoditization discount

    Research · 80 comments

    When asked where Apple's growth will come from, most analysts or observers will cite new products. As long as there are new products, then there is growth. Conversely, if there are no new products, then there will be no growth. This is such a commonly held belief that it's axiomatic: Apple is being valued based on short-term foreseeable growth.

    To be more precise, analysts value the wave of growth of every new product and heavily discount the post-growth phase assuming commoditization. There is no value assigned to Apple for extending market reach to the mass market.

    Consider: Analysts currently forecast an operating income (or EBIT) of $43.3bn for 2012 and $49.7bn for 2013. That implies growth of 28% in 2012 and 15% in 2013. These growth rates are modest in light of Apple's recent historic growth and especially 84% in 2011 on EBIT level. Much of this growth has been due to iPhone which quickly captured 4% market share in four years. To suggest 15% growth in 2013 is to suggest that Apple will not increase its phone market share by an appreciable amount. The implicit assumption in that growth figure alone is that Apple will remain a niche player.

    Bear in mind that 15% growth is so low as to be half the the growth in the Mac business and below the likely growth in the overall phone market. Considering the risk premium on equities, this growth forecast assumes essentially a no growth scenario. But even with no growth, Apple's cash flows are huge and thus they should add up to some significant present value. Since we know the value as reflected in the current price, we can work backwards to determine the discount rate being applied to those future flows. In other words, we can calculate how risky Apple's existing product cash flows are seen to be.

    Based on  assumptions originating from analysts' consensus, we can construct a simple model that will approximate the discount the stock market puts on Apple's future cash flows. Let's have a look at an adjusted Gordon or dividend discount valuation model on EBIT basis:

    Shares are valued based on the projected future cash flows of a company. Discounting EBIT with Weighted Average Cost of Capital and subtracting growth will yield enterprise value (= market capitalization - cash).

    Applying analysts’ assumption of close to zero growth to Apple's post 2012 EBIT means EBIT stays constant for 2013 and beyond. Let’s solve for the implied capital costs. Right away we can eliminate growth (g) as it equals zero. EBIT reflects operating cash flow since in a zero growth scenario CapEx will equal deprecation and there are no changes in net working capital. As Apple has no debt but a cash surplus, WACC will be equal to cost of equity[1].

    Solving for capital cost (WACC) with available analysts' EBIT estimates reveals a discount rate of 15%.

    But let’s remember that analysts have consistently and by a large margin missed Apple's financial performance. So let’s dial in a more aggressive estimate of around $56bn of EBIT for the fiscal year 2012. The discount rate goes up to 19% and implies an EBIT multiple of 5.3x.

    In other words, Apple's cash flows for a zero growth scenario are being discounted at a rate of 15% to 19%. This places the company in an extremely risky category of investment. It is certainly not something that can be categorized as a value stock.

    The discussions on this blog regarding Apple’s valuation have been insightful, but only danced around the triangle of price, earnings and growth. When the growth forecasts are considered vis-a-vis current pricing, the assumptions built into 'consensus' forecasts for Apple are condemnations of the company.

    They present a view of a company that is extremely vulnerable and can neither preserve its current cash flows nor find new sources of growth. It is, quite plainly, a company doomed to commoditization.

    ---

    Notes:

    1. Or one can even assume that cash has a positive effect lowering costs of equity (less indirect bankruptcy costs).