Asymco

Asymmetric Intelligence

Market

  1. Can the BlackBerry recover?

    Research · 73 comments

    The August comScore mobile survey (MobiLens) is out. It measures the penetration or consumption of various mobile products and services in the US over a three month period.

    I track the change in this data over time. Here are some highlights:

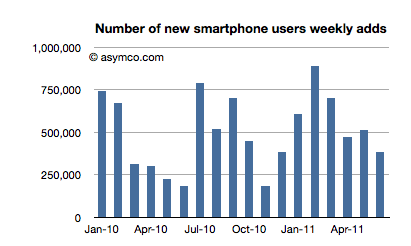
    In August about 520,000 users switched to using smartphones (from non-smart phones) as their primary phone. This is a bit down sequentially from July but about average for the period starting January 2010.

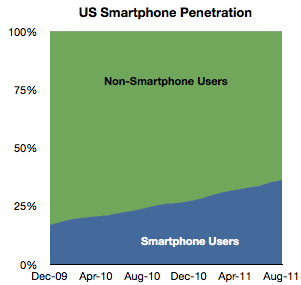
    Penetration increased by about 1 % to 36%.

    Extrapolating this growth implies 50% penetration by September 2012. However growth is accelerating slightly so that tipping point may come sooner. Separately, T-Mobile reported that 75% of its device sales during this year have been smartphones, so if this is indicative of overall US market, then by next year it may in fact be quite difficult to find any non-smart phones to buy.

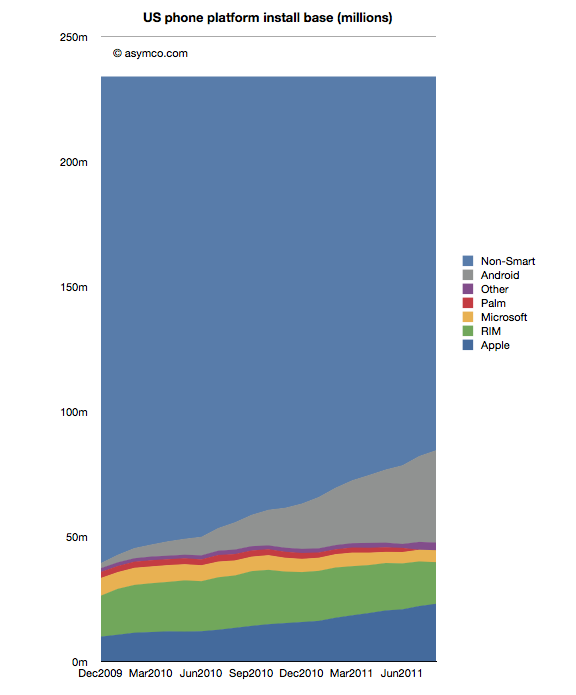
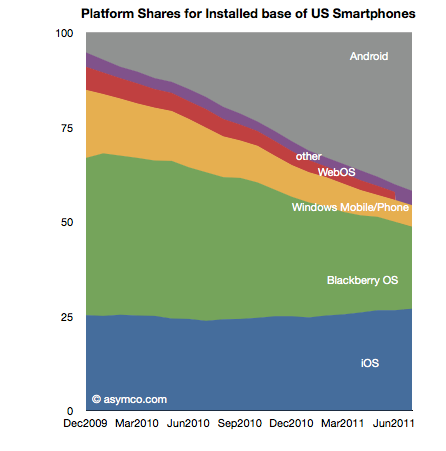
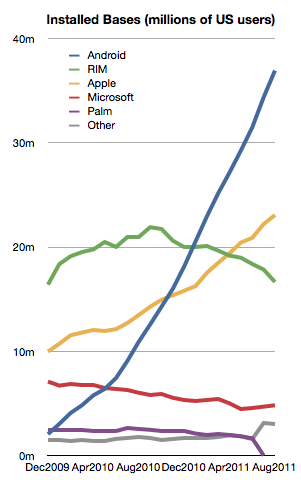
    Among the smartphones, the different OSs have the following installed bases:

    The growth in both Android and iOS has been fairly constant for the last 18 months.

    Microsoft seems to be stabilizing at around 6%

    But RIM shows an alarming deterioration. The company has lost 4.3 million users in the last year and is now at about the same number of users it had in late 2009. This is in a market that has more than doubled.

    With only about 16.5 million US users and an average loss of half a million users per month, unless something drastic happens, RIM could lose its entire US user base by the end of next year.

    During the last month alone RIM lost 1.2 million users. Management insists that new devices will boost sales but here we're measuring the erosion in core users, not upgrades. It's much more likely that those 4.3 million who left BlackBerry went to other smartphones. To move from a BlackBerry to a feature phone seems very improbable to me.

    That means that BlackBerry's pain is probably iPhone or Android's gain. This sort of switch is often painful and I can only imagine that it's done with some reluctance. All the more remarkable then that RIM could not offer incentives to stay. The BlackBerry brand is fading rapidly and brand value is very hard to re-build.

    There's one more thing.

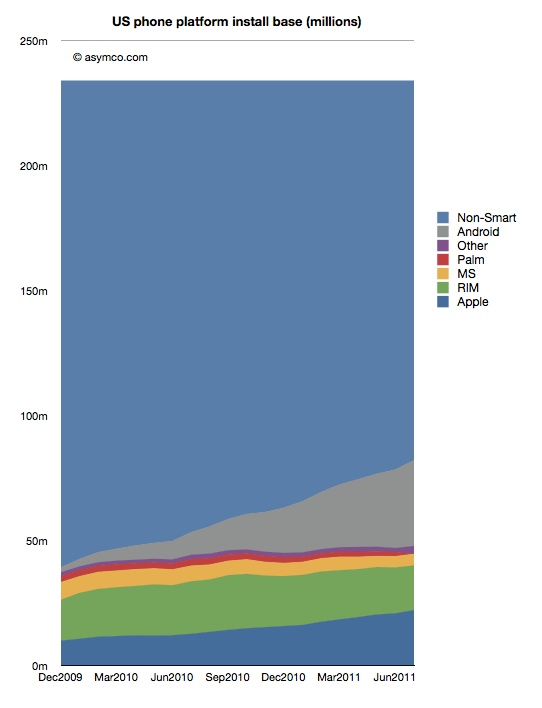
    We can see platform rivalry in the installed base chart but the bigger battle is the competition with non-consumption. The following chart shows how overall platforms are faring as they carve up the feature phone market.

    There are still 150 million Americans whose primary phone is not a smartphone. The conversion of those users is happening at a consistent pace but there are many years of growth remaining. I've often wondered if and when this pace would moderate. I suggested perhaps at 50% there would be an inflection point as the "easy money" would already have been made.

    Much of that will depend on how the product (device + service) will be priced. It's hard to get data on overall pricing. We can get some subsidized phone prices (for example now ranging from $0 to $400 for iPhone and probably similar for Android). What we don't have is an average device+service price point for the industry. That's what I would like to keep an eye on.

  2. At $2.9bn/yr apps are challenging songs as the most valuable online medium

    Research · 16 comments

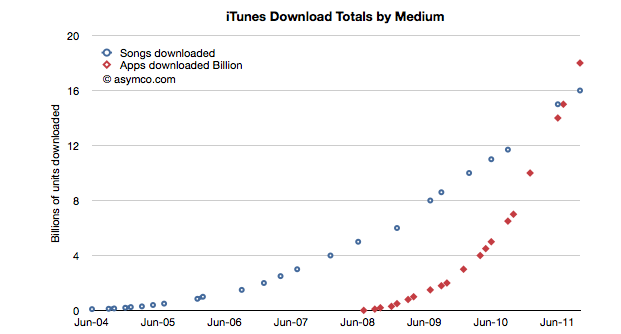
    During the October iPhone event Apple gave an update on the app and song download totals. This is a reliable gauge of the iTunes ecosystem performance and Apple has been supplying these numbers for several years.  Plotting these numbers gives us a good idea of the trend in mobile content consumption. Here is the data to date:

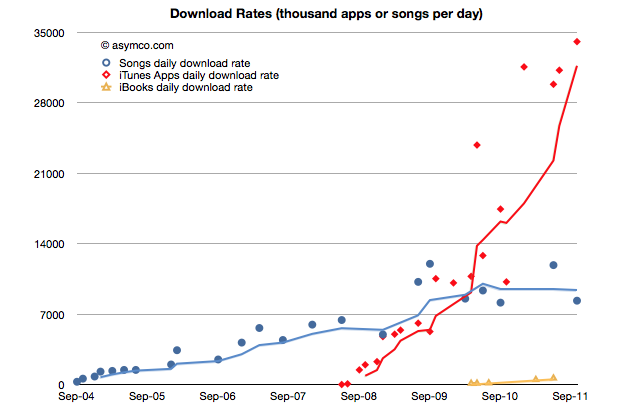
    The total number of apps downloaded (excluding updates) overtook songs in June/July and continues on its trajectory. In fact, the rate of downloads for Apps is now over 1 billion / month. Given the data points above, I calculate it to be about 34 million per day. The corresponding rate for songs is 8.3 million per day.

    You can see the rate of downloads as it's changed over time here:

    I used trailing four periods' moving average for the lines to show the trend more clearly. The gap in download rates is large and increasing.

    Now most observers would note that songs are much more expensive than apps, especially since there are no free songs and many apps are free. This would imply that the music business is probably more valuable than the app business.

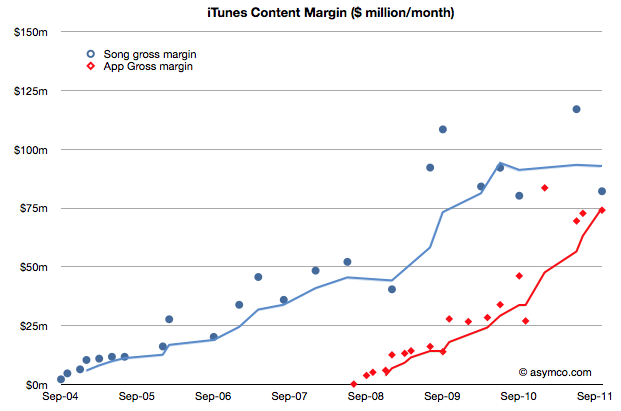
    That's true, but not by much. To determine how much, I used the other data point offered: $3 billion in payments to developers. Since that represents 70% of gross revenues to Apple, we can determine that the average price per app is now 23.8c (down from 28.5c in April 2009)[1]. Knowing the app price we can plot both revenues and the margin that Apple keeps.

    We can compare that with the margin that Apple keeps from songs (assuming a price point of $1.2 per song and a 73% pay-out to labels.)

    The data jumps around quite a bit but the trend is pretty clear. After paying the content owners, iTunes is left with about $75 million per month from apps and $85 million per month from songs.

    Apple then needs to pay other direct costs like credit card processing, bandwidth, storage, curation and testing. Then there are other operating expenses like R&D and marketing. These costs add up such that, according to Apple, they cover revenues, yielding a break-even operation.

    Break-even or not, the way the data is trending it's pretty clear that Apps will be responsible for a the majority of content cash flow at Apple.

    At a billion downloads a month (and rising) the value in terms of revenues is already a run rate of $2.9 billion per year. This has been enough to overtake a business that has been running for more than seven years.

    ---

    Notes:

    1. The payments to developers probably includes in-app purchases.
  3. Why is there no iPhone 5?

    Research · 243 comments

    I've been asked what will be the effect on the market of the iPhone 4S. Actually the question was what would be the effect on the market of there being no iPhone 5.

    I'd answer that the iPhone 4S is a product designed to compete for two markets: (1) half the current iPhone users who bought a phone prior to the iPhone 4 and (2) non-iPhone users, typically non-smartphone users.

    I'll describe each market briefly.

    The current iPhone users

    Tim Cook said that half of all iPhones sold to date have been iPhone 4's. That means that about 70 million iPhone 4's have been sold. Those are not a target market because of three reasons:

    1. The vast majority of those users are still paying for their iPhone 4 through the subsidy model used to sell them and to change phones today would incur a cash penalty.
    2. Customer satisfaction surveys show that they have 90%+ satisfaction rating for their iPhone 4 and we can therefore assume that they are not looking for something better
    3. Their iPhones are practically new and they still work and are upgradeable.

    The other 70 million or so iPhone users have either a 3GS or a 3G iPhone. These are a very different market for three reasons:

    1. They have already paid off their iPhones. They would not face any extra costs in switching to a new iPhone
    2. Earlier customer satisfaction surveys showed that they once had 90%+ satisfaction with their product so they are likely to stay with the brand.
    3. Their iPhones are getting old and beaten up after two years of use.

    The current non-iPhone non-smartphone users

    This market is so vast that it's practically infinite. Over 1.5 billion phones are sold each year and Apple only has about 5% share. Therefore there is a vast pool of users who probably have been interested in getting an iPhone. These potential buyers will find the iPhone 4S an attractive alternative to buying a non-smart phone. They will also notice that there is now a range of price points for various iPhone models starting as low as zero.

    Current non-iPhone smartphone users

    I'll add this market to complete the picture. This market is similar to the current iPhone 4 market because, except for Blackberry, most smartphones have been purchased in the last 12 months. This is especially true for Android phones. These owners of smartphones are unlikely to be interested in switching a phone that is "brand new" unless they have a very poor satisfaction with it. If they are not satisfied, there are many options, and iPhone is one of them. There are too many conditionals in this market and I therefore don't think it's a good target for the iPhone 4S.

    So What are the prospects for the iPhone 4S (and other iPhones)?

    The market for the new iPhones could then be summarized as follows: 70 million early generation iPhone users who are eager to upgrade (with 90% probability) plus a subset of a billion buyers of new phones next year who are looking for their first smartphone. These two markets iPhone 4S is targeting are "easy" because the competition is weak. It's either "don't upgrade my old iPhone" or "buy a dumb phone or another smartphone for almost the same price as an iPhone".

    I don't see the result for units sold being different if there was a hypothetical iPhone 5 vs. the current iPhone 4S (and 4 and 3GS as a portfolio). In fact, a "better" iPhone would not be better at winning this competitive battle because the bar is so low.

    So to answer the question in the headline: because an iPhone 5 is not needed meaning that it would over-serve the market and price itself out of contention.

    The question will be very different a year from now when most early Android buyers will be looking for a new phone and when most iPhone 4 users (all 70 million of them) will be looking for a new iPhone. That would seem like a good time to introduce a new iPhone "5".

  4. Sprint's gamble

    Research · 61 comments

    The Wall Street Journal reported that Sprint Nextel made a "multibillion-dollar" gamble on the iPhone. This is based on information that Sprint committed to buy 30.5 million iPhones over the next four years.

    Wall Street Journal reporters calculated that the deal is worth around $20 billion on the basis of iPhone ASP during the last quarter (about $650). That Sprint would get that price is possible but not necessarily correct as there is likely to be some discount and the ASP Apple receives includes accessories.

    But the "gamble" is more than the deal value. The way it's being reported is that Sprint bet the company on being able to sell this many iPhones. So naturally we have to ask: how hard can it be to sell 31 million iPhones?

    First, note that the order is over a four year period. It's also not likely to be linear, with volumes accelerating over time. If I estimate a ramp where in year one the commitment is for 4 million, year two 6, year three 9 and year four 12 million we get a total of 31 million. Can Sprint sell this volume?

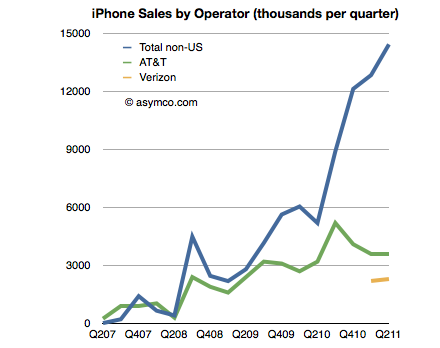
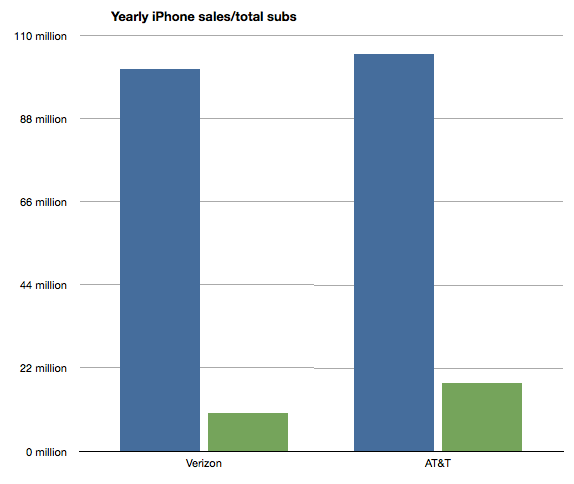
    To get an idea we can look at the sales rates for the other US operators. I built a table of iPhone sales by Operator last July. The data is shown in the following chart:

    What is interesting is to see the number of iPhones sold in a given time frame as a percent of subscriber base. I chose to measure a year's worth of iPhones where I extrapolated Verizon's volumes from the six months reported so far.

    The ratios are that Verizon sold iPhones at the rate of about "10% of its subscriber base per year". AT&T has been selling at the rate of about "17% of its subs per year". If we average these two we get about 13.6%.

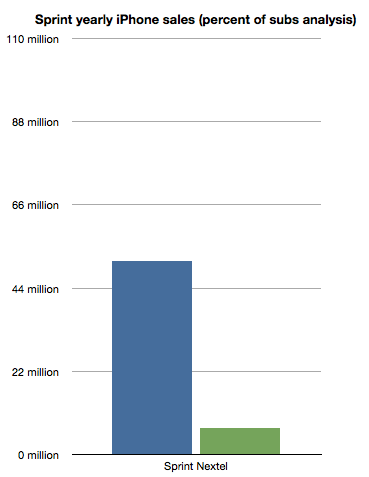
    So if we assume that Sprint can sell iPhones at about the same rate as Verizon or AT&T (as a percent of their user base which was 51.1 million) we get about 7 million iPhones per year.

    That's right in the middle of the range it needs to get to 31 in four years [4,6,9,12]. I charted the projection on the following chart:

    So the gamble Sprint is taking is that they will be able to sell iPhones at the same rate as Verizon and AT&T.

    How is this risky?

    The deal seems to be inline with what is known about the product's popularity and the pattern of purchasing and upgrades that US consumers have been exhibiting for a few years.

    As with AT&T and Verizon, volumes ramp up over time. As with AT&T, users are loyal and they upgrade regularly. As with Verizon, there is competition from Android and Blackberry. As with both, payment is expected up-front with payback over the duration of contract length. As with the others, there will be incentives to keep churn down.

    If anything the riskiest thing for Sprint would have been not to do the deal at all. Indeed, we'll get to see the effect of that option on T-Mobile.

  5. The case against the Kindle as a low end tablet disruption

    Research · 229 comments

    In an Harvard Business Review post Rob Wheeler makes the case for the Kindle Fire as a disruptive innovation. I believe that it is but crucially I disagree that the Kindle Fire is a low end disruption.

    My assessment of the Kindle Fire is based on the two attributes which Amazon highlights as the key selling points which offer a basis of differentiation and potential for asymmetric competition: a low price and a new browsing model. I believe that these two attributes result in two opportunities: one for low end disruption and another of new market disruption. I reject the first and tentatively support the second.[1]

    The price

    It's immediately obvious that the price point of the Kindle Fire is well below alternatives. That forms the basis of disruptive potential, but before we jump to analyzing the disruption hypothesis we should determine whether and to what extent Amazon profits from the device directly. Profitability gives us a clue to where Amazon will apply resources and thus establish its trajectory of improvement.

    We know the margin on the Fire is low because we can calculate the bill of materials for 7" tablets. Gene Munster of Piper Jaffray estimates that Amazon "loses" $50 for each unit sold. We also know that the design Amazon used is essentially very similar to the RIM PlayBook and was sourced from the same ODM. RIM priced the product at $499 but has struggled to find buyers and is reluctantly dropping the price. We also can estimate that Apple with a product having more than twice the screen size is keeping modest (~30%) gross margins for at a price point approximately double that of the Fire. It does seem that Amazon does not have much or any margin to dip into.[2]

    So the Fire can be classified as a low price product. Does that make it a low end disruption?

    Disruption requires asymmetry but it also requires the ability to go up a trajectory of improvement along the basis of performance that a majority of users demand. The first condition is met, but what of the second? In a combined system where one asset is used to leverage another--the subsidized being sacrificed to benefit the profitable--success is conditional on one element being "good enough" while the other "needing improvement". Investment follows accordingly.

    But investment decisions have consequences. The subsidized device is starved of investment while the profitable service is nurtured. We see evidence of short cuts in investment in the off-the-shelf nature of Kindle products: from a second-hand (unsanctioned) OS to a second-hand (ex-RIM) hardware. Meanwhile, Amazon spends heavily on capex for the infrastructure that delivers the profitable content.

    If the hardware is indeed commoditized and cannot be usefully improved, then this model works. If, on the other hand, the hardware and systems software can benefit from dramatic improvements in technology then the model fails. The very asymmetry of a service vs. a product turns into the latter having all the advantages and the former failing to gain traction.

    I'll give three examples of this how service model creates limitations which lead to a failure to disrupt a product model.

    The Game Consoles

    The first is the game console business. In consoles, the vendors maintain long hardware product life-cycles to recover their hardware investment and subsidy by maximizing the number of games attached to each console. If you plot product cycles you realize that the bigger the subsidy, the longer the hardware lifecycle. The result is a very wide turning circle which prevents innovation in new dimensions.

    Consider that the Playstation or the Xbox could have been a low end computing disruption. The original Xbox was in fact a PC. It was supposed to bring PC dynamism to the console business and create a cottage industry of new developers building games on commoditized hardware. However by the second generation the Xbox was a locked down, custom architecture, pure gaming machine. Gone was Intel, gone was the PC architecture and gone was any dream of cheap development.

    This is entirely due to the economics of subsidized hardware. It compelled Microsoft, the world's greatest software company, built on the open and cheap PC architecture to make closed, expensive hardware. Sony followed in kind as did Nintendo. Each generation of consoles was a sustaining improvement on gaming and had no ambition beyond gaming[3]. The subsidy and the dependence on an integrated content value network led to a distinct lack of disruption and an insular industry which continues to seek out increasingly immersive experiences for increasingly demanding customers while itself being disrupted by casual, mobile gaming.

    The Set-top boxes

    The second example is the TV set-top box business. There again, the vendors maintain long hardware cycles in order to recover subsides. There too, the main value driver is the content and its distribution which stipulates the architecture, and through subsidy, defines its evolution. This offers the vendor no motivation to improve the user experience[4], secondary uses or the absorption of new streams of content (like those the internet can offer.)

    Again, the set-top box could have been a budding disruptive opportunity for Microsoft. They invested billions in the 1990s to acquire placement of software on set-top boxes in an attempt to penetrate the living room. And again Microsoft was not alone. Since then Tivo, Google and Apple and many others tried to attach cheap hardware to video streams. They all failed to get on a disruptive trajectory. And again, the blame can be placed on the stifling effect of subsidies and dependencies on services or content which dictate where the value and hence the investments should go.

    The Blackberry

    The third example is the RIM Blackberry. Although RIM made most of its money on hardware and was by no means subsidizing it, the differentiation of their product was undoubtedly its service value. Both as a corporate device with BES and as a consumer device with BBS, customers "hired" the product as a service. By being committed to this model RIM management became blind to the hardware and client OS software innovations coming down the pike.

    Through their own admission, they could not accept a touch screen because it would make the messaging experience too slow and it is messaging that sells Blackberries. They could not accept apps (and hence platform orchestration) as a differentiation because their customers did not hire Blackberries for "lifestyle apps". Merely being differentiated as a service leads to blindness and enough hesitation that you run off the disruptive rails.

    People ascribe myopia or incredible absence of mind to RIM's management but the opposite is true. They were deeply committed and observant of the things which made the Blackberry successful. It just happened to be something that stopped being relevant.

    The iPhone

    I'll add one more "bonus" example on this. The iPhone is also a subsidized product and it seems very successful. How come it won? The answer is in details. As I mentioned, the other products ended up in poor life cycles or incorrect motivations. The iPhone differs in that the lifecycle of the product is much shorter (2 years ownership with 1 year for product updates). The shorter lifecycle works for the iPhone because it has a very high service revenue base to dip into to offset the subsidy. Something none of the content models above could count on.

    Consider that each game console subsidy needs to paid off by a handful of game titles whose royalties to the console maker are modest. Or that the TV box needs to ride on top a service that also has thin margins from a stable or slightly shrinking user base. In contrast, the iPhone enables vast new consumption worth thousands of dollars to the operator. This is the famous ARPU uplift that smart phones enable. Users are doubling their telecom spending when they move to smartphones.

    The margins for Kindle content are thin. Very thin. Apple runs its content business at break even though it transacts billions of items per month. The amount of content that needs to pass through the Kindle ecosystem (with lower prices than Apple charges) will need to be astronomical to make it profitable on the shortened cycle time the iPhone enjoys. Thus the Kindle is likely to languish in a leisurely update cycle with users encouraged to hang on to their devices for years. This is the case at least with the original e-Ink Kindles. How eagerly awaited are new generations? How many users stampede to update the hardware or even upgrade the software? How many users have owned every version of the Kindle?

    Service Scale

    Finally one last point about services. As Amazon asserts, they see Kindle as a service, which, I concede, is asymmetric to a product business. The problem is that services don't scale as well as products. Consider that none of the content streams that Amazon will depend on are available outside the US. The Kindle has not been a strong seller internationally. This is because book rights are limited to national boundaries as are movie rights and song rights. Apple has only this week finally completed the rollout of iTunes music to all of Europe! A process that took almost a decade. And they are still unable to sell music in most of Asia and forget about movies or TV shows.[5]

    The reality is that there are no global service brands. Not in telecommunications (operators are, at best, regional), not in Media (TV, radio, publishing are a local businesses), not in Banking (not even in commercial banking) and not in Retail (even Wal-Mart was humbled trying to export its disruption). The internet has not broken down any of these boundaries and even Amazon has modest reach outside the US for any of their franchises. Services are local but products can be global.[6]

    To wrap up, this discussion on the asymmetry of device-based services to product models leads me to conclude that the Fire will not have the opportunity to disrupt the iPad or tablets in general. Amazon sees the hardware and software of a device as a commodity and the content and its distribution as valuable. This assumes that the device is "good enough" and will not require deep re-architecting or that new input methods can be easily absorbed. In short, they see the tablet as at the end of its evolutionary path. Apple sees the exact opposite. The iPad is 18 months old, and as they say in the ads, they see it as only the beginning.

    ---

    Notes:

    1. Due to length of discussion, in this post I will make the case against the low end disruptive potential and use a second post to make the case for it being a new market disruption.
    2. Presumably, Amazon will also distribute only through Amazon.com and thus not incur channel mark-ups. This means that comparisons with other tablets should be at a price nearer to 70% of retail.
    3. Gaming networks and video streaming are extensions but neither leveraged open architectures.
    4. See also discussion from June 2010 on the challenges to Apple TV that Steve Jobs enumerated.
    5. Apps are another story. Because it controls the medium, Apple can and does sell apps in every country where the iPhone or iPad or iPod touch is available.
    6. Note also that because of distribution through Amazon.com, the Kindle cannot reach as many buyers as a tablet selling through the tens of thousands of points of purchase that operators and retail shops offer.
     

  6. Comparing top lines: Apple vs. Microsoft

    Research · 96 comments

    I've been providing analysis of Apple's operating and financial performance for some time. Recently we've begun to look at comparisons of financial performance for comparable companies. Now it's time to dig deeper and do comparisons of operating performance as well.

    To start, Microsoft.

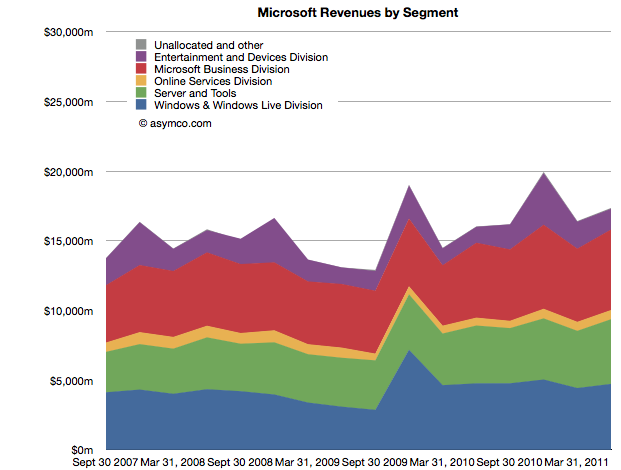
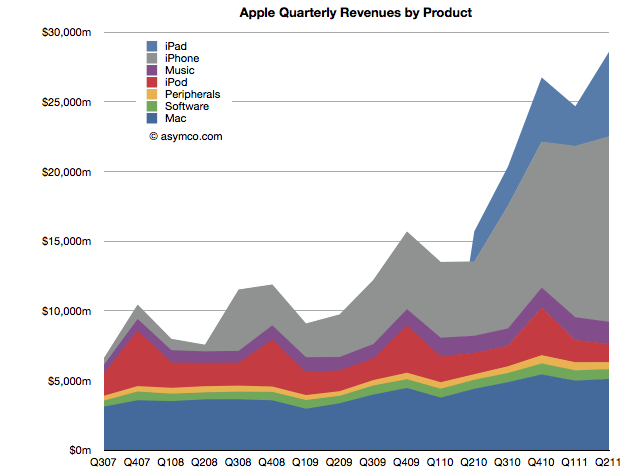
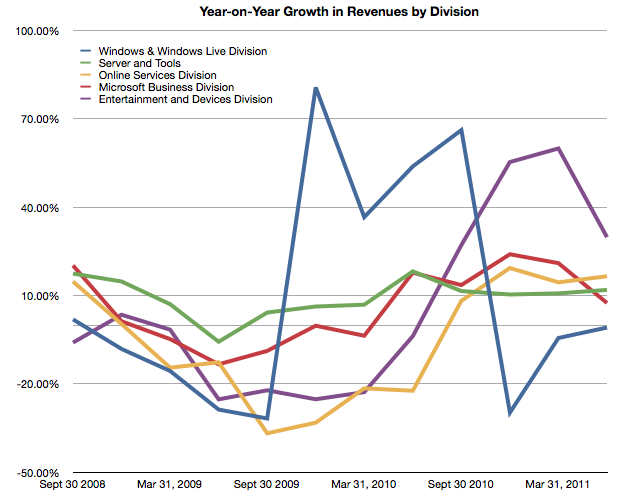
    Whereas Apple has product lines (iPhone, iPad, iPod, Mac, iTunes, Peripherals and Software), Microsoft has business divisions (Windows & Windows Live, Server and Tools, Online Services, Business (Office), Entertainment and Devices). The charts show revenues for both Apple and Microsoft according to these defined segments.


    The second chart should be a familiar one:

    Note that the horizontal and vertical axes are the same. The period of coverage is from mid-2007 to the end of June 2011 which corresponds to the life of the iPhone. The vertical axis ranges up to $30 billion/quarter in both charts.

    When shown this way, the exceptional growth for Apple becomes easier to understand (and perhaps Apple's valuation premium of 15.7 P/E vs. Microsoft's 9.5). Microsoft has been growing these past four years but not nearly at the rate of Apple. Microsoft grew quarterly revenues from the ~$15b range to ~$17b range.

    Additional points of interest:

    • The Mac business generates more Revenue than Windows
    • iOS powered devices generate more revenue than all of Microsoft's products put together
    • Apple's revenues grew 413% since Q2 2007 while Microsoft's grew 26%
    • The release of Windows 7 had a marked effect on revenues in the launch quarter but the sales did not seem to grow above the previous version's run rate ($4.2b/quarter vs. $4.7b/q on average).

    But most importantly, whereas Apple's growth has come from new businesses (iPhone and iPad), Microsoft has organically grown existing businesses. The condemnation of leadership at Microsoft should hinge on the absence of significant top line growth. Note that neither the Online Services nor the Entertainment and Devices divisions had appreciable net growth.


  7. The perils of possession without utilization

    Research · 174 comments

    [Updated with new charts including data from StatCounter and not NetMarketshare]

    Generally speaking there is an equivalence drawn between iOS and Android as technologies and even as user experiences. However, as I've pointed out on several occasions there is a very clear nonequivalence in business models and thus the "fuel" which keeps each platform running. But does this difference in models lead to some difference in the way the products are "hired" to do what they do. Does it imply anything about how the products are likely to evolve?

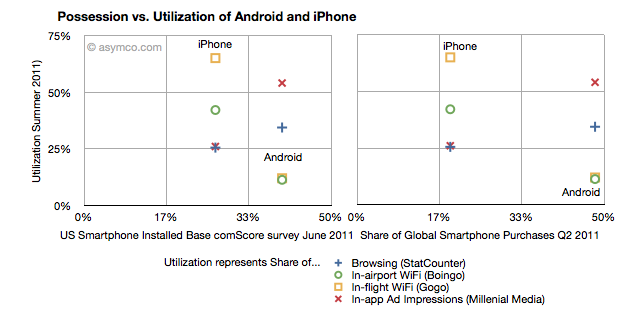
    I collected into one place all the data I could find about utilization (how much of a service and how often it's used) and possession (both in terms of current ownership and new acquisitions) of iOS and Android.

    Possession data comes from comScore survey data of share of US installed base of smartphones by platform at the end of June 2011 (first chart) and share of Global Smartphone Purchases as of Q2 2011 sourced from company reports and IDC (second chart).

    Utilization data (vertical axes) comes from August  2011 shares of mobile browsers (from StatCounter June 2011), in-airport WiFi associations from Boingo in June 2011 (iPhone vs. Android), in-flight Wifi associations from Gogo in June 2011,  and In-app Ad impressions from Millenial Media also in June.

    The charts are divided into nine sections corresponding roughly to "low", "medium" and "high" utilization vs. possession.

    The first chart compares a US-only population for possession vs. a mixture of global and US-only populations for utilization. The second chart compares a global population to the mix of US and global metrics.

    What I found interesting is that if we take ad impressions (red X) and browsing (blue +) data out, the two platforms are indeed quite distinct. iPhone has a medium level of possession with a high level of utilization of data services while Android has a high level of possession with a low level of utilization. The data is also nicely clustered.

    If we take just the ad impression or browser data then the platforms are quite similar: medium utilization for medium possession and high utilization for high possession. If the two platforms were to swap places in possession (i.e. market share) then they would probably also swap places in utilization (i.e. impressions).

    What the data seems to suggest therefore is that for data services the iPhone is a far more popular tool than Android. But for in-app ad impressions and browsing the products are used in a similar manner.

    The big difference is however that the services where iPhone utilization is high are those where users have to pay something. Most (if not all) of the ad impressions in apps are for free apps. So ad consumption scales with possession. But non-free services don't. This data seems to support the hypothesis that Android users are disproportionately less willing to spend money (note that the data does not say that users don't have money, but simply that they are not spending it). The other data which backs this hypothesis is that paid app sales on Android trail quite far behind the rate of purchase on iPhone. That could be due to payment problems in the Android marketplace but this data shows that there is some other effect as well.

    Why is this important?

    We can argue that Android is a low end product and that it disrupts and that this is consistent with that positioning. However it also indicates that the value is not in that ecosystem. And ecosystems are what sustain a platform in the long term. This debate will continue but I am reminded of other platforms which had similar patterns.

    Both the Blackberry and Symbian had high possession (in terms of share) with very low utilization. There were lots of surveys which showed that browsing, app downloads and "monetization" of services after the sale of the handset were low. Much was written about it being due to poor experiences. But learned observers today insist that the experience on Android is as good as on the iPhone.

    So why is there less economic participation from Android users? It's not just about these proxy services, but all manner of activities which enrich an ecosystem. Possession without utilization implies a product that does not do its job. Its features are not being absorbed. Why would that be?


  8. The third ecosystem. What are the odds?

    Research · 146 comments

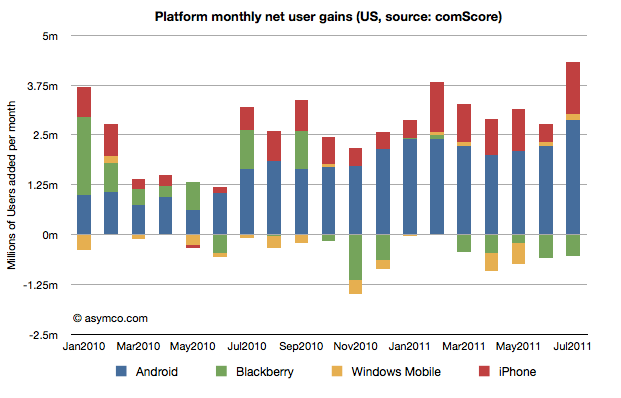
    The latest survey from ComScore breaks down the installed base of specific mobile platforms in the US. Tracing the data over time shows the following charts:

    In the last month Android gained about 2.9 million users, iPhone 1.3 million, Blackberry lost 530k users and Windows held on with a gain of 132k. Other platforms had a net loss of 95k users.

    In the last 12 months, Android gained 25 million users in the US. iPhone gained 9.5 million while Blackberry lost 3.2 million and Microsoft lost 1.6 million. Other platforms had a net loss of 1.2 million.

    The total net gain of smartphones was about 29 million new users.

    RIM switched from being a consistent net gainer of users to a consistent net loser of users in October 2010. Windows Phone is showing signs of holding the line on user base erosion but share remains below 5% (now at 4.7% vs. 4.6% last month). To put the mountain-sized hurdle in perspective, Android now has 7 times more users in the US while iPhone has about 5 times more. To become the largest mobile platform in the US, as some analysts are predicting, Microsoft has a 12:1 disadvantage that looks to continue to grow.

    Those are some pretty tough odds.

  9. Nokia vs. Android

    Research · 82 comments

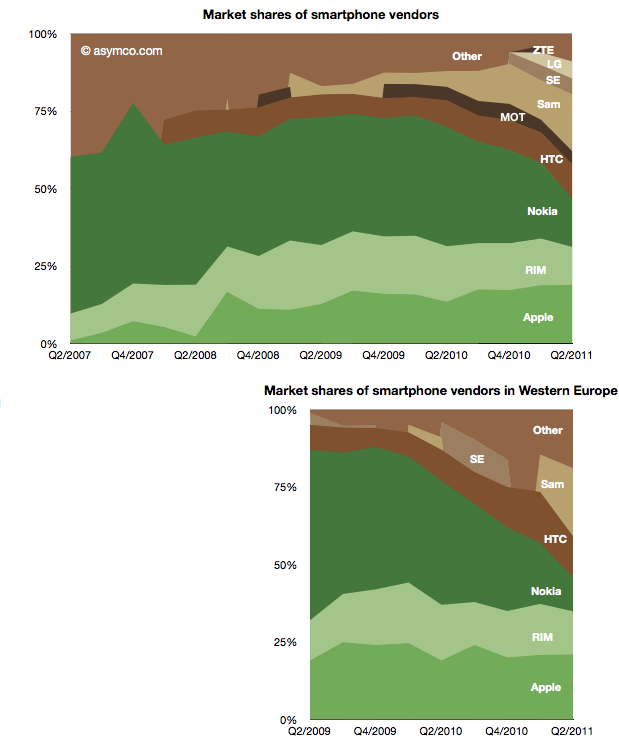
    Two years ago Nokia sold 30% of its smartphones in Western Europe. Today it sells 15% in that market. Its unit shipments went from 5 million to about half that and its market share went from 55% to 11%. Its rank in the market went from first to fifth.

    The fall is exceptional and dramatic. The two charts below show smartphone market shares. The top chart shows global share and the second shows Western European smartphone shares (European share data sourced from IDC).

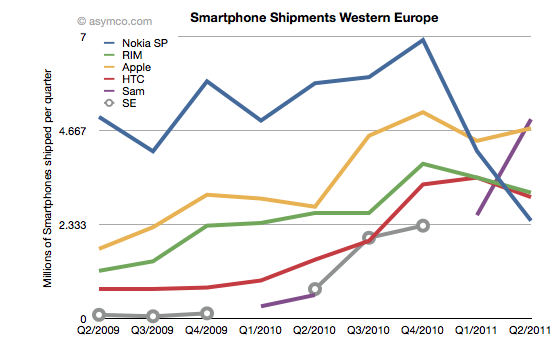
    The other perspective is shown the the following chart which shows actual units shipped.

    One striking thing is how volumes collapsed into Q1 and Q2 this year, coinciding with the public decision in February to deprecate Symbian. The other interpretation I would make is that within the two year time frame Nokia's share has been completely absorbed by Android, not Apple. Whereas most commentary shows Nokia suffering at the mercy of Apple, it's Android that took share in Europe.

    Can a Windows Phone portfolio turn Nokia's fortunes around? The first problem is that such a portfolio will not be available until next year. The second problem is that the competition will not be standing still. The third problem is that the market itself may not be growing as fast as expected.

    It's becoming increasingly difficult to see how Nokia can weather this turbulence and odds are against it.

  10. Updated AMP Index for Q2

    Research · 29 comments

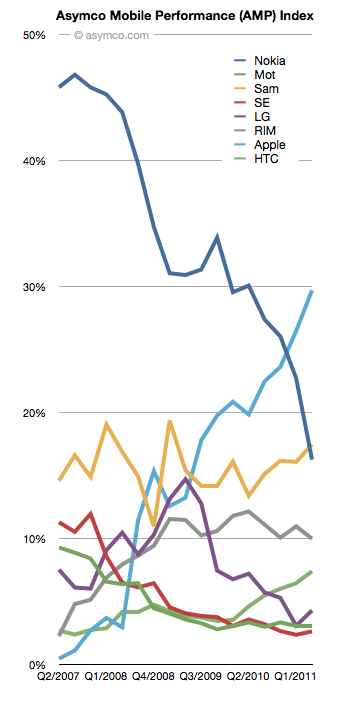
    This is an updated view of the AMP index including Q2 data. As a reminder, the AMP (Asymco Mobile Performance) index is an unweighted average of four “shares”:

    1. Share of all handset units sold (global)
    2. Share of smartphones
    3. Share of value (revenues)
    4. Share of profits

    You can see the last quarter's standings here.

    The updated index figures and spark lines are shown also on the right-most column on this site.

    The biggest mover was Nokia which dropped 6.5 points. The second mover was Apple, with a gain of 3.2. Samsung followed with a gain of 1.38 and LG with a 1.21 and HTC with a gain of 0.95.

    RIM lost about 1 point and Motorola and Sony Ericsson remained nearly flat.

    The plunge in Nokia's AMP score is nearly matched by Apple's gain over the four year time period observed.

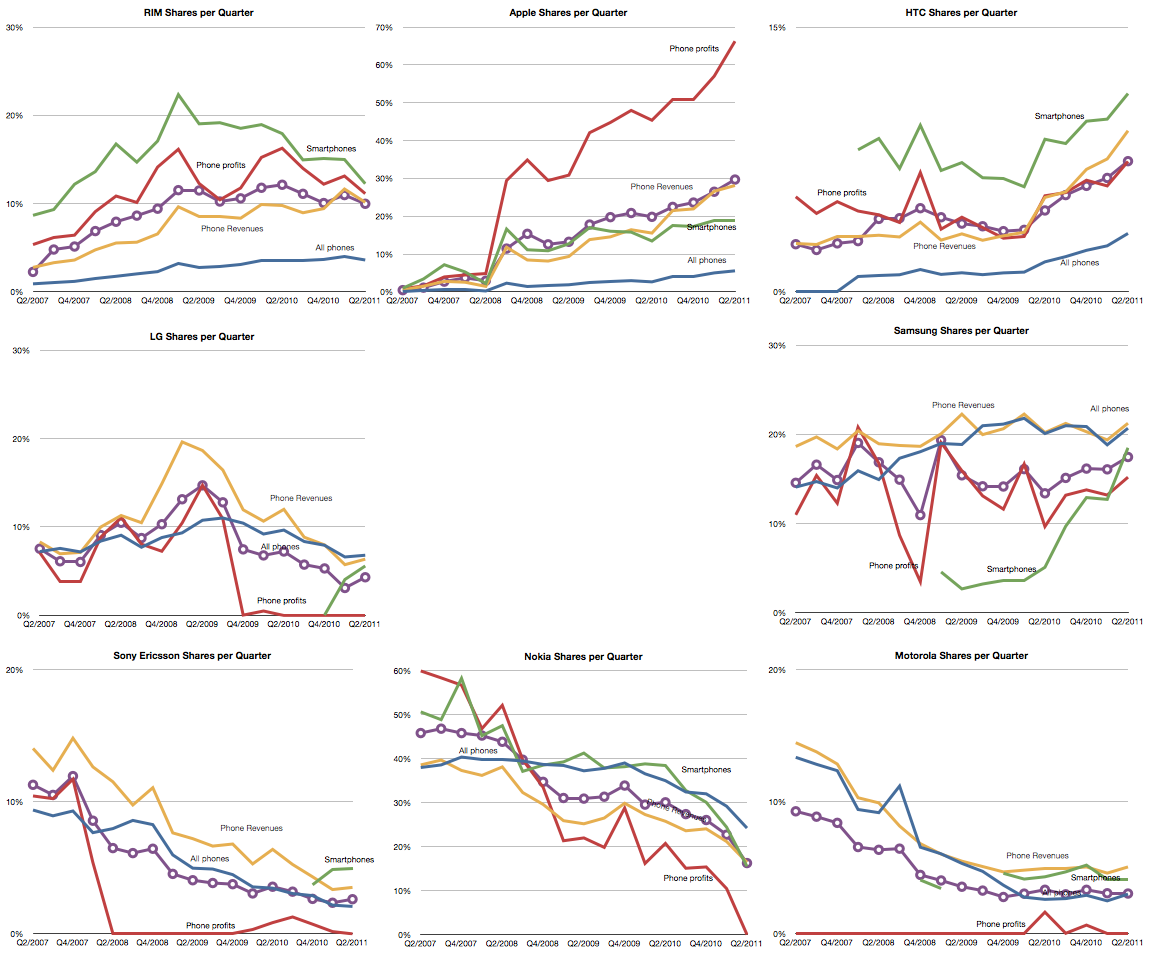
    The full picture of each component is shown below:

  11. 155 million American mobile phone users don't use smartphones

    Research · 18 comments

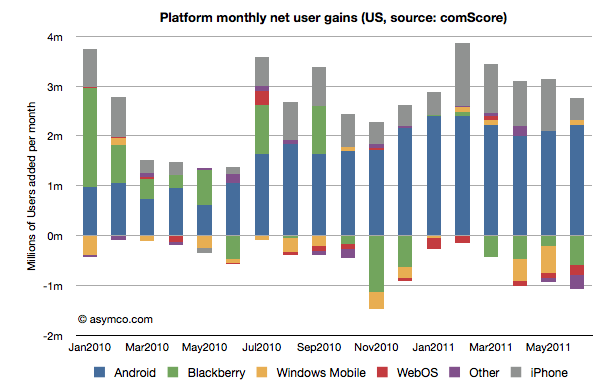
    ComScore's latest survey data shows the following net user gains in the US smartphone installed base:

    In summary, the key data points for June:

    • 2.8 million new smartphone users in three month period ending June (vs three month period ending May)
    • Of the total 78.5 million users, about one million switched platforms
    • RIM had a net loss of about 600k users
    • WebOS lost about 195k users
    • "Other" (mostly Symbian) lost 273k users
    • Windows Mobile/Phone reversed two months of decline and added 100k users
    • iPhone added 452k users (considerably below its approximately 1 million/month run rate for last four months)
    • Android gained 2.2 million users, consistent with average over 7 months.
    • Platform "churn" was at 1.36%, about average over three months

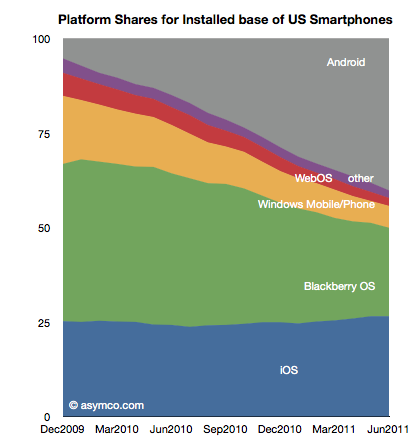
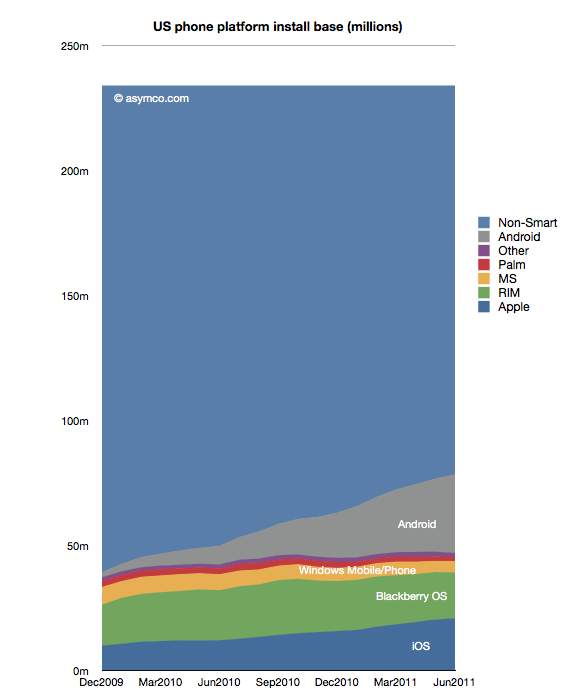
    Installed platform shares for the US market are shown in the following chart

    Platform Installed base vs. non-smart devices is shown below:

    The penetration of smartphones slowed down in June (though that seems to be seasonal). The following chart shows weekly smartphone adds (or feature phone losses as total user base has held constant.)

    Averaging the adoption rate over six months gives a "tipping point" forecast (50% penetration) of October 1st, 2012. That still means that 155 million American mobile phone users don't use smartphones.